
Cancer Cachexia Market Overview:
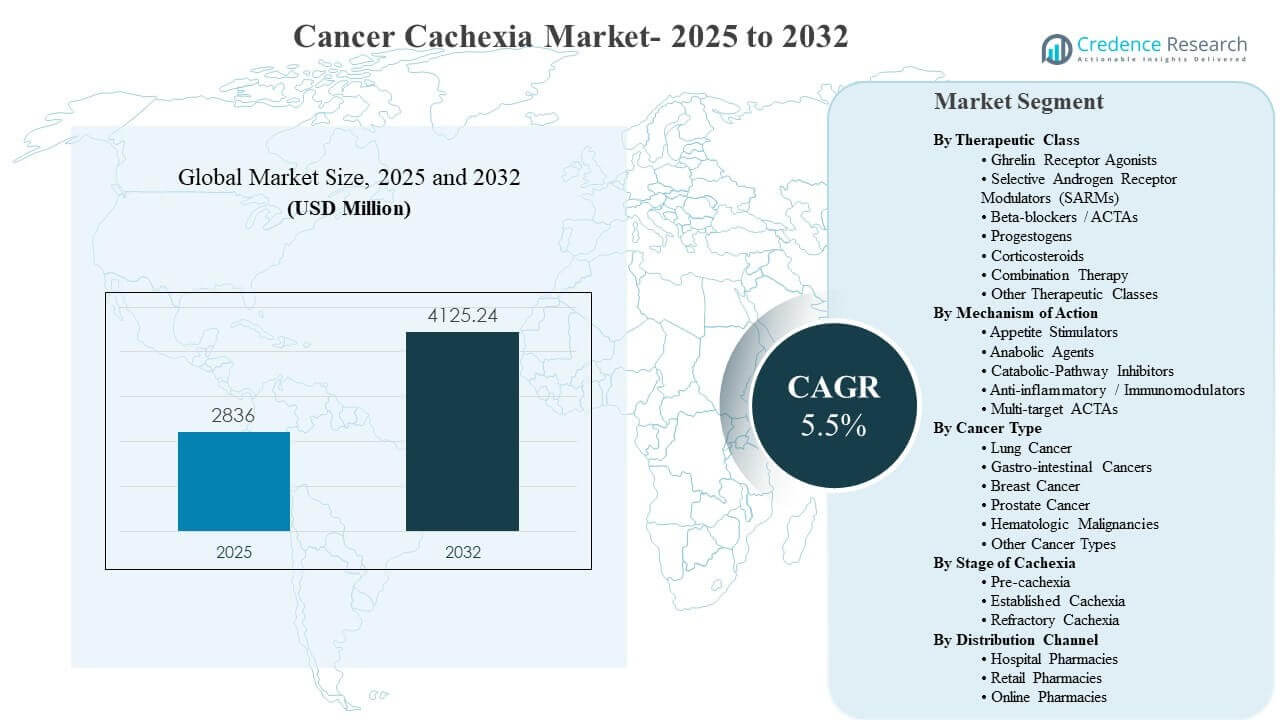
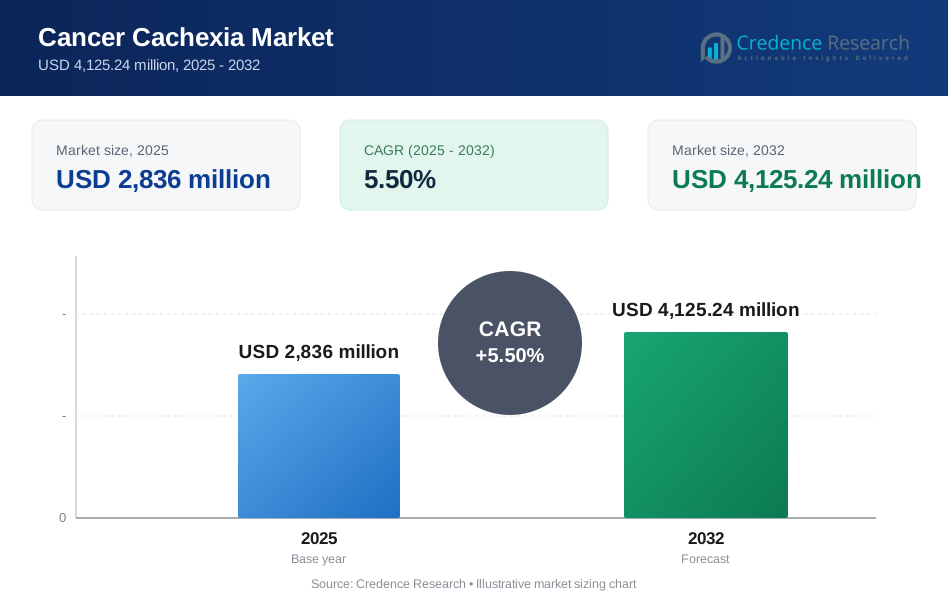
The global Cancer Cachexia Market size was estimated at USD 2,836 million in 2025 and is expected to reach USD 4,125.24 million by 2032, growing at a CAGR of 5.5% from 2025 to 2032. Growth momentum is primarily driven by rising oncology treatment volumes and longer treatment durations, which increase the clinical focus on preserving functional status, tolerance to therapy, and quality of life through multimodal supportive-care regimens. North America remains the largest revenue contributor due to broader supportive-care access and stronger reimbursement coverage across advanced oncology pathways.
| REPORT ATTRIBUTE | DETAILS |
|---|---|
| Historical Period | 2020-2024 |
| Base Year | 2025 |
| Forecast Period | 2026-2032 |
| Cancer Cachexia Market Size 2025 | USD 2,836 million |
| Cancer Cachexia Market, CAGR | 5.5% |
| Cancer Cachexia Market Size 2032 | USD 4,125.24 million |
Key Market Trends & Insights
- The Cancer Cachexia Market is projected to expand at 5.5% CAGR (2025–2032), rising from USD 2,836 million (2025) to USD 4,125.24 million (2032).
- North America accounted for 40.8% (2025), supported by higher supportive-care utilization across oncology centers and earlier intervention protocols.
- Appetite stimulators accounted for 47.3% (2025), reflecting sustained emphasis on managing anorexia and intake decline in advanced cancer care.
- Asia Pacific represented 23.5% (2025), underpinned by rising oncology caseloads and expanding access to supportive therapies in large population markets.
- Europe held 23.1% (2025), supported by structured cancer care pathways and wider integration of nutrition plus pharmacologic supportive care in major health systems.
Segment Analysis
Cancer cachexia care is increasingly managed as a multi-factor syndrome rather than a single-symptom condition, which is accelerating demand for appetite support, anti-inflammatory modulation, and muscle-preservation approaches. Clinical staging frameworks and routine nutrition screening are driving earlier identification, which supports initiation of supportive care before irreversible functional decline. Oncology teams are also aligning cachexia interventions with chemotherapy and immunotherapy schedules to maintain performance status and improve treatment adherence.
Product adoption is shaped by the need for practical, protocol-friendly options that can be initiated in oncology clinics and continued across outpatient settings. Real-world prescribing frequently favors combinations of symptomatic relief and metabolic support, particularly for patients experiencing rapid weight loss, fatigue, and reduced intake. Distribution is influenced by hospital-led initiation and monitoring needs, with follow-on fulfillment expanding through retail and online channels where continuity and convenience improve.
By Therapeutic Class Insights
Combination Therapy leads therapeutic-class adoption because cancer cachexia management often requires appetite support alongside anti-inflammatory control and anabolic reinforcement to address multiple pathways simultaneously. Clinicians increasingly select therapy mixes that align with the primary symptom cluster and treatment tolerance goals. Ghrelin receptor agonists and SARMs attract attention where lean-mass preservation is prioritized, while corticosteroids and progestogens remain used in symptom-focused supportive care pathways, particularly in advanced disease settings.
By Mechanism of Action Insights
Appetite Stimulators accounted for the largest share of 47.3% in 2025. Appetite stimulators lead because anorexia and reduced intake are among the most immediate clinical issues affecting functional status, treatment tolerance, and patient well-being. Supportive oncology protocols frequently prioritize appetite improvement to stabilize weight trajectories and reduce therapy interruptions. Pipeline activity and broader awareness of cachexia screening are also expanding initiation of appetite-centric regimens earlier in the care journey.
By Cancer Type Insights
Lung Cancer represents the highest clinical burden for cachexia management due to higher prevalence and severity of weight loss and muscle wasting in thoracic oncology pathways. Advanced-stage presentation and intensive multi-line therapies increase the need for supportive regimens that maintain strength and daily functioning. Gastro-intestinal cancers also contribute strongly because malabsorption, dysphagia, and treatment-related GI effects amplify nutritional decline. Breast and prostate cancer cases create steady demand where long treatment durations increase the need for sustained supportive care.
By Stage of Cachexia Insights
Pre-cachexia and established cachexia stages drive earlier intervention strategies as oncology teams seek to preserve muscle function and slow deterioration before refractory decline. Clinical pathways increasingly emphasize proactive screening, nutrition-first measures, and timely escalation to pharmacologic support when weight loss accelerates. Established cachexia management often relies on multi-modal approaches that pair symptom relief with metabolic stabilization. Refractory cachexia care is commonly more palliative, focusing on comfort and symptom control rather than reversal.
By Distribution Channel Insights
Hospital Pharmacies dominate channel dynamics because cancer cachexia therapies are frequently initiated in oncology clinics, infusion centers, and inpatient episodes where monitoring and regimen optimization are required. Complex patient profiles and polypharmacy make controlled dispensing and clinical oversight more important at the start of therapy. Retail pharmacies support continuation of therapy after stabilization, particularly for long-duration supportive-care regimens. Online pharmacies are gaining relevance for refill convenience and home delivery, especially for mobility-limited patients.
Cancer Cachexia Market Drivers
Rising Global Cancer Incidence And Treatment Intensity
Cancer incidence growth and greater use of multi-line therapies are increasing the number of patients exposed to prolonged catabolic stress, appetite loss, and muscle wasting. Oncology regimens that extend survival can also expand the time window during which cachexia emerges and requires intervention. Clinical teams increasingly manage cachexia as a therapy-continuity issue because weight loss can reduce tolerance and trigger dose reductions. Demand rises as supportive-care protocols formalize across hospitals and cancer centers.
Expansion Of Supportive Oncology Protocols And Early Screening
Supportive oncology pathways are strengthening across care settings, which is improving screening for weight loss, sarcopenia, and reduced intake during routine visits. Earlier detection increases the proportion of patients treated in pre-cachexia and established stages rather than only refractory stages. Structured screening also supports more consistent prescribing and follow-up, improving therapy persistence. Growing multidisciplinary care models that include nutritionists and palliative specialists are accelerating uptake of multimodal interventions.
- For instance, a real-world analysis of Carevive PROmPT across 12 US sites found that breast cancer patients reported 19,425 symptoms over a median of 12 weeks with 80% compliance, and 39% of those reports triggered alerts, demonstrating how structured digital monitoring can strengthen screening consistency and follow-up intensity.
Unmet Need For Effective Multimodal Therapies
Cancer cachexia remains an area with high unmet need because single-mechanism approaches often provide partial symptom improvement without fully restoring muscle function. Clinicians increasingly pursue combined strategies that address appetite, inflammation, and anabolism to improve functional outcomes. Treatment decisions are also influenced by the need to reduce fatigue and improve daily activity levels, which are critical to patient quality of life. This unmet need supports continued innovation and broader adoption of supportive therapies.
- For instance, Helsinn-supported ROMANA 1 and ROMANA 2 trials reported that anamorelin increased lean body mass by 0.99 kg versus -0.47 kg and 0.65 kg versus -0.98 kg over 12 weeks, yet showed no significant improvement in handgrip strength, reinforcing why broader multimodal strategies are still needed in cachexia care.
Shift Toward Outpatient Continuity And Home-Based Support
Cancer care is increasingly delivered in outpatient settings, which places greater importance on therapies that can be initiated clinically and continued at home with minimal complexity. This shift supports wider utilization of pharmacy channels that enable refill continuity and reduce treatment disruption. Digital engagement and improved care coordination are also helping patients remain adherent to supportive regimens. Demand increases as home-based supportive strategies become more common across long-duration oncology pathways.
Cancer Cachexia Market Challenges
Cancer cachexia management faces challenges linked to heterogeneous patient profiles and variable clinical presentation across cancer types and stages. Differentiating cachexia from treatment side effects and general malnutrition can delay standardized intervention and reduce consistency of treatment pathways. Outcomes measurement is also complex because weight gain alone may not capture functional improvement or lean-mass preservation. These factors can slow broad protocol adoption and limit uniform prescribing practices across care settings.
Access and reimbursement remain uneven across regions, particularly for advanced supportive-care therapies and newer mechanisms. Budget constraints can push providers toward symptom-only approaches even when multi-modal strategies are clinically preferred. Fragmented care coordination across oncology, nutrition, and palliative teams can reduce adherence and continuity. Limited availability of specialized supportive-care services in emerging markets further restricts timely initiation and follow-up.
- For instance, Artelo Biosciences' ART27.13 (a cannabinoid receptor agonist) demonstrated a 6.38% weight gain at its highest dose after 12 weeks in the Phase 2 CAReS study compared to a 5.42% average weight loss in the placebo arm yet despite this clinically meaningful signal, the therapy remains investigational with no approved reimbursement pathway in any major market, reflecting how budget-constrained payer systems continue to lag behind clinical evidence even when multi-modal or novel-mechanism strategies show measurable benefit.
Cancer Cachexia Market Trends and Opportunities
Multimodal care models are expanding as oncology centers integrate pharmacologic support with nutrition counseling and rehabilitation strategies. This trend creates opportunities for therapy combinations that target appetite, inflammation, and anabolism with better tolerability and clearer functional endpoints. Increasing use of screening tools and body composition tracking supports earlier intervention and better segmentation of patients by risk. Vendors that align evidence generation with real-world supportive-care workflows can accelerate adoption.
- For instance, Roche’s tailored digital patient monitoring modules on the Kaiku Health platform enrolled 153 patients, achieved 85% adoption, maintained 76% weekly symptom-report adherence in the first 6 weeks and 77% to 81% in later intervals, and reduced median review time for alerted reports to 19.6 hours, showing how evidence generation can be embedded into real-world supportive-care workflows.
Outpatient dispensing expansion is improving therapy continuity, enabling sustained treatment across long cancer journeys. Online pharmacy growth and home delivery models can increase refill adherence for supportive therapies, particularly among mobility-limited patients. Regional growth opportunities are emerging in Asia Pacific where oncology volumes and supportive-care penetration are rising across large hospital networks. Development programs focused on patient-reported outcomes and functional measures can also strengthen differentiation and payer acceptance.
Regional Insights
North America
North America led the Cancer Cachexia Market with 40.8% share in 2025, supported by strong supportive-care utilization across oncology centers and broader reimbursement coverage. High adoption of multidisciplinary cancer care increases screening rates and earlier initiation of supportive therapies. Established pharmacy infrastructure supports regimen continuity for complex oncology patients. Clinical trial activity and faster integration of novel supportive approaches also reinforce regional leadership.
Europe
Europe captured 23.1% share in 2025, supported by structured cancer care pathways and increasing integration of nutrition support into oncology protocols. Hospital-centered initiation remains common, with continuity supported by mature retail pharmacy networks. Public health systems encourage standardized supportive care practices across major markets. Demand is reinforced by aging demographics and high cancer prevalence in several countries.
Asia Pacific
Asia Pacific accounted for 23.5% share in 2025, driven by rising cancer caseloads, expanding tertiary care capacity, and improving access to supportive oncology services. Large population bases in key markets create scale for cachexia screening and supportive therapy utilization. Adoption is accelerating as major hospital networks expand oncology specialty services and supportive-care protocols. Pricing and access variability persist, but ongoing infrastructure expansion supports sustained growth momentum.
Latin America
Latin America represented 6.8% share in 2025, with demand concentrated in large urban oncology centers and private hospital systems. Supportive-care access continues to improve, but reimbursement constraints and uneven specialist availability can delay initiation. Retail pharmacies play an important role in continuation once therapy is established. Market growth is supported by expanding oncology volumes and improving cancer care capacity in leading countries.
Middle East & Africa
Middle East & Africa held 5.8% share in 2025, supported by growth in tertiary hospitals and oncology centers in select countries. Access remains uneven across sub-regions, with stronger uptake in higher-income markets and major metropolitan areas. Hospital pharmacies remain central due to monitoring needs and protocol-led initiation. Investments in oncology infrastructure and supportive care services are gradually expanding addressable demand.
Competitive Landscape
Competition in the Cancer Cachexia Market centers on mechanism differentiation, clinical evidence generation, and protocol fit within supportive oncology pathways. Companies pursue strategies that strengthen positioning across appetite stimulation, anti-inflammatory modulation, and anabolic support, with increasing emphasis on combination approaches aligned to staging and symptom clusters. Partnerships and licensing deals are used to extend geographic access and improve commercialization readiness. Differentiation is increasingly linked to tolerability profiles, ease of integration into oncology workflows, and evidence tied to functional outcomes.
Pfizer Inc. remains a highly visible participant due to scale, oncology footprint, and capabilities that support clinical development and commercialization across supportive-care adjacencies. Pfizer Inc. can leverage established relationships with oncology providers and health systems to support adoption where supportive-care interventions intersect with treatment continuity priorities. Commercial infrastructure and market access expertise can also support broader reach in regions with stronger reimbursement pathways. Strategic portfolio alignment in oncology enables continued participation in adjacent supportive-care opportunities.
The industry research and growth report includes detailed analyses of the competitive landscape of the market and information about key companies, including:
- Pfizer Inc.
- Helsinn Group
- Actimed Therapeutics
- Bristol-Myers Squibb
- Eli Lilly and Company
- Novartis AG
- AVEO Oncology
- Merck & Co., Inc.
- Aeterna Zentaris Inc.
- Endevica Bio
- AbbVie
- Artelo Biosciences
Qualitative and quantitative analysis of companies has been conducted to help clients understand the wider business environment as well as the strengths and weaknesses of key industry players. Data is qualitatively analyzed to categorize companies as pure play, category-focused, industry-focused, and diversified; it is quantitatively analyzed to categorize companies as dominant, leading, strong, tentative, and weak.
Recent Developments
- In November 2025, Actimed Therapeutics announced a licensing partnership with Mankind Pharma, granting Mankind exclusive rights to develop and commercialize Actimed’s products for the treatment and/or prevention of cachexia in India and other South Asian territories. In the same announcement, the companies said the deal includes Actimed’s S-pindolol benzoate program, ACM-001.1, which Actimed plans to take into Phase 2b/3 clinical development for cancer cachexia.
- In August 2025, Pfizer’s ponsegromab program entered a Phase 2/3 study in cancer cachexia, marking one of the most important recent product-development updates in the market. In September 2024, Pfizer had reported positive Phase 2 data showing body-weight improvement versus placebo, along with improvements in appetite and cachexia symptoms, physical activity, and skeletal muscle index, and said registration-enabling studies would begin in 2025.
- In April 2025, GenFleet initiated Phase 1 development of GFS202A, a pipeline therapy that includes patients with pre-cachexia, adding another recent competitive update in the cancer cachexia space.
- In May 2025, Helsinn’s product information page described Adlumiz (anamorelin) as the first and only product approved in Japan for cancer cachexia, underscoring Helsinn’s continued commercial presence in this market.
Report Scope
| Report Attribute | Details |
| Market size value in 2025 | USD 2,836 million |
| Revenue forecast in 2032 | USD 4,125.24 million |
| Growth rate (CAGR) | 5.5% (2025–2032) |
| Base year | 2025 |
| Forecast period | 2026-2032 |
| Quantitative units | USD million |
| Segments covered | By Therapeutic Class; By Mechanism of Action; By Cancer Type; By Stage of Cachexia; By Distribution Channel |
| Regional scope | North America, Europe, Asia Pacific, Latin America, Middle East & Africa |
| Key companies profiled | Pfizer Inc.; Helsinn Group; Actimed Therapeutics; Bristol-Myers Squibb; Eli Lilly and Company; Novartis AG; AVEO Oncology; Merck & Co., Inc.; Aeterna Zentaris Inc.; Endevica Bio; AbbVie; Artelo Biosciences |
| No.of Pages | 338 |
By Segmentation
By Therapeutic Class
- Ghrelin Receptor Agonists
- Selective Androgen Receptor Modulators (SARMs)
- Beta-blockers / ACTAs
- Progestogens
- Corticosteroids
- Combination Therapy
- Other Therapeutic Classes
By Mechanism Of Action
- Appetite Stimulators
- Anabolic Agents
- Catabolic-Pathway Inhibitors
- Anti-inflammatory / Immunomodulators
- Multi-target ACTAs
By Cancer Type
- Lung Cancer
- Gastro-intestinal Cancers
- Breast Cancer
- Prostate Cancer
- Hematologic Malignancies
- Other Cancer Types
By Stage of Cachexia
- Pre-cachexia
- Established Cachexia
- Refractory Cachexia
By Distribution Channel
- Hospital Pharmacies
- Retail Pharmacies
- Online Pharmacies
By Region
- North America
- U.S.
- Canada
- Mexico
- Europe
- Germany
- France
- U.K.
- Italy
- Spain
- Rest of Europe
- Asia Pacific
- China
- Japan
- India
- South Korea
- South-east Asia
- Rest of Asia Pacific
- Latin America
- Brazil
- Argentina
- Rest of Latin America
- Middle East & Africa
- GCC Countries
- South Africa
- Rest of the Middle East and Africa
Request a Free Sample
Fill in your details and we'll send you a free sample report.
- Sample data tables & charts
- Research methodology
Need a Custom Version of This Report?
Tailor the scope, geography, or segments to your exact requirements.
- Custom geography or segment scope
- Direct access to our analyst team
Frequently Asked Questions
What is the current and forecast market size for the Cancer Cachexia Market?
What is the expected CAGR for the Cancer Cachexia Market?
Which segment is the largest in the Cancer Cachexia Market?
What are the major growth factors shaping the market?
Who are the leading companies in the Cancer Cachexia Market?
Which region leads the Cancer Cachexia Market?
Table of Content
Chapter 1. Report Introduction
- 1.1 Report Description & Purpose
- 1.1.1 Report Title & Market Definition
- 1.1.2 Unique Selling Propositions (USP) & Key Differentiators
- 1.1.3 Value Proposition for Stakeholders
- 1.2 Research Objectives
- 1.2.1 Market Sizing Objectives (Volume & Revenue)
- 1.2.2 Segmentation Objectives
- 1.2.3 Competitive Intelligence Objectives
- 1.2.4 Forecast & Scenario Objectives
- 1.3 Report Scope
- 1.3.1 Cancer Cachexia Scope – Types & Subtypes Covered
- 1.3.2 Geographic Scope – Regions & Countries Covered
- 1.3.3 Historical Period, Base Year & Forecast Period (2025; forecast to 2032)
- 1.3.4 Inclusions & Exclusions
- 1.4 HS Code & Classification Framework
- 1.5 Currency, Units & Pricing Basis
- 1.6 Target Stakeholders
- 1.7 Limitations & Assumptions
Chapter 2. Executive Summary
- 2.1 Global Cancer Cachexia Market Snapshot
- 2.1.1 Market Size – Historical (2025) & Forecast (2025-2032) (2025: USD 2,836 million → 2032: USD 4,125.24 million)
- 2.1.2 Volume & Revenue – Global Totals
- 2.1.3 Key Market Highlights – Top Five Facts
- 2.2 Cancer Cachexia Market Segmentation Snapshot
- 2.2.1 Market Split by Region – 2025 vs. 2032
- 2.3 Competitive Snapshot
- 2.3.1 Top 10 Players by Revenue Share – 2025
- 2.3.2 Top 10 Players by Volume Share – 2025
- 2.3.3 Recent Strategic Developments (18-Month Summary)
- 2.4 Key Investment Highlights & Strategic Conclusions
Chapter 3. Cancer Cachexia Market Dynamics & Industry Analysis
- 3.1 Market Overview & Context
- 3.1.1 Cancer Cachexia Market Position in the Broader Automotive Value Chain
- 3.1.2 OEM vs. Replacement Market Dynamics
- 3.1.3 Market Maturity & Development Stage by Region
- 3.2 Cancer Cachexia Market Drivers
- 3.3 Cancer Cachexia Market Restraints & Challenges
- 3.4 Cancer Cachexia Market Opportunities
- 3.5 Porter's Five Forces Analysis
- 3.5.1 Threat of New Entrants
- 3.5.2 Bargaining Power of Suppliers
- 3.5.3 Bargaining Power of Buyers
- 3.5.4 Threat of Substitutes
- 3.5.5 Competitive Rivalry – Intensity Assessment
- 3.6 Cancer Cachexia Value Chain Analysis
- 3.6.1 Upstream – Raw Material/Input Suppliers
- 3.6.1.1 Raw Material/Input 1
- 3.6.1.2 Raw Material/Input 2
- 3.6.1.3 Raw Material/Input 3
- 3.6.2 Midstream – Production/Manufacturing/Service Delivery
- 3.6.2.1 Production/Process Overview
- 3.6.2.2 Key Facility Locations & Capacity by Manufacturer
- 3.6.3 Downstream – Distribution & End Consumer
- 3.6.3.1 Primary Channel – B2B/OEM
- 3.6.3.2 Secondary Channels – Dealer, Retail, Online, Direct
- 3.6.4 Value Chain Profitability Analysis
- 3.6.1 Upstream – Raw Material/Input Suppliers
- 3.7 PESTEL Analysis
- 3.7.1 Political Factors
- 3.7.2 Economic Factors
- 3.7.3 Social Factors
- 3.7.4 Technological Factors
- 3.7.5 Environmental Factors
- 3.7.6 Legal Factors
- 3.8 Cancer Cachexia Supply Chain Analysis
- 3.8.1 Raw Material/Input Supply Risk Assessment
- 3.8.2 Manufacturing Concentration Risk (Geographic Exposure)
- 3.8.3 Trade Disruption Impact Analysis
- 3.9 Regulatory & Policy Landscape
Note: The regulatory and policy landscape section covers regulations based on their applicability to the market, Cancer Cachexia category, geography, and scope of the study. Only regulatory frameworks with a material impact on operations, compliance, trade, sustainability, or market access are analyzed in detail.
Chapter 4. Key Investment Pockets & Opportunity Analysis
- 4.1 Cancer Cachexia Market Attractiveness Analysis
- 4.1.1 By Region – Investment Attractiveness Matrix (Volume × CAGR)
- 4.2 Absolute Revenue Growth Opportunity
- 4.2.1 By Region – Absolute USD Growth Through 2032
- 4.3 Incremental Volume Opportunity
- 4.3.1 By Region – Incremental Volume Through 2032
- 4.3.2 Segment – Incremental Volume
- 4.4 Emerging Submarket Opportunity Deep Dive (Subject to Applicability)
- 4.5 Emerging Market Opportunity Scorecards
- 4.5.1 United States
- 4.5.2 Europe
- 4.5.3 Asia
- 4.5.4 Middle East & Africa
Note: Emerging Market Opportunity Scorecards will be included based on relevance and strategic importance. Regions listed are indicative and may vary depending on data availability and market dynamics.
Chapter 5. Cancer Cachexia Import-Export Analysis & Trade Flows
- 5.1 Global Trade Overview
- 5.1.1 Global Export Value by Country (2025)
- 5.1.2 Global Export Volume by Country (2025)
- 5.1.3 Global Import Value by Country (2025)
- 5.1.4 Global Import Volume by Country (2025)
- 5.1.5 Net Trade Balance by Country (2025)
- 5.2 Export Analysis – Segment
- 5.2.1 Type 1 (HS Code)
- 5.2.2 Type 2 (HS Code)
- 5.2.3 Type 3 (HS Code)
- 5.2.4 Type 4 (HS Code)
- 5.2.5 Type 5 (HS Code)
- 5.3 Import Analysis – Segment
- 5.3.1 Type 1 (HS Code)
- 5.3.2 Type 2 (HS Code)
- 5.3.3 Type 3 (HS Code)
- 5.3.4 Type 4 (HS Code)
- 5.3.5 Type 5 (HS Code)
- 5.4 Average Unit Trade Prices
- 5.4.1 Average Export Price – Segment & Country
- 5.4.2 Average Import Price – Segment & Source Country
- 5.4.3 Price Trends (2025)
- 5.5 Key Trade Route Analysis
- 5.5.1 Trade Route 1
- 5.5.2 Trade Route 2
- 5.5.3 Trade Route 3
- 5.5.4 Trade Route 4
- 5.5.5 Trade Route 5
- 5.6 Trade Policy Impact Assessment
- 5.6.1 US Anti-Dumping & Section 301 Tariffs
- 5.6.2 EU Customs Union Impact
- 5.6.3 Major Free Trade Agreements
- 5.6.4 USMCA Rules of Origin
Note: Trade policy analysis will be included only where relevant to the Cancer Cachexia market.
Chapter 6. Competitive Landscape & Company Benchmarking
- 6.1 Cancer Cachexia Market Concentration & Structure
- 6.1.1 Herfindahl-Hirschman Index (HHI) – vs. 2025
- 6.1.2 Tier 1, Tier 2 & Tier 3 Market Structure
- 6.1.3 Global, Regional & Local Player Dynamics
- 6.2 Cancer Cachexia Market Share Analysis – 2025
- 6.2.1 Global Revenue Share by Company
- 6.2.2 Global Volume Share by Company
- 6.2.3 Regional Revenue Share
- 6.2.4 Market Share Evolution ( vs. 2025)
- 6.2.5 OEM Segment Share by Company
- 6.2.6 Replacement Segment Share by Company
- 6.3 Production/Delivery Capacity & Facility Analysis
- 6.3.1 Global Installed Capacity
- 6.3.2 Capacity Utilization Rates
- 6.3.3 Production/Output Volume
- 6.3.4 Facility Locations & Capacity Map
- 6.3.5 Planned Capacity Additions
- 6.4 Cancer Cachexia Competitive Benchmarking Matrix
- 6.4.1 Revenue, Volume, CAGR & Profitability Comparison
- 6.4.2 Channel Revenue Mix
- 6.4.3 Geographic Revenue Exposure
- 6.4.4 R&D Intensity
- 6.4.5 Sustainability Maturity
- 6.5 Strategic Developments in Cancer Cachexia (Last 24 Months)
- 6.5.1 Mergers, Acquisitions & Divestments
- 6.5.2 New Cancer Cachexia Launches
- 6.5.3 Facility Expansions
- 6.5.4 Strategic Alliances, Joint Ventures & Partnerships
- 6.5.5 Distribution Expansion & Market Entry
- 6.5.6 Sustainability & ESG Initiatives
- 6.6 Competitive Strategy Mapping
- 6.6.1 Leader, Challenger, Follower & Niche Classification
- 6.6.2 Pricing Strategy Comparison
- 6.6.3 Channel Strategy Matrix
Note: Strategic developments are included based on their materiality and the availability of reliable information.
Chapter 7. Global Cancer Cachexia Market – By Distribution Channel
- 7.1 Segment Overview
- 7.1.1 Volume & Revenue Split by Channel (2025 & 2032)
- 7.1.2 Channel Mix Evolution (2025-2032)
Chapter 8. Regional Market Analysis – Global Overview
- 8.1 Global Regional Overview
- 8.1.1 Regional Volume Share
- 8.1.2 Regional Revenue Share
- 8.1.3 Regional Volume by Region
- 8.1.4 Regional Revenue by Region
- 8.1.5 Regional Forecast Through 2032
- 8.2 Cross-Regional Segment Analysis
- 8.2.1 By Distribution Channel
- 8.2.2 By Brand/Price Tier
Chapter 9. North America Cancer Cachexia Market
- 9.1 United States
- 9.2 Canada
- 9.3 Mexico
Chapter 10. Europe Cancer Cachexia Market
- 10.1 Germany
- 10.2 France
- 10.3 Italy
- 10.4 United Kingdom
- 10.5 Spain
- 10.6 Poland
- 10.7 Russia
- 10.8 Netherlands
- 10.9 Belgium
- 10.10 Sweden
- 10.11 Denmark
- 10.12 Norway
- 10.13 Rest of Europe
Chapter 11. Asia Pacific Cancer Cachexia Market
- 11.1 China
- 11.2 India
- 11.3 Japan
- 11.4 South Korea
- 11.5 Thailand
- 11.6 Indonesia
- 11.7 Vietnam
- 11.8 Malaysia
- 11.9 Australia
- 11.10 Rest of Asia Pacific
Chapter 12. Latin America Cancer Cachexia Market
- 12.1 Brazil
- 12.2 Argentina
- 12.3 Colombia
- 12.4 Chile
- 12.5 Rest of Latin America
Chapter 13. Middle East Cancer Cachexia Market
- 13.1 Saudi Arabia
- 13.2 United Arab Emirates
- 13.3 Turkey
- 13.4 Israel
- 13.5 Iran
- 13.6 Rest of the Middle East
Chapter 14. Africa Cancer Cachexia Market
- 14.1 South Africa
- 14.2 Egypt
- 14.3 Nigeria
- 14.4 Morocco
- 14.5 Rest of Africa
Chapter 15. Cancer Cachexia Company Profiles
- 15.1 [Company 01]
- 15.1.1 Company Overview
- 15.1.2 Key Management Personnel
- 15.1.3 Products & Services Portfolio
- 15.1.4 Financial Performance
- 15.1.5 Key Market Focus & Geographic Presence
- 15.1.6 Recent Developments & Strategic Initiatives
Note: The company profile list is preliminary and may change based on research findings, market developments, data availability, and client requirements.
Chapter 16. Appendices
- Appendix A – List of Abbreviations & Acronyms
- Appendix B – Industry Classification Code Reference – Full Series
- Appendix C – Production & Capacity Data Tables
- Appendix D – End-Use & Demand Base Tables
- Appendix E – Consumption & Replacement Rate Assumptions
- Appendix F – ASP Reference Tables
- Appendix G – Manufacturing & Facility Database
- Appendix H – Import-Export Data Tables
- Appendix I – Regulatory Summary Tables
- Appendix J – Primary Research Participant List (Anonymized)
- Appendix K – Primary Research Questionnaire Framework
- Appendix L – Data Sources & Bibliography
- Appendix M – Market Size Divergence & Source Comparison
Chapter 17. Research Methodology
- 17.1 Research Framework & Philosophy
- 17.2 Secondary Research – Sources, Hierarchy & Data Extraction
- 17.3 Data Modeling – Bottom-Up & Top-Down Market Sizing
- 17.4 Primary Research – Stakeholder Framework, LOI & Sample Sizes
- 17.5 Forecast Methodology – Regression, Scenario & Sensitivity Analysis
- 17.6 Quality Control – Four-Layer Validation Framework
- 17.7 Limitations & Standard Assumptions
- 17.8 Disclaimer
