| REPORT ATTRIBUTE |
DETAILS |
| Historical Period |
2020-2023 |
| Base Year |
2024 |
| Forecast Period |
2025-2032 |
| Chemical Accelerators Market Size 2024 |
USD 4,530.0 Million |
| Chemical Accelerators Market, CAGR |
6.40% |
| Chemical Accelerators Market Size 2032 |
USD 7,441.0 Million |
Market Overview
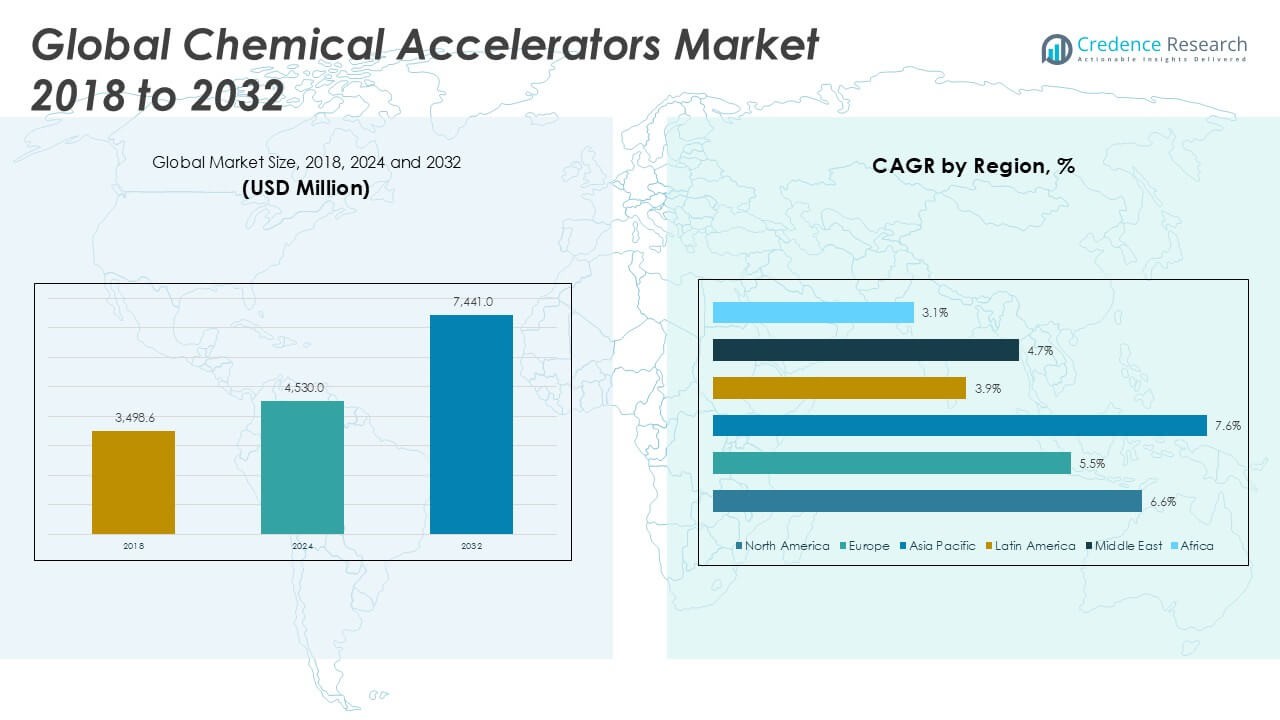
The Global Chemical Accelerators Market is projected to grow from USD 4,530.0 million in 2024 to an estimated USD 7,441.0 million by 2032, with a compound annual growth rate (CAGR) of 6.40% from 2025 to 2032.
Market growth is driven by stringent performance requirements for high-strength adhesives and advanced coatings, which in turn spur innovation in specialty amine and phosphonium-based accelerators. A trend toward bio-based and low-emission products is reshaping formulations, as regulatory bodies tighten VOC limits and environmental standards. At the same time, digitalization of production processes—through in-line monitoring and AI-driven quality control—is improving yield and consistency, encouraging end-users to adopt next-generation accelerator solutions.
Regionally, Asia Pacific dominates demand, accounting for over 40% of global consumption, fueled by large-scale infrastructure projects in China and India and a booming automotive aftermarket in Southeast Asia. North America and Europe exhibit steady growth, driven by renovation activities and the shift to eco-friendly construction materials. Key players leading the competitive landscape include BASF SE, Evonik Industries AG, The Dow Chemical Company, LANXESS AG, and AkzoNobel N.V., all of which maintain extensive production capacities and global distribution networks to address regional requirements and sustainability goals.
Access crucial information at unmatched prices!
Request your sample report today & start making informed decisions powered by Credence Research Inc.!
Download Sample
Market Insights
- The market stood at USD 4,530.0 million in 2024 and will reach USD 7,441.0 million by 2032, growing at a 6.40% CAGR.
- Strong demand in CASE applications drives uptake of rapid-curing adhesives and coatings.
- Urbanization and infrastructure projects in emerging economies boost accelerator consumption.
- Volatile petrochemical feedstock prices and supply disruptions increase production costs.
- Asia Pacific commands over 40% share, led by China’s and India’s construction and automotive sectors.
- North America holds about 24.7% share, backed by aerospace, automotive, and medical applications.
- Europe accounts for roughly 22.7% share, where strict VOC regulations accelerate low-emission formulations.
Market Drivers
Rising Demand in Adhesives, Coatings, Sealants, and Elastomers Segments
The Global Chemical Accelerators Market benefits from robust uptake in CASE applications across automotive, construction, and electronics industries. Manufacturers report higher orders for specialty amine and phosphonium accelerators that shorten cure times and boost bond strength. End-users value rapid processing to maintain tight production schedules and minimize energy consumption. It supports formulators seeking consistency in high-performance coatings under extreme conditions. Strong growth in aftermarket repair and maintenance further sustains demand. Suppliers expand capacity to meet volume requirements without compromising quality.
- For instance, BASF expanded its production capacity for specialty amines at its Geismar, Louisiana site in 2023, increasing output to support growing demand from over 1,000 customers in North America, Europe, and Asia for use in adhesives, coatings, and sealants applications
Expanding Infrastructure Projects Driving Product Requirements
Large-scale infrastructure initiatives in Asia Pacific and Latin America propel accelerator consumption. Governments allocate substantial budgets to roads, bridges, and residential complexes that rely on fast-curing adhesives and sealants. Contractors choose advanced accelerators to accelerate project timelines and reduce labor costs. It offers high thermal stability and resistance to moisture, which proves vital in diverse climates. Private investment in industrial facilities also adds to volume requirements. Regional developers prioritize solutions that withstand heavy traffic and environmental stress.
- For instance, according to the Inter-American Development Bank, over 6,800,000,000 USD was invested in Latin American infrastructure between 2021 and 2023, with thousands of kilometers of new roads and hundreds of bridges using advanced adhesives and sealants to meet project requirements
Regulatory Pressure Encouraging Eco-Friendly Formulations
Stricter VOC limits and environmental standards push formulators toward low-emission accelerator chemistries. Companies innovate bio-based alternatives that comply with REACH and EPA regulations without sacrificing performance. It aligns with corporate sustainability targets and green building certifications. End-users reward suppliers that demonstrate transparent supply chains and third-party validation. Transition toward water-borne systems further elevates demand for compatible accelerators. Collaborative research partnerships strengthen compliance and drive market credibility.
Innovation and Automation Enhancing Production Efficiency
Industry 4.0 principles reshape accelerator manufacturing through in-line monitoring and AI-driven quality control. It yields tighter process control, reduces waste, and shortens lead times. Automated dispensing systems deliver precise dosing that boosts batch consistency. Ongoing R\&D introduces tailored formulations for niche applications such as high-temperature composites. Strategic alliances between chemical producers and equipment vendors accelerate technology transfer. Enhanced digital traceability reassures customers about product origin and performance.
Market Trends
Integration of Digital Process Controls and Quality Monitoring
Manufacturers leverage advanced sensors and AI algorithms to optimize reactor conditions and ensure consistent output. It reduces batch variation and cuts downtime on production lines. Real-time data capture and cloud-based analytics improve decision-making and resource allocation. The Global Chemical Accelerators Market witnesses faster adoption of automated dosing systems that maintain precise catalyst-to-polymer ratios. Plants upgrade legacy equipment to gain predictive maintenance and yield higher throughput. Digital twins help engineers simulate process changes prior to implementation.
- For instance, BASF reported in 2023 that its adoption of AI-driven process controls at a polymer plant led to the monitoring of 2,000 reactor parameters daily, enabling a reduction in unplanned downtime by 150 hours per year compared to previous manual monitoring methods.
Shift Toward Bio-based and Low-emission Chemical Solutions
Rising sustainability goals prompt formulators to adopt plant-derived amines and phosphonium catalysts. New regulations tighten VOC limits and demand transparent supply chains. It encourages producers to phase out heavy-metal chelates and replace them with eco-friendly alternatives. The Global Chemical Accelerators Market records increased demand for waterborne systems that comply with EU REACH and U.S. EPA guidelines. R\&D teams partner with universities to test novel feedstocks and evaluate performance. Customer preference shifts toward suppliers that document carbon footprints.
- For instance, according to a 2022 U.S. Environmental Protection Agency (EPA) report, 15 chemical manufacturers replaced 40,000 tons of traditional accelerators with bio-based alternatives in compliance with new regulations, leading to a documented reduction in hazardous emissions across production facilities.
Customization for Niche Applications and Specialty Formulations
Companies design tailored accelerator blends for high-temperature composites, UV-curable coatings, and biomedical adhesives. It supports brand owners who require unique cure profiles and mechanical properties. The Global Chemical Accelerators Market shows rising orders for low-viscosity systems that meet fast-curing demands. Technical service teams work closely with clients to adjust formulations on-site and solve process challenges. Innovation centers allow rapid prototyping of specialty products under controlled conditions. Flexible development pipelines keep product cycles short and response times swift.
Strengthening Supply Chains Through Localization and Partnerships
Producers expand regional manufacturing to reduce lead times and lower logistics expenses. It enhances resilience against raw-material shortages and trade disruptions. The Global Chemical Accelerators Market benefits from joint ventures that secure feedstock and streamline distribution. Suppliers form alliances with equipment manufacturers to integrate turnkey dosing units. Investors fund new plants near key end markets in Asia and Latin America. Integrated networks of local distributors ensure timely delivery and technical support.
Market Challenges
Volatility in Raw Material Pricing and Supply Constraints
The Global Chemical Accelerators Market faces volatility in raw material pricing and feedstock supply constraints. It depends heavily on petrochemical derivatives that shift with crude oil rates. Producers encounter sudden cost spikes that erode profit margins. Limited availability of specialty amines and phosphonium compounds can delay production schedules. Companies secure long-term contracts to maintain steady inventory and stabilize costs. Tight coordination with suppliers remains critical to prevent unexpected halts.
- For instance, a 2022 survey by the American Chemistry Council found that nearly all U.S. chemical manufacturers reported shipping delays and raw material shortages, with more than a third of companies incurring additional costs above $20 million due to persistent supply chain disruptions and transportation constraints
Pressure from Regulatory Standards and Competitive Alternatives
The Global Chemical Accelerators Market must comply with strict environmental and safety regulations that raise compliance expenses for producers. It requires frequent updates to product formulations and extensive testing procedures. Certification under REACH and EPA demands significant investment in lab work and documentation. Competing low-emission alternatives exert pressure on market share and pricing. Lack of compatibility with novel curing systems can hinder uptake in certain segments. Companies balance innovation cost and regulatory demands to sustain competitiveness.
Market Opportunities
Growing Adoption in Emerging Infrastructure and Vehicle Manufacturing Projects
The Global Chemical Accelerators Market can leverage increased investment in smart cities and electric vehicle production. It supports fast-curing formulations that reduce downtime and increase throughput on assembly lines. Urban planners specify high-performance sealants and coatings to improve building durability. Manufacturers offer tailored accelerator packages to meet tight specification windows. Strategic focus on emerging regions in Southeast Asia and Africa boosts volume potential. Collaboration with engineering firms secures long-term application contracts. Suppliers diversify product grades to capture niche requirements.
Integration of Sustainable and High-Performance Formulation Innovations
Rising environmental mandates open doors for bio-based accelerator chemistries that meet zero-VOC targets. It underpins development of waterborne systems that maintain cure speed and strength. Research teams test novel feedstocks to lower carbon intensity and enhance supply chain transparency. Patent filings for specialty phosphonium catalysts highlight growth areas. Partnerships between chemical companies and universities accelerate proof-of-concept trials. Regional production hubs can reduce logistics costs and improve market responsiveness. Targeted marketing toward green construction and renewable energy segments boosts adoption.
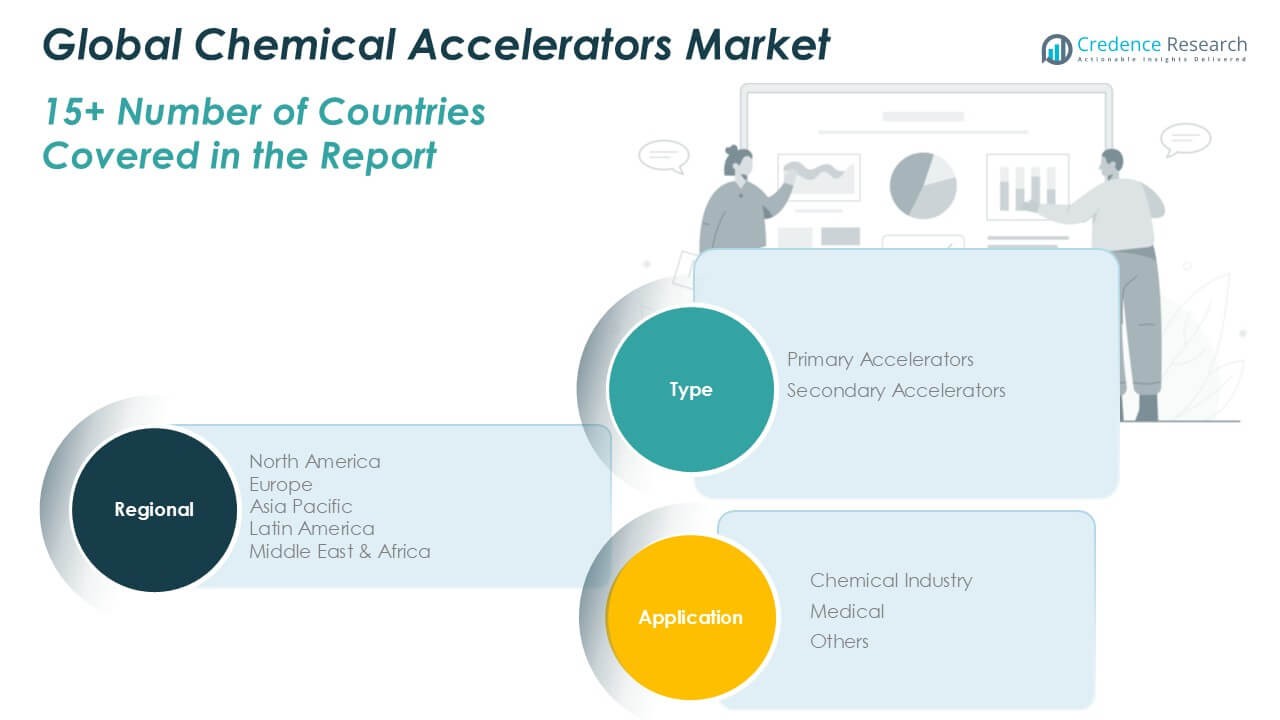
Market Segmentation Analysis
By Type
The Global Chemical Accelerators Market divides into primary and secondary accelerators that drive volume and revenue shares. Primary accelerators deliver rapid cure profiles and dominate over 60% of volume share due to widespread use in CASE applications. Secondary accelerators support extended working times and contribute to nearly 45% of revenue share, reflecting higher prices for specialty formulations. It maintains consistent demand in high-temperature and moisture-resistant systems. Manufacturers adjust blend ratios to optimize performance and cost across diverse end-use sectors. Ongoing investments in R\&D refine molecular structures to improve shelf life and reduce dosage levels.
- For instance, according to a 2024 report by Lanxess, one of the leading manufacturers, the company produced over 50,000 metric tons of primary accelerators for global industrial use in the previous year, highlighting the extensive adoption of these products in CASE applications.
By Application
Applications span the dietary supplement, food and beverages, chemical, medical, and other industries, each influencing market dynamics. Dietary supplement producers employ accelerators to stabilize encapsulation processes, representing close to 15% of volume consumption. Food and beverages firms use them for rapid curing of packaging adhesives, accounting for roughly 20% of revenue. The chemical industry leads adoption with over 35% volume share, driven by large-scale sealant and coating requirements. Medical device manufacturers leverage biocompatible accelerators in surgical adhesives, capturing near 10% of global sales. It supports niche sectors such as electronics and renewable energy through tailored formulations. Continuous collaboration between suppliers and end-users ensures segment-specific innovation and dependable supply.
- For instance, a 2023 industry survey by the European Chemical Industry Council (Cefic) reported that chemical accelerators were used in the production of more than 1,200,000 metric tons of sealants and coatings across Europe, underscoring their critical role in the chemical sector.
Segments
Based on Type
- Primary Accelerators
- Secondary Accelerators
Based on Application
- Dietary Supplement Industry
- Food and Beverages Industry
- Chemical Industry
- Medical
- Others
Based on Region
- North America
- Europe
- UK
- France
- Germany
- Italy
- Spain
- Russia
- Belgium
- Netherlands
- Austria
- Sweden
- Poland
- Denmark
- Switzerland
- Rest of Europe
- Asia Pacific
- China
- Japan
- South Korea
- India
- Australia
- Thailand
- Indonesia
- Vietnam
- Malaysia
- Philippines
- Taiwan
- Rest of Asia Pacific
- Latin America
- Brazil
- Argentina
- Peru
- Chile
- Colombia
- Rest of Latin America
- Middle East
- UAE
- KSA
- Israel
- Turkey
- Iran
- Rest of Middle East
- Africa
- Egypt
- Nigeria
- Algeria
- Morocco
- Rest of Africa
Regional Analysis
North America Chemical Accelerators Market
The North America Chemical Accelerators Market reached USD 1,118.9 million in 2024 and is projected to grow to USD 1,756.1 million by 2032, registering a CAGR of 6.6%. It holds approximately 24.7% of the global market share. Strong demand across automotive, aerospace, and medical industries drives regional consumption. The United States leads with high adoption of fast-curing adhesives and coatings, supported by stringent performance standards. Suppliers invest in R\&D and facility upgrades to meet local regulatory requirements. Mexico and Canada contribute steadily, backed by industrial expansion and infrastructure programs.
Europe Chemical Accelerators Market
Europe’s Chemical Accelerators Market was valued at USD 1,028.3 million in 2024 and is expected to reach USD 1,584.9 million by 2032, reflecting a CAGR of 5.5%. It represents around 22.7% of the global share. Demand centers around Germany, France, and Italy, where automotive and specialty chemicals sectors emphasize sustainable formulations. The market aligns with EU environmental policies, pushing adoption of low-emission and bio-based accelerators. Leading producers expand capacity and strengthen partnerships with OEMs. Industry participants target certifications and green labeling to boost product acceptance.
Asia Pacific Chemical Accelerators Market
Asia Pacific dominates the Chemical Accelerators Market with a 39.6% share, generating USD 1,793.9 million in 2024 and projected to hit USD 3,147.5 million by 2032, growing at a CAGR of 7.6%. China, India, and Japan anchor regional demand through aggressive infrastructure expansion, electronics manufacturing, and vehicle production. It benefits from cost-effective production, skilled labor, and rising urbanization. Regional players scale up capacity while multinationals strengthen their footprint. Public and private investment in construction projects supports steady growth.
Latin America Chemical Accelerators Market
The Latin America Chemical Accelerators Market stood at USD 185.7 million in 2024 and will likely reach USD 342.3 million by 2032, growing at a CAGR of 3.9%. It captures 4.1% of global market share. Brazil and Mexico drive regional demand, especially in adhesives used in consumer goods and packaging. Industrialization programs and foreign investment create steady growth prospects. It remains price-sensitive, prompting interest in cost-efficient accelerator solutions. Market players focus on local partnerships and product localization strategies.
Middle East Chemical Accelerators Market
The Middle East Chemical Accelerators Market generated USD 240.1 million in 2024 and is projected to reach USD 416.7 million by 2032, at a CAGR of 4.7%. Holding 5.3% of global market share, the region shows demand across infrastructure, construction chemicals, and oilfield adhesives. The UAE and Saudi Arabia lead through large-scale development projects. Suppliers target high-performance systems for harsh environmental conditions. It emphasizes durability and rapid application to support fast-track construction goals. Import dependency remains high, encouraging regional production initiatives.
Africa Chemical Accelerators Market
Africa’s Chemical Accelerators Market recorded USD 163.1 million in 2024 and is forecasted to grow to USD 193.5 million by 2032, reflecting a CAGR of 3.1%. It accounts for 3.6% of global market share. South Africa leads in consumption due to mining and manufacturing sectors. The market remains fragmented with uneven industrial development across countries. Local demand grows for construction adhesives and low-cost curing systems. It relies heavily on imports, though governments encourage local processing. Education and training initiatives support technical awareness and adoption.
Key players
- Lanxess AG
- Eastman Chemical Company
- Arkema S.A.
- Akzo Nobel N.V.
- Nouryon
- BASF SE
- Shandong Yanggu Huatai Chemical Co., Ltd.
- Kemai Chemical Co., Ltd.
- Zhengzhou Double Vigour Chemical Product Co., Ltd.
- Sunsine Chemical
- Jiangsu Sinorgchem Technology Co., Ltd.
- KUMHO PETROCHEMICAL
- Sumitomo Chemical Co., Ltd.
- MLPC International
Competitive Analysis
In the Global Chemical Accelerators Market, leading producers compete on performance, sustainability, and cost efficiency. It emphasizes cure speed, emissions reduction, and consistent quality. Lanxess AG and BASF SE leverage global networks to supply high-volume orders. Eastman Chemical Company and Arkema S.A. differentiate through specialty formulations and technical support. Akzo Nobel N.V. and Nouryon invest in bio-based chemistries to meet strict environmental standards. Regional players such as Shandong Yanggu Huatai Chemical and Zhengzhou Double Vigour focus on cost advantages and local service. Strategic alliances and acquisitions strengthen portfolios and expand geographic reach. Large-scale producers maintain price leadership, while niche innovators address specific process challenges. Research partnerships drive new product introductions and process improvements. Producers integrate automated quality controls to lower waste and ensure consistency. Digital platforms facilitate real-time monitoring and strengthen supply chain visibility. Industry veterans benchmark performance metrics to refine future accelerator developments.
Recent Developments
- In May 2025, Lanxess announced a significant increase in earnings for fiscal year 2024, with EBITDA pre-exceptionals climbing by 19.9% to €614 million, driven by higher capacity utilization and cost savings from the “FORWARD!” action plan.
- In February 2025, Arkema reported its full-year 2024 results, with sales remaining stable at €9.5 billion compared to 2023. EBITDA saw a slight increase to €1,532 million, and the EBITDA margin improved to 16.1%.
- In February 2025, AkzoNobel reported a strong Q1 2025, with adjusted EBITDA of €357 million and an adjusted EBITDA margin of 13.7%, driven by cost reduction and pricing strategies.
- In May 2025, Nouryon released its 2024 Sustainability Report, showcasing progress in sustainable solutions and environmental performance. The report highlighted a 19% reduction in total absolute Scope 1 and 2 greenhouse gas (GHG) emissions between 2019 and 2024. Additionally, 35% of Nouryon’s full-year 2024 revenue was derived from its portfolio of Eco-Premium Solutions, according to the report.
Market Concentration and Characteristics
The Global Chemical Accelerators Market exhibits moderate concentration, with the top five firms controlling over half of industry revenue. It features high entry barriers due to strict regulatory requirements and significant capital investment in specialized production facilities. Leading players leverage economies of scale to offer competitive pricing and extensive distribution networks. Mid-sized companies differentiate through niche formulations and regional service excellence. Product portfolios range from rapid-cure amines to eco-friendly phosphonium accelerators, reflecting diverse application needs. It demands rigorous quality control and compliance with global safety standards, which favors established manufacturers. Ongoing consolidation through joint ventures and acquisitions strengthens market positions and enhances technological capabilities.
Shape Your Report to Specific Countries or Regions & Enjoy 30% Off!
Report Coverage
The research report offers an in-depth analysis based on Type, Application and Region. It details leading market players, providing an overview of their business, product offerings, investments, revenue streams, and key applications. Additionally, the report includes insights into the competitive environment, SWOT analysis, current market trends, as well as the primary drivers and constraints. Furthermore, it discusses various factors that have driven market expansion in recent years. The report also explores market dynamics, regulatory scenarios, and technological advancements that are shaping the industry. It assesses the impact of external factors and global economic changes on market growth. Lastly, it provides strategic recommendations for new entrants and established companies to navigate the complexities of the market.
Future Outlook
- Companies will increase investment in bio-based accelerators that meet zero-VOC targets and reduce carbon footprints. It will drive partnerships with sustainable feedstock suppliers and broaden eco-friendly product portfolios.
- Manufacturers will integrate AI-driven process controls to optimize reaction conditions and enhance batch consistency. It will enable predictive maintenance and lower waste by halting deviations before they escalate.
- Expansion into Southeast Asia and Africa will capture growth from infrastructure development and rising industrialization. It will leverage local production hubs to shorten lead times and respond to regional specifications.
- Formulators will offer customized accelerator blends for advanced composites, UV-curable coatings, and medical adhesives. It will support brand owners’ demand for precise cure profiles and tailored mechanical properties.
- Strategic alliances with universities and research centers will accelerate proof-of-concept trials for novel chemistries. It will shorten innovation cycles and de-risk scale-up of next-generation accelerator technologies.
- Regulatory pressure will drive continuous reformulation toward low-emission and heavy-metal-free alternatives. It will reinforce compliance with REACH, EPA, and other global standards while safeguarding performance metrics.
- Supply chain digitization will improve raw-material traceability and reduce vulnerability to feedstock disruptions. It will strengthen inventory planning through real-time analytics and smarter procurement strategies.
- Consolidation through mergers and acquisitions will reshape market dynamics and enhance technological capabilities. It will enable leading players to integrate complementary portfolios and extend geographic reach.
- Circular-economy principles will gain traction, with increased recycling of catalysts and reuse of spent accelerators. It will lower production costs and align with corporate sustainability targets.
- Rapid on-site testing and inline analytical tools will streamline quality assurance and speed product qualification. It will empower end-users to validate performance instantly and reduce production bottlenecks.


