
Market Overview:
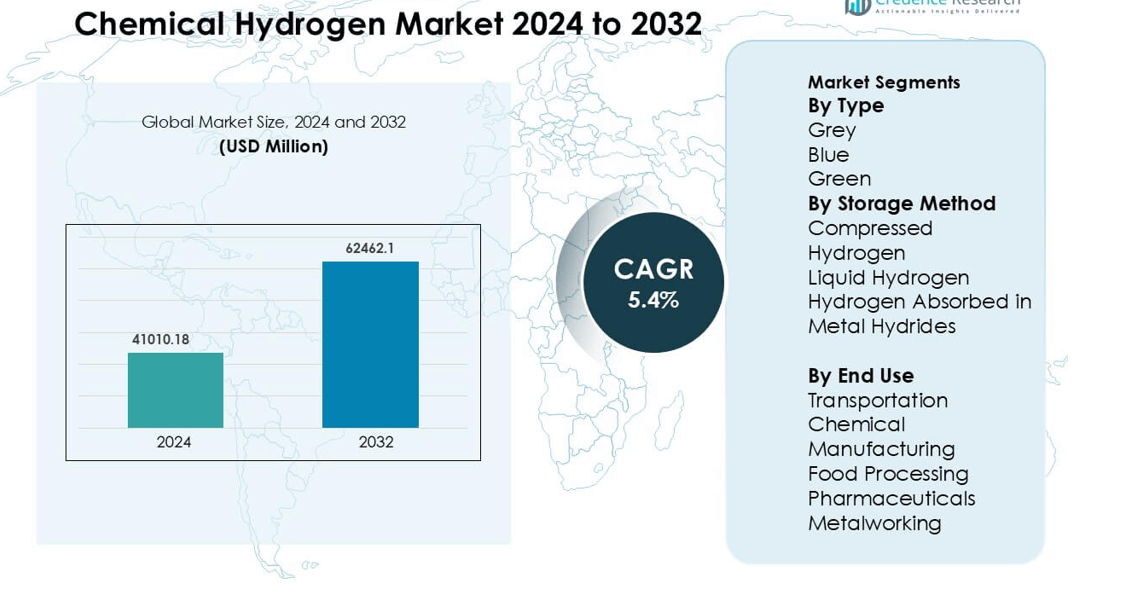
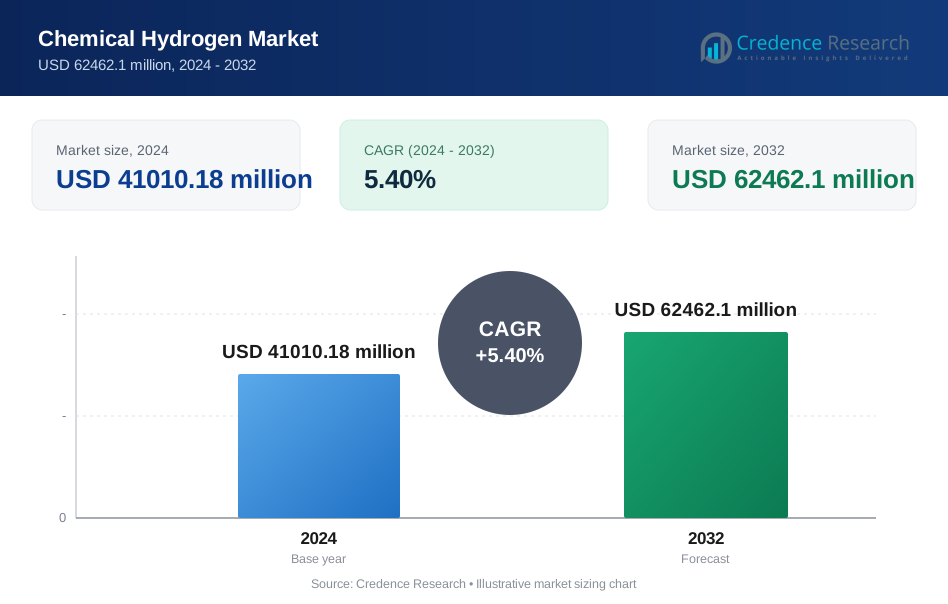
Chemical Hydrogen Market was valued at USD 41010.18 million in 2024 and is anticipated to reach USD 62462.1 million by 2032, growing at a CAGR of 5.4% during the forecast period.
| REPORT ATTRIBUTE | DETAILS |
|---|---|
| Historical Period | 2020-2023 |
| Base Year | 2024 |
| Forecast Period | 2025-2032 |
| Chemical Hydrogen Market Size 2024 | USD 41010.18 million |
| Chemical Hydrogen Market, CAGR | 5.4% |
| Chemical Hydrogen Market Size 2032 | USD 62462.1 million |
The chemical hydrogen market includes major industrial gas suppliers, clean-energy developers, and engineering specialists such as Air Products and Chemicals, Inc., Air Liquide, Linde plc, Technip Energies N.V., RESONAC HOLDINGS CORPORATION, Reliance Industries Limited, Plug Power Inc., Cummins Inc., Adani Green Energy, and Messer. These companies invest in large reforming units, electrolyzers, carbon-capture systems, and pipeline infrastructure to serve refineries, fertilizer plants, and chemical producers. They expand long-term gas supply contracts and develop low-carbon hydrogen hubs supported by government incentives. North America leads the market with a 35% share, driven by refinery clusters, decarbonization mandates, and strong fuel-cell mobility programs.
Market Insights
- The chemical hydrogen market was valued at USD 41010.18 million in 2024 and is expected to reach USD 62462.1 million by 2032 at a 5.4% CAGR, with grey hydrogen holding a 62% segment share due to its established production base.
- Demand rises as refinery expansions, ammonia production, and low-sulfur fuel norms increase large-scale consumption in hydrotreating and fertilizer industries.
- Blue and green hydrogen gain traction as companies adopt carbon capture, electrolyzers, and renewable integration to meet decarbonization goals.
- Global players such as Air Liquide, Linde plc, Technip Energies N.V., Reliance Industries Limited, and Air Products and Chemicals, Inc. expand reforming capacity, pipeline networks, and onsite gas supply agreements.
- North America leads with a 35% share, followed by Europe at 30% and Asia-Pacific at 25%, while compressed hydrogen remains the dominant storage method with a 55% market share across refineries and industrial gas distributors.
Market Segmentation Analysis:
By Type
Grey hydrogen holds the dominant share at 62% due to its established production from natural gas and coal using steam methane reforming. Low production cost and mature infrastructure allow refineries, ammonia plants, and power producers to maintain stable output at scale. Blue hydrogen is expanding as carbon capture systems reduce emissions in chemical and energy clusters. Green hydrogen remains smaller but gains momentum with falling electrolyzer costs and renewable installations. Government subsidies and green fuel mandates support long-term transition toward cleaner pathways, especially in transportation and industrial gas networks.
- For instance, the Air Products Louisiana complex will sequester more than 5 million metric tons of CO₂ per year while producing its hydrogen stream via hydrocarbon-feed reforming with capture infrastructure.
By Storage Method
Compressed hydrogen leads the segment with a 55% market share because storage in high-pressure cylinders and tube trailers offers flexible transport and low handling cost. Industries prefer movable cylinders for onsite refilling in chemical units, metal fabrication, and fuel stations. Liquid hydrogen grows in aerospace and mobility applications that need higher energy density and long-distance transport. Metal hydride storage finds niche use in laboratories and portable systems where safety and compact design matter. Advancements in tank materials and leak-proof valves strengthen demand across refineries and gas distributors.
- For instance, studies on the alloy TiFe₀.₈₅Mn₀.₀₅ demonstrated a pilot system storing 50 kg of hydrogen using the intermetallic, with a stable cycle life exceeding 250 charge-discharge cycles.
By End Use
Transportation accounts for 38% of demand, leading the market as fuel cell vehicles, buses, and logistics fleets scale up in major cities. Mobility programs, refueling corridors, and zero-emission targets push higher consumption of clean hydrogen. Chemical manufacturing also represents a significant share, supporting ammonia, methanol, and polymer production. Food processing and pharmaceuticals adopt hydrogen for controlled atmosphere, hydrogenation, and sterilization processes. Metalworking uses hydrogen for annealing and reduction, benefiting from cleaner combustion and higher purity levels. Growth across sectors accelerates as governments invest in national hydrogen roadmaps.
Key Growth Drivers
Expansion of Refining and Ammonia Production
The chemical hydrogen market grows as refineries and ammonia plants demand high-purity hydrogen for desulfurization and feedstock conversion. Many refineries upgrade units to meet ultra-low sulfur fuel norms, which increases hydrogen intake in hydrotreating, hydrocracking, and isomerization. Ammonia producers also expand capacity to support fertilizers, nitric acid, and downstream industrial chemicals. Large integrated complexes favor steam methane reforming and partial oxidation systems for cost-efficient bulk supply. Governments in Asia and the Middle East invest in refinery expansions and fertilizer hubs, which accelerates procurement of reformers, purification units, and hydrogen pipelines. This supports steady consumption and boosts project deployments across petrochemicals and industrial gases.
- For instance, the SAFCO ammonia revamp increased single-train ammonia capacity to 3,670 metric tonnes per day, demonstrating how ammonia producers raise feedstock hydrogen demand by enlarging train throughput at existing complexes.
Shift Toward Clean and Low-Carbon Hydrogen
Growing pressure to cut emissions encourages industries to adopt blue and green hydrogen. Carbon capture integration in reformers and gasifiers reduces CO₂ intensity and helps companies meet sustainability goals. Many countries support low-carbon hydrogen through grants, electrolyzer incentives, tax credits, and green fuel mandates. Power producers and industrial clusters run pilot programs for co-firing, fuel blending, and renewable hydrogen injection. These policies accelerate electrolyzer installation, renewable integration, and hybrid hydrogen hubs. As clean hydrogen becomes a strategic path for decarbonization, market demand increases across transportation, chemicals, and distributed energy applications.
- For instance, ExxonMobil’s Baytown project aims to capture up to 7 million metric tons of CO₂ annually from low-carbon hydrogen production, illustrating how large industrial players are using carbon-capture to shift toward blue hydrogen.
Hydrogen Us in Fuel Cells and Mobility Applications
Hydrogen adoption in mobility increases due to zero-emission goals, longer driving range, and fast refueling advantages. Fuel cell buses, trucks, and forklifts gain traction in logistics, public transport, and warehousing. Mobility projects establish refueling corridors connecting industrial cities, ports, and airports. Manufacturers scale production of storage tanks, compressors, and fueling stations to serve fleet operators. Partnerships between automakers, energy firms, and gas suppliers support hydrogen rollout for commercial transport. The mobility segment’s rising demand strengthens industrial gas supply chains and creates long-term growth opportunities.
Key Trend & Opportunity
Development of Hydrogen Blending and Industrial Heat Systems
Industrial clusters explore blending hydrogen with natural gas to lower emissions in boilers, turbines, and high-temperature furnaces. Chemical, cement, steel, and glass manufacturers test partial substitution without modifying existing pipelines or burners. Hydrogen-ready burners, coated alloys, and leak-proof valves support industrial heat applications. This trend opens opportunities for gas distributors, burner manufacturers, and electrolyzer suppliers. As more plants decarbonize heavy heat processes, the hydrogen market gains a long-term foothold in industrial energy systems.
- For instance, Enbridge Gas Utah carried out a pilot blending up to 5% hydrogen by volume into its natural-gas distribution network serving about 1,800 customers, demonstrating blending in a live system without burner modifications.
Digitalization and Automation in Hydrogen Production
Producers adopt advanced sensors, automation, and predictive monitoring to optimize reforming, compression, and purification. Plant operators rely on AI-based analytics to track catalyst performance, heat integration, and fuel efficiency. Digital twins help simulate load variations and detect leaks or contamination in pipelines and storage tanks. These technologies reduce operational downtime and improve output stability. Automation encourages expansion of large-scale production units, pipeline networks, and storage clusters, supporting safer and more efficient hydrogen delivery.
- For instance, Peaxy deployed its Hydrogen Digital Twin platform for a major industrial client, enabling virtual modelling of integrated hydrogen plant units (electrolyzers + compression + storage) and dynamic KPI-generation including LCOH, thereby accelerating project engineering and operational readiness.
Key Challenge
High Cost of Clean Hydrogen and Infrastructure
Blue and green hydrogen remain costlier than grey hydrogen due to capital expenses, renewable variability, and high equipment cost. Electrolyzers, carbon capture units, storage tanks, and refueling stations require significant investment. Many regions still lack large refueling networks, long-distance pipelines, and liquefaction terminals. Without widespread infrastructure, industrial users depend on onsite systems or trucked supply, which increases logistics cost. This price gap slows adoption in transportation and industrial heat applications, making subsidies and scale-up critical to market growth.
Safety, Storage, and Transportation Constraints
Hydrogen’s low molecular weight and flammability require strict handling standards, high-strength tanks, and leak detection systems. Industries invest in advanced valves, pressure regulators, and monitoring sensors to maintain safety in pipelines and storage. Transporting hydrogen over long distances remains difficult, especially for liquid supply that needs cryogenic conditions. Metal embrittlement, boil-off losses, and thermal management add engineering challenges. These issues raise compliance cost and delay deployment of new distribution networks, particularly in developing markets with limited technical infrastructure.
Regional Analysis
North America
North America leads the chemical hydrogen market with a 35% share, supported by extensive refinery operations, ammonia production, and strong adoption of clean hydrogen initiatives. The United States accelerates low-carbon hydrogen through tax credits, electrolyzer incentives, and industrial decarbonization roadmaps. Major chemical clusters in Texas and the Gulf Coast integrate large reformers, pipeline networks, and carbon capture units to supply refineries and fertilizer plants. Canada and the U.S. expand mobility projects and industrial pilots for blending hydrogen in natural gas grids. Technology partnerships and government funding strengthen production capacity and long-term hydrogen storage solutions.
Europe
Europe holds a 30% market share driven by strict emission norms, advanced industrial gas networks, and strong presence of ammonia and polymer manufacturers. Germany, France, and the Netherlands invest heavily in electrolyzers, pipeline retrofits, and hydrogen import terminals. The region supports green hydrogen for transportation, chemical feedstock, and renewable-based power generation. Steelmakers and refineries adopt carbon-neutral pathways with blue and green hydrogen integration. Large-scale industrial hubs and public-private partnerships make Europe a key market for clean hydrogen expansion, supported by national hydrogen strategies and cross-border infrastructure projects.
Asia-Pacific
Asia-Pacific accounts for 25% of the market, driven by massive refinery and fertilizer capacity in China, India, Japan, and South Korea. Chemical manufacturers rely on grey hydrogen for ammonia, methanol, and polymer production at competitive cost. Governments in Japan and South Korea accelerate hydrogen imports, liquefaction terminals, and fuel cell mobility programs. China leads electrolyzer manufacturing and large chemical installations, while India scales renewable hydrogen pilots for industrial fuel switching. Industrial corridors, port-based hydrogen hubs, and refinery expansions ensure steady consumption across petrochemicals, metals, and industrial gas applications.
Latin America
Latin America holds a 6% market share, supported by fertilizer production, new renewable hydrogen projects, and refinery modernization. Brazil and Chile lead investments in solar and wind-powered electrolyzers for chemical and export applications. Refineries across Mexico and Brazil increase hydrogen demand for hydro-processing and desulfurization. The region also explores hydrogen-based ammonia and methanol export facilities to serve global chemical buyers. Although infrastructure is still developing, government incentives and renewable resources create strong long-term opportunities for clean hydrogen adoption.
Middle East & Africa
Middle East & Africa represent a 4% share, driven by refinery clusters, petrochemical plants, and large natural gas reserves. Gulf countries invest in blue hydrogen using carbon capture at large reformers, while new green hydrogen mega-projects target ammonia, methanol, and export markets. Saudi Arabia, UAE, and Oman develop hydrogen-ready industrial hubs and shipping terminals. Africa sees early-stage activity in South Africa and Morocco, with renewable-based pilot plants for chemical feedstock and export. Rising investment in infrastructure positions the region for long-term demand growth despite early-stage commercialization.
Market Segmentations:
By Type
- Grey
- Blue
- Green
By Storage Method
- Compressed Hydrogen
- Liquid Hydrogen
- Hydrogen Absorbed in Metal Hydrides
By End Use
- Transportation
- Chemical Manufacturing
- Food Processing
- Pharmaceuticals
- Metalworking
By Geography
- North America
- U.S.
- Canada
- Mexico
- Europe
- Germany
- France
- U.K.
- Italy
- Spain
- Rest of Europe
- Asia Pacific
- China
- Japan
- India
- South Korea
- South-east Asia
- Rest of Asia Pacific
- Latin America
- Brazil
- Argentina
- Rest of Latin America
- Middle East & Africa
- GCC Countries
- South Africa
- Rest of the Middle East and Africa
Competitive Landscape
The competitive landscape of the chemical hydrogen market includes global industrial gas suppliers, engineering contractors, and clean energy developers that expand large-scale production and distribution networks. Major companies such as Air Liquide, Linde plc, Technip Energies N.V., Air Products and Chemicals, Inc., RESONAC HOLDINGS CORPORATION, Reliance Industries Limited, Messer, Cummins Inc., Plug Power Inc., and Adani Green Energy focus on reforming technologies, electrolysis systems, hydrogen liquefaction, and carbon capture to support refinery, fertilizer, and petrochemical demand. Industrial gas leaders maintain long-term onsite supply agreements with ammonia producers, refineries, and chemical units, while energy companies develop low-carbon hydrogen hubs backed by government incentives. Equipment manufacturers scale electrolyzers, compressors, and storage systems for industrial and mobility applications. Partnerships between gas suppliers, engineering firms, and renewable energy developers enable large hydrogen clusters, export projects, and pipeline expansion. Continuous investment in clean hydrogen production, storage, and transportation strengthens market competition and accelerates technology deployment.
Key Player Analysis
- Technip Energies N.V.
- Air Liquide
- RESONAC HOLDINGS CORPORATION
- Cummins Inc.
- Messer
- Plug Power Inc.
- Linde plc
- Adani Green Energy
- Air Products and Chemicals, Inc.
- Reliance Industries Limited
Recent Developments
- In October 2025, Resonac’s Kawasaki Plant hydrogen co-firing gas turbine plan won METI support. The project targets fuel conversion and future hydrogen use on-site. It marks a step toward lower-carbon ammonia linked to hydrogen at the plant.
- In October 2025, Air Liquide invested USD 50 million to expand hydrogen supply in the U.S. Gulf Coast. The move supports new long-term hydrogen agreements with industrial customers. It strengthens production and pipeline reliability in the region.
- In October 2025, Technip Energies showcased its BlueH₂ by T.EN™ offerings at World Hydrogen Week. The exhibit highlighted end-to-end designs for low-carbon hydrogen at scale. It underlined process efficiency and CO₂ capture integration
Report Coverage
The research report offers an in-depth analysis based on Type, Storage Method, End Use and Geography. It details leading market players, providing an overview of their business, product offerings, investments, revenue streams, and key applications. Additionally, the report includes insights into the competitive environment, SWOT analysis, current market trends, as well as the primary drivers and constraints. Furthermore, it discusses various factors that have driven market expansion in recent years. The report also explores market dynamics, regulatory scenarios, and technological advancements that are shaping the industry. It assesses the impact of external factors and global economic changes on market growth. Lastly, it provides strategic recommendations for new entrants and established companies to navigate the complexities of the market.
Future Outlook
- Clean hydrogen production will rise as industries shift from grey to blue and green pathways.
- Electrolyzer capacity will expand due to government incentives and renewable integration.
- Carbon capture projects will increase adoption of low-carbon hydrogen in refineries and fertilizer plants.
- Fuel cell mobility will grow, supported by refueling stations and industrial fleet deployment.
- Hydrogen blending in natural gas grids will open new opportunities for industrial heat applications.
- Pipeline upgrades and liquefaction terminals will support large-scale distribution.
- Industrial gas suppliers will form more long-term supply contracts with chemical producers.
- Digital monitoring and automation will improve efficiency and safety in production units.
- Hydrogen-based ammonia and methanol export projects will expand in Asia and the Middle East.
- Public-private partnerships will accelerate infrastructure, storage, and mobility investments.
Request a Free Sample
Fill in your details and we'll send you a free sample report.
- Sample data tables & charts
- Research methodology
Need a Custom Version of This Report?
Tailor the scope, geography, or segments to your exact requirements.
- Custom geography or segment scope
- Direct access to our analyst team
Frequently Asked Questions
What is the current market size for Chemical Hydrogen Market, and what is its projected size in 2032?
At what Compound Annual Growth Rate is Chemical Hydrogen Market projected to grow between 2025 and 2032?
Which Chemical Hydrogen Market segment held the largest share in 2024?
What are the primary factors fueling the growth of Chemical Hydrogen Market?
Who are the leading companies in Chemical Hydrogen Market?
Which region commanded the largest share of Chemical Hydrogen Market in 2024?
Table of Content
Chapter 1. Report Introduction
- 1.1 Report Description & Purpose
- 1.1.1 Report Title & Market Definition
- 1.1.2 Unique Selling Propositions (USP) & Key Differentiators
- 1.1.3 Value Proposition for Stakeholders
- 1.2 Research Objectives
- 1.2.1 Market Sizing Objectives (Volume & Revenue)
- 1.2.2 Segmentation Objectives
- 1.2.3 Competitive Intelligence Objectives
- 1.2.4 Forecast & Scenario Objectives
- 1.3 Report Scope
- 1.3.1 Chemical Hydrogen Scope – Types & Subtypes Covered
- 1.3.2 Geographic Scope – Regions & Countries Covered
- 1.3.3 Historical Period, Base Year & Forecast Period (2024; forecast to 2032)
- 1.3.4 Inclusions & Exclusions
- 1.4 HS Code & Classification Framework
- 1.5 Currency, Units & Pricing Basis
- 1.6 Target Stakeholders
- 1.7 Limitations & Assumptions
Chapter 2. Executive Summary
- 2.1 Global Chemical Hydrogen Market Snapshot
- 2.1.1 Market Size – Historical (2024) & Forecast (2024-2032) (2024: USD 41010.18 million → 2032: USD 62462.1 million)
- 2.1.2 Volume & Revenue – Global Totals
- 2.1.3 Key Market Highlights – Top Five Facts
- 2.2 Chemical Hydrogen Market Segmentation Snapshot
- 2.2.1 Market Split by Region – 2024 vs. 2032
- 2.3 Competitive Snapshot
- 2.3.1 Top 10 Players by Revenue Share – 2024
- 2.3.2 Top 10 Players by Volume Share – 2024
- 2.3.3 Recent Strategic Developments (18-Month Summary)
- 2.4 Key Investment Highlights & Strategic Conclusions
Chapter 3. Chemical Hydrogen Market Dynamics & Industry Analysis
- 3.1 Market Overview & Context
- 3.1.1 Chemical Hydrogen Market Position in the Broader Automotive Value Chain
- 3.1.2 OEM vs. Replacement Market Dynamics
- 3.1.3 Market Maturity & Development Stage by Region
- 3.2 Chemical Hydrogen Market Drivers
- 3.3 Chemical Hydrogen Market Restraints & Challenges
- 3.4 Chemical Hydrogen Market Opportunities
- 3.5 Porter's Five Forces Analysis
- 3.5.1 Threat of New Entrants
- 3.5.2 Bargaining Power of Suppliers
- 3.5.3 Bargaining Power of Buyers
- 3.5.4 Threat of Substitutes
- 3.5.5 Competitive Rivalry – Intensity Assessment
- 3.6 Chemical Hydrogen Value Chain Analysis
- 3.6.1 Upstream – Raw Material/Input Suppliers
- 3.6.1.1 Raw Material/Input 1
- 3.6.1.2 Raw Material/Input 2
- 3.6.1.3 Raw Material/Input 3
- 3.6.2 Midstream – Production/Manufacturing/Service Delivery
- 3.6.2.1 Production/Process Overview
- 3.6.2.2 Key Facility Locations & Capacity by Manufacturer
- 3.6.3 Downstream – Distribution & End Consumer
- 3.6.3.1 Primary Channel – B2B/OEM
- 3.6.3.2 Secondary Channels – Dealer, Retail, Online, Direct
- 3.6.4 Value Chain Profitability Analysis
- 3.6.1 Upstream – Raw Material/Input Suppliers
- 3.7 PESTEL Analysis
- 3.7.1 Political Factors
- 3.7.2 Economic Factors
- 3.7.3 Social Factors
- 3.7.4 Technological Factors
- 3.7.5 Environmental Factors
- 3.7.6 Legal Factors
- 3.8 Chemical Hydrogen Supply Chain Analysis
- 3.8.1 Raw Material/Input Supply Risk Assessment
- 3.8.2 Manufacturing Concentration Risk (Geographic Exposure)
- 3.8.3 Trade Disruption Impact Analysis
- 3.9 Regulatory & Policy Landscape
Note: The regulatory and policy landscape section covers regulations based on their applicability to the market, Chemical Hydrogen category, geography, and scope of the study. Only regulatory frameworks with a material impact on operations, compliance, trade, sustainability, or market access are analyzed in detail.
Chapter 4. Key Investment Pockets & Opportunity Analysis
- 4.1 Chemical Hydrogen Market Attractiveness Analysis
- 4.1.1 By Region – Investment Attractiveness Matrix (Volume × CAGR)
- 4.2 Absolute Revenue Growth Opportunity
- 4.2.1 By Region – Absolute USD Growth Through 2032
- 4.3 Incremental Volume Opportunity
- 4.3.1 By Region – Incremental Volume Through 2032
- 4.3.2 Segment – Incremental Volume
- 4.4 Emerging Submarket Opportunity Deep Dive (Subject to Applicability)
- 4.5 Emerging Market Opportunity Scorecards
- 4.5.1 United States
- 4.5.2 Europe
- 4.5.3 Asia
- 4.5.4 Middle East & Africa
Note: Emerging Market Opportunity Scorecards will be included based on relevance and strategic importance. Regions listed are indicative and may vary depending on data availability and market dynamics.
Chapter 5. Chemical Hydrogen Import-Export Analysis & Trade Flows
- 5.1 Global Trade Overview
- 5.1.1 Global Export Value by Country (2024)
- 5.1.2 Global Export Volume by Country (2024)
- 5.1.3 Global Import Value by Country (2024)
- 5.1.4 Global Import Volume by Country (2024)
- 5.1.5 Net Trade Balance by Country (2024)
- 5.2 Export Analysis – Segment
- 5.2.1 Type 1 (HS Code)
- 5.2.2 Type 2 (HS Code)
- 5.2.3 Type 3 (HS Code)
- 5.2.4 Type 4 (HS Code)
- 5.2.5 Type 5 (HS Code)
- 5.3 Import Analysis – Segment
- 5.3.1 Type 1 (HS Code)
- 5.3.2 Type 2 (HS Code)
- 5.3.3 Type 3 (HS Code)
- 5.3.4 Type 4 (HS Code)
- 5.3.5 Type 5 (HS Code)
- 5.4 Average Unit Trade Prices
- 5.4.1 Average Export Price – Segment & Country
- 5.4.2 Average Import Price – Segment & Source Country
- 5.4.3 Price Trends (2024)
- 5.5 Key Trade Route Analysis
- 5.5.1 Trade Route 1
- 5.5.2 Trade Route 2
- 5.5.3 Trade Route 3
- 5.5.4 Trade Route 4
- 5.5.5 Trade Route 5
- 5.6 Trade Policy Impact Assessment
- 5.6.1 US Anti-Dumping & Section 301 Tariffs
- 5.6.2 EU Customs Union Impact
- 5.6.3 Major Free Trade Agreements
- 5.6.4 USMCA Rules of Origin
Note: Trade policy analysis will be included only where relevant to the Chemical Hydrogen market.
Chapter 6. Competitive Landscape & Company Benchmarking
- 6.1 Chemical Hydrogen Market Concentration & Structure
- 6.1.1 Herfindahl-Hirschman Index (HHI) – vs. 2024
- 6.1.2 Tier 1, Tier 2 & Tier 3 Market Structure
- 6.1.3 Global, Regional & Local Player Dynamics
- 6.2 Chemical Hydrogen Market Share Analysis – 2024
- 6.2.1 Global Revenue Share by Company
- 6.2.2 Global Volume Share by Company
- 6.2.3 Regional Revenue Share
- 6.2.4 Market Share Evolution ( vs. 2024)
- 6.2.5 OEM Segment Share by Company
- 6.2.6 Replacement Segment Share by Company
- 6.3 Production/Delivery Capacity & Facility Analysis
- 6.3.1 Global Installed Capacity
- 6.3.2 Capacity Utilization Rates
- 6.3.3 Production/Output Volume
- 6.3.4 Facility Locations & Capacity Map
- 6.3.5 Planned Capacity Additions
- 6.4 Chemical Hydrogen Competitive Benchmarking Matrix
- 6.4.1 Revenue, Volume, CAGR & Profitability Comparison
- 6.4.2 Channel Revenue Mix
- 6.4.3 Geographic Revenue Exposure
- 6.4.4 R&D Intensity
- 6.4.5 Sustainability Maturity
- 6.5 Strategic Developments in Chemical Hydrogen (Last 24 Months)
- 6.5.1 Mergers, Acquisitions & Divestments
- 6.5.2 New Chemical Hydrogen Launches
- 6.5.3 Facility Expansions
- 6.5.4 Strategic Alliances, Joint Ventures & Partnerships
- 6.5.5 Distribution Expansion & Market Entry
- 6.5.6 Sustainability & ESG Initiatives
- 6.6 Competitive Strategy Mapping
- 6.6.1 Leader, Challenger, Follower & Niche Classification
- 6.6.2 Pricing Strategy Comparison
- 6.6.3 Channel Strategy Matrix
Note: Strategic developments are included based on their materiality and the availability of reliable information.
Chapter 7. Global Chemical Hydrogen Market – By Distribution Channel
- 7.1 Segment Overview
- 7.1.1 Volume & Revenue Split by Channel (2024 & 2032)
- 7.1.2 Channel Mix Evolution (2024-2032)
Chapter 8. Regional Market Analysis – Global Overview
- 8.1 Global Regional Overview
- 8.1.1 Regional Volume Share
- 8.1.2 Regional Revenue Share
- 8.1.3 Regional Volume by Region
- 8.1.4 Regional Revenue by Region
- 8.1.5 Regional Forecast Through 2032
- 8.2 Cross-Regional Segment Analysis
- 8.2.1 By Distribution Channel
- 8.2.2 By Brand/Price Tier
Chapter 9. North America Chemical Hydrogen Market
- 9.1 United States
- 9.2 Canada
- 9.3 Mexico
Chapter 10. Europe Chemical Hydrogen Market
- 10.1 Germany
- 10.2 France
- 10.3 Italy
- 10.4 United Kingdom
- 10.5 Spain
- 10.6 Poland
- 10.7 Russia
- 10.8 Netherlands
- 10.9 Belgium
- 10.10 Sweden
- 10.11 Denmark
- 10.12 Norway
- 10.13 Rest of Europe
Chapter 11. Asia Pacific Chemical Hydrogen Market
- 11.1 China
- 11.2 India
- 11.3 Japan
- 11.4 South Korea
- 11.5 Thailand
- 11.6 Indonesia
- 11.7 Vietnam
- 11.8 Malaysia
- 11.9 Australia
- 11.10 Rest of Asia Pacific
Chapter 12. Latin America Chemical Hydrogen Market
- 12.1 Brazil
- 12.2 Argentina
- 12.3 Colombia
- 12.4 Chile
- 12.5 Rest of Latin America
Chapter 13. Middle East Chemical Hydrogen Market
- 13.1 Saudi Arabia
- 13.2 United Arab Emirates
- 13.3 Turkey
- 13.4 Israel
- 13.5 Iran
- 13.6 Rest of the Middle East
Chapter 14. Africa Chemical Hydrogen Market
- 14.1 South Africa
- 14.2 Egypt
- 14.3 Nigeria
- 14.4 Morocco
- 14.5 Rest of Africa
Chapter 15. Chemical Hydrogen Company Profiles
- 15.1 [Company 01]
- 15.1.1 Company Overview
- 15.1.2 Key Management Personnel
- 15.1.3 Products & Services Portfolio
- 15.1.4 Financial Performance
- 15.1.5 Key Market Focus & Geographic Presence
- 15.1.6 Recent Developments & Strategic Initiatives
Note: The company profile list is preliminary and may change based on research findings, market developments, data availability, and client requirements.
Chapter 16. Appendices
- Appendix A – List of Abbreviations & Acronyms
- Appendix B – Industry Classification Code Reference – Full Series
- Appendix C – Production & Capacity Data Tables
- Appendix D – End-Use & Demand Base Tables
- Appendix E – Consumption & Replacement Rate Assumptions
- Appendix F – ASP Reference Tables
- Appendix G – Manufacturing & Facility Database
- Appendix H – Import-Export Data Tables
- Appendix I – Regulatory Summary Tables
- Appendix J – Primary Research Participant List (Anonymized)
- Appendix K – Primary Research Questionnaire Framework
- Appendix L – Data Sources & Bibliography
- Appendix M – Market Size Divergence & Source Comparison
Chapter 17. Research Methodology
- 17.1 Research Framework & Philosophy
- 17.2 Secondary Research – Sources, Hierarchy & Data Extraction
- 17.3 Data Modeling – Bottom-Up & Top-Down Market Sizing
- 17.4 Primary Research – Stakeholder Framework, LOI & Sample Sizes
- 17.5 Forecast Methodology – Regression, Scenario & Sensitivity Analysis
- 17.6 Quality Control – Four-Layer Validation Framework
- 17.7 Limitations & Standard Assumptions
- 17.8 Disclaimer
