Market Overview:
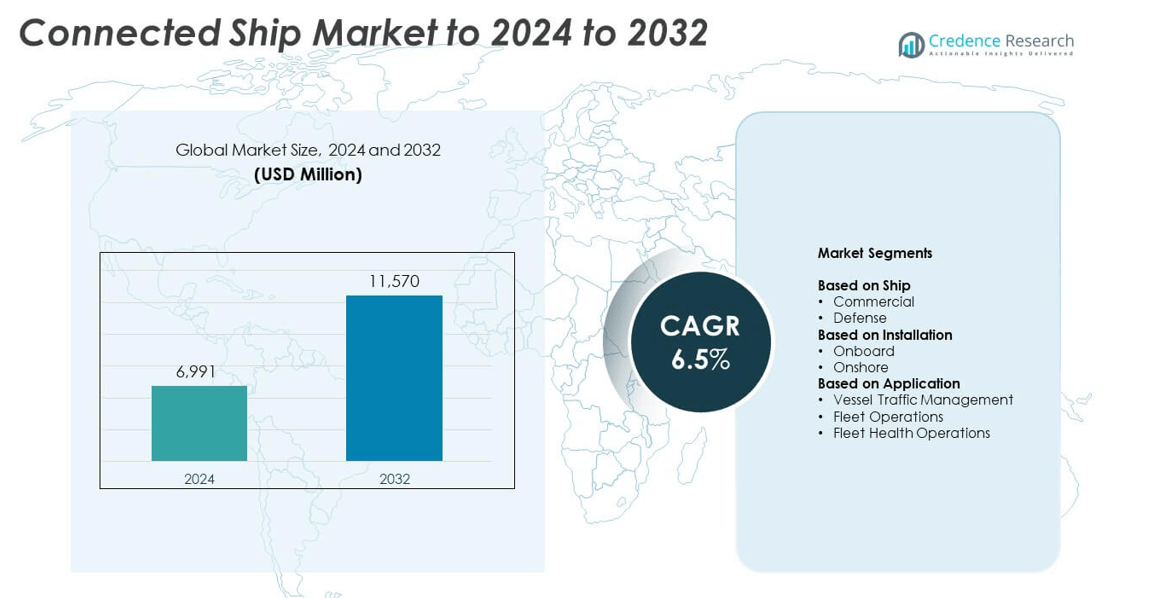
Connected Ship Market size was valued at USD 6,991 million in 2024 and is anticipated to reach USD 11,570 million by 2032, at a CAGR of 6.5% during the forecast period.
| REPORT ATTRIBUTE |
DETAILS |
| Historical Period |
2020-2023 |
| Base Year |
2024 |
| Forecast Period |
2025-2032 |
| Connected Ship Market Size 2024 |
USD 6,991 million |
| Connected Ship Market, CAGR |
6.5% |
| Connected Ship Market Size 2032 |
USD 11,570 million |
The connected ship market is led by major players including Wärtsilä, ABB, Kongsberg Maritime, Rockwell Automation, Marlink B.V., Sperry Marine B.V., Danelec Marine A/S, Anglo-Eastern, Schneider Electric, YALTES Electronic and Information Systems Production and Trade Inc., and HD Hyundai Heavy Industries Co., Ltd. These companies dominate through advanced digital platforms, integrated IoT solutions, and predictive maintenance technologies that improve fleet efficiency and safety. North America led the market with a 36.2% share in 2024, followed by Europe at 30.8% and Asia Pacific at 25.4%. Their leadership is supported by robust maritime digitalization, regulatory compliance, and growing adoption of smart vessel management systems.
Market Insights
- The connected ship market was valued at USD 6,991 million in 2024 and is projected to reach USD 11,570 million by 2032, growing at a CAGR of 6.5%.
- Growing integration of IoT, AI, and cloud systems in commercial and defense vessels drives market expansion by improving operational safety and energy efficiency.
- Advancements in autonomous vessel technology, satellite communication, and data analytics are shaping key market trends, enabling real-time decision-making and predictive maintenance.
- The market remains moderately consolidated, with leading players focusing on cybersecurity, remote monitoring, and strategic collaborations to enhance digital maritime solutions.
- North America dominated with a 36.2% share in 2024, followed by Europe at 30.8% and Asia Pacific at 25.4%, while the commercial ship segment led with a 63.4% share, reflecting growing investment in digitalized fleet operations across major shipping nations.
Access crucial information at unmatched prices!
Request your sample report today & start making informed decisions powered by Credence Research Inc.!
Download Sample
Market Segmentation Analysis:
By Ship
The commercial segment dominated the connected ship market with a 63.4% share in 2024. This leadership is driven by the rising adoption of IoT and AI-based navigation, cargo monitoring, and performance optimization systems in merchant and passenger vessels. Shipping companies are integrating connected solutions to improve route efficiency, fuel management, and compliance with emission regulations. The expansion of global trade routes and the adoption of digital fleet management systems in commercial shipping fleets further strengthen this segment’s dominance over the forecast period.
- For instance, a key agreement in 2022 saw Kongsberg Digital sign a contract to digitalize the entire fleet of MSC, the world’s largest container line, consisting of approximately 500 vessels.
By Installation
The onboard segment held the largest share of 58.9% in 2024. Demand is primarily driven by the growing need for advanced communication systems, sensors, and data analytics tools integrated directly within vessels. Onboard installations enable real-time monitoring of machinery performance, predictive maintenance, and enhanced safety operations. Increasing investments by shipbuilders in smart bridge systems and integrated control units for autonomous and semi-autonomous vessels continue to accelerate the adoption of connected onboard technologies.
- For instance, StormGeo reported 75,000 routed voyages in 2024 and 5,600 vessels equipped with its digital route optimization tools.
By Application
The fleet operations segment accounted for the largest share of 47.8% in 2024. This dominance stems from the increasing need for centralized control and data-driven decision-making across global shipping fleets. Connected systems improve operational efficiency, reduce downtime, and enable condition-based maintenance of engines and equipment. The adoption of IoT-enabled monitoring platforms and satellite-based communication networks by major shipping lines to optimize logistics and enhance fuel performance is a key driver supporting the growth of this segment.
Key Growth Drivers
Integration of IoT and AI Technologies
The growing integration of IoT and artificial intelligence in marine systems is a major growth driver. These technologies enable real-time monitoring, predictive maintenance, and automated control, improving operational efficiency and reducing downtime. Smart sensors collect data across vessel components, enhancing fuel optimization and safety. Increased adoption of AI-based analytics for route planning and cargo management is transforming ship operations into data-driven systems, encouraging fleet modernization.
- For instance, Wärtsilä’s Fleet Optimisation Solution on 31 Carisbrooke vessels cut CO₂ by 600 tons and achieved 5–7% fuel savings.
Expansion of Maritime Trade and Logistics Networks
Rising international trade volumes and growing container traffic drive the demand for connected ship systems. Shipping operators are investing in digital platforms to manage global fleet operations efficiently. The need for seamless communication between ships, ports, and logistics hubs supports the deployment of advanced connectivity solutions. The expansion of e-commerce and global supply chains further enhances the demand for digital navigation and tracking systems across commercial shipping.
- For instance, ORBCOMM has enabled tracking for 600,000 reefer containers and shipped over 1,000,000 dry-container devices in 2024.
Regulatory Push for Safety and Environmental Compliance
Stringent international maritime regulations aimed at safety, fuel efficiency, and emission reduction are accelerating connected ship adoption. Governments and maritime authorities require ships to install monitoring systems to ensure compliance with emission control areas and safety protocols. Advanced connectivity solutions help operators meet IMO guidelines and achieve sustainability targets. Compliance-driven technology adoption remains a major factor propelling investments in connected ship systems globally.
Key Trends & Opportunities
Shift Toward Autonomous and Remote-Controlled Vessels
The development of autonomous and semi-autonomous vessels is emerging as a major trend in the connected ship market. These vessels rely heavily on real-time connectivity, onboard sensors, and AI-based navigation systems for safe and efficient operation. Shipbuilders and technology providers are investing in remote-control capabilities to improve precision and reduce crew dependency. This trend presents opportunities for advanced communication and monitoring solution providers across the maritime sector.
- For instance, Avikus will install its AI-based HiNAS Control on 10 KMTC vessels to enhance safety and fuel efficiency.
Rising Adoption of Cloud-Based Maritime Analytics
Cloud computing and data analytics platforms are reshaping ship management operations. Cloud-based solutions enable centralized data storage, real-time fleet monitoring, and performance benchmarking across routes. Maritime operators are leveraging analytics to predict equipment failures and optimize fuel consumption. The shift toward scalable and secure cloud infrastructure offers opportunities for maritime technology companies to enhance digital collaboration and operational visibility.
- For instance, Veson’s cloud IMOS Platform supports 21,000 global users and manages 165,000 commercial voyages annually.
Key Challenges
Cybersecurity Risks and Data Vulnerability
Increasing digitalization in ship operations exposes maritime systems to cybersecurity threats. Connected ships depend on complex networks, which are vulnerable to hacking, malware, and unauthorized data access. Breaches can disrupt operations, compromise navigation systems, and pose serious safety risks. Addressing these vulnerabilities requires robust cybersecurity frameworks and continuous monitoring, making security integration a significant operational challenge.
High Implementation and Maintenance Costs
Deploying connected ship technologies involves significant upfront investment in sensors, satellite systems, and onboard communication hardware. Smaller operators face financial challenges in upgrading legacy fleets due to cost constraints. Additionally, maintenance and software updates require skilled personnel and consistent investment. These cost factors limit adoption in developing markets and among mid-sized shipping companies, restraining overall market penetration.
Regional Analysis
North America
North America held the largest share of 36.2% in the connected ship market in 2024. Growth is driven by advanced maritime infrastructure, strong digitalization efforts, and investments in smart ship technologies by major fleet operators. The United States leads regional adoption, supported by defense modernization and commercial shipping automation. Growing deployment of satellite communication and predictive maintenance systems across naval and merchant vessels enhances operational efficiency. The presence of key players offering integrated connectivity and cybersecurity solutions further strengthens the region’s dominance.
Europe
Europe accounted for a 30.8% share of the connected ship market in 2024. The region’s strong maritime heritage and focus on sustainable shipping practices drive technology integration. Countries such as Norway, Germany, and the Netherlands are advancing smart port and connected vessel programs. The implementation of IMO emission standards encourages adoption of real-time monitoring and navigation systems. European shipyards and technology firms are actively collaborating on autonomous ship trials, enhancing regional competitiveness and supporting innovation in next-generation maritime connectivity.
Asia Pacific
Asia Pacific captured a 25.4% share in 2024, emerging as one of the fastest-growing regional markets. Expanding shipbuilding activity in China, South Korea, and Japan fuels demand for onboard digital systems. Regional fleets are adopting IoT and satellite-based communication platforms to improve route management and fuel optimization. Rising exports, growing maritime trade, and the digital transformation of port infrastructure further accelerate adoption. Government-backed initiatives promoting smart maritime ecosystems strengthen Asia Pacific’s position as a leading growth hub.
Latin America
Latin America held a 4.1% share of the connected ship market in 2024. The region benefits from expanding offshore oil exploration, increasing port modernization, and adoption of digital navigation systems. Brazil and Mexico are key contributors, investing in connected solutions for fleet management and safety monitoring. Growing collaboration with international technology providers is improving data analytics capabilities across shipping operations. Despite slower digitalization compared to other regions, rising trade activity and maritime security initiatives are boosting gradual adoption.
Middle East & Africa
The Middle East & Africa region accounted for a 3.5% share in 2024. The adoption of connected ship technologies is gaining traction with increasing investments in commercial ports and naval modernization. Countries such as the UAE and Saudi Arabia are integrating smart communication systems to enhance fleet efficiency. Growing maritime trade through the Suez Canal and Red Sea corridor supports regional demand. However, limited digital infrastructure and high deployment costs restrain large-scale implementation, though gradual growth is expected through strategic partnerships.
Market Segmentations:
By Ship
By Installation
By Application
- Vessel Traffic Management
- Fleet Operations
- Fleet Health Operations
By Geography
- North America
- Europe
- Germany
- France
- U.K.
- Italy
- Spain
- Rest of Europe
- Asia Pacific
- China
- Japan
- India
- South Korea
- South-east Asia
- Rest of Asia Pacific
- Latin America
- Brazil
- Argentina
- Rest of Latin America
- Middle East & Africa
- GCC Countries
- South Africa
- Rest of the Middle East and Africa
Competitive Landscape
The connected ship market features strong competition among key players such as Wärtsilä, Rockwell Automation, ABB, Kongsberg Maritime, Marlink B.V., Sperry Marine B.V., Danelec Marine A/S, Anglo-Eastern, Schneider Electric, YALTES Electronic and Information Systems Production and Trade Inc., and HD Hyundai Heavy Industries Co., Ltd. Companies are focusing on integrating IoT platforms, cloud analytics, and real-time monitoring systems to enhance ship efficiency and safety. Strategic partnerships between technology providers and shipbuilders are driving innovation in navigation, fleet management, and autonomous control solutions. Firms are also investing in cyber-secure communication networks to safeguard digital infrastructures. Continuous R&D efforts aim to improve predictive maintenance and optimize fuel performance, aligning with environmental compliance goals. Expanding service portfolios through software upgrades, satellite connectivity, and remote monitoring solutions enables companies to strengthen customer engagement. Competitive strategies are increasingly centered on data-driven decision-making and digital transformation within the global maritime ecosystem.
Shape Your Report to Specific Countries or Regions & Enjoy 30% Off!
Key Player Analysis
- Wärtsilä
- Rockwell Automation
- ABB
- Kongsberg Maritime
- Marlink B.V.
- Sperry Marine B.V.
- Danelec Marine A/S
- Anglo-Eastern
- Schneider Electric
- YALTES Electronic and Information Systems Production and Trade Inc.
- HD Hyundai Heavy Industries Co., Ltd.
Recent Developments
- In 2025, Schneider Electric continues to lead with its EcoStruxure™ platform, enhancing vessel safety, efficiency, and sustainability through an interoperable IoT architecture linking power and machinery systems.
- In 2025, Kongsberg Maritime Signed a contract with REACH Subsea ASA for the design, construction, and delivery of two additional unmanned surface vessels (USVs) based on the UT5208 design, expanding the REACH REMOTE fleet for remote and autonomous offshore operations.
- In 2023, ABB Marine & Ports Secured an agreement to deliver a comprehensive power distribution system for two newbuild hydrogen-fueled container ships for the Samskip Group, which are among the first of their kind to use hydrogen as a fuel.
Report Coverage
The research report offers an in-depth analysis based on Ship, Installation, Application and Geography. It details leading market players, providing an overview of their business, product offerings, investments, revenue streams, and key applications. Additionally, the report includes insights into the competitive environment, SWOT analysis, current market trends, as well as the primary drivers and constraints. Furthermore, it discusses various factors that have driven market expansion in recent years. The report also explores market dynamics, regulatory scenarios, and technological advancements that are shaping the industry. It assesses the impact of external factors and global economic changes on market growth. Lastly, it provides strategic recommendations for new entrants and established companies to navigate the complexities of the market.
Future Outlook
- Increasing integration of AI and IoT will enhance real-time decision-making across ship operations.
- Autonomous and remote-controlled vessels will become more common in commercial and defense fleets.
- Expansion of maritime 5G and satellite connectivity will improve vessel communication reliability.
- Growing demand for predictive maintenance systems will reduce downtime and enhance fleet performance.
- Cybersecurity solutions will become essential to protect connected vessels from digital threats.
- Cloud-based fleet management platforms will streamline data analytics and operational visibility.
- Sustainable shipping initiatives will drive adoption of connected technologies for emission monitoring.
- Collaboration between shipbuilders and tech companies will accelerate digital transformation in maritime operations.
- Smart ports and digital logistics systems will boost interoperability with connected ships.
- Continuous regulatory emphasis on safety and compliance will sustain market growth globally.


