Market Overview:
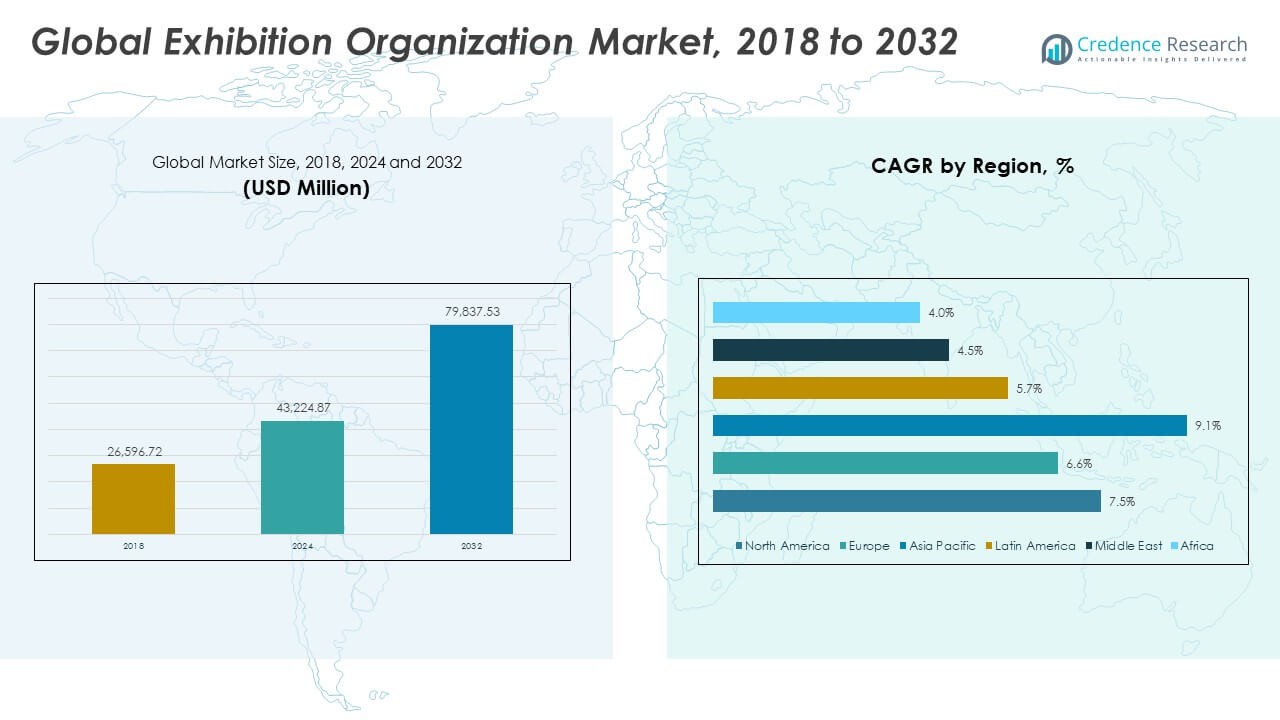
The Global Exhibition Organization Market size was valued at USD 26,596.72 million in 2018, reached USD 43,224.87 million in 2024, and is anticipated to attain USD 79,837.53 million by 2032, growing at a CAGR of 7.42% during the forecast period.
| REPORT ATTRIBUTE |
DETAILS |
| Historical Period |
2020-2023 |
| Base Year |
2024 |
| Forecast Period |
2025-2032 |
| Exhibition Organization Market Size 2024 |
USD 43,224.87 Million |
| Exhibition Organization Market, CAGR |
7.42% |
| Exhibition Organization Market Size 2032 |
USD 79,837.53 Million |
The market growth is driven by the rising demand for international trade fairs, brand expos, and industry-specific exhibitions. Companies are using exhibitions to strengthen B2B networks, promote new products, and enhance brand visibility. The increasing adoption of digital registration tools, hybrid events, and data analytics for visitor tracking also contributes to operational efficiency and higher engagement levels in global exhibitions.
Regionally, Europe leads due to its long-established exhibition infrastructure in countries such as Germany, the UK, and France. North America follows, supported by strong corporate event participation and marketing investments. Asia-Pacific is emerging rapidly, driven by expanding economies, government trade initiatives, and the rising presence of international exhibitors in China, India, and Southeast Asia.
Access crucial information at unmatched prices!
Request your sample report today & start making informed decisions powered by Credence Research Inc.!
Download Sample
Market Insights:
- The Global Exhibition Organization Market was valued at USD 26,596.72 million in 2018, reached USD 43,224.87 million in 2024, and is expected to hit USD 79,837.53 million by 2032, expanding at a CAGR of 7.42% during the forecast period.
- North America (43.8%), Europe (27.6%), and Asia Pacific (20.7%) collectively dominate global revenue due to advanced infrastructure, established trade fair ecosystems, and extensive corporate event participation. These regions benefit from strong venue networks, international exhibitor bases, and consistent government support for business tourism.
- Asia Pacific is the fastest-growing region, driven by rapid industrialization, digital transformation, and government-led trade initiatives in China, India, and Southeast Asia. The region’s expanding consumer markets and modern convention facilities continue to attract international participation.
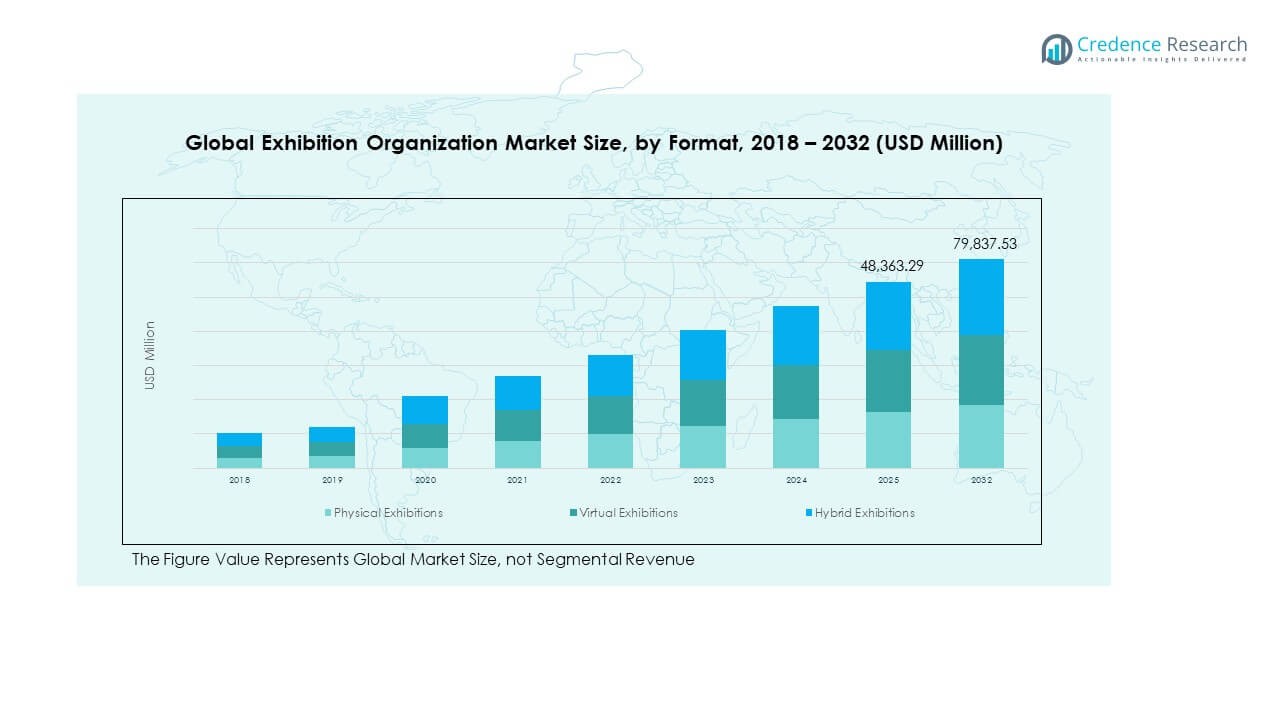
- By format, Physical Exhibitions account for approximately 55% of the total market, remaining the preferred medium for face-to-face networking, live demonstrations, and sponsorship opportunities.
- Virtual and Hybrid Exhibitions together hold around 45%, supported by rising adoption of digital event technologies that enhance accessibility, audience engagement, and real-time analytics for global participants.
Market Drivers:
Rising Demand for Trade Fairs and Corporate Showcases Across Global Industries
The Global Exhibition Organization Market benefits from strong participation in trade fairs across diverse industries. Companies use exhibitions to introduce products, build partnerships, and connect with clients. Growth in consumer-focused expos such as automotive, fashion, and electronics events boosts overall attendance. Exhibitors view these platforms as essential marketing and networking tools. It attracts small and large businesses seeking visibility among global audiences. Governments and trade associations support exhibitions to promote national industries. Expanding corporate marketing budgets also raise demand for large-scale trade events. This trend continues to strengthen global business collaboration and cross-border commerce.
- For instance, Informa PLC reported that its ‘Informa Markets’ division operates more than 450 specialist global events (or brands) across more than 30 countries and the entire parent company engages more than 14,000 colleagues company-wide, with the ‘Informa Markets’ division itself employing over 4,000 colleagues.
Digitalization and Adoption of Hybrid Event Models Enhancing Efficiency and Reach
Technological integration is transforming the Global Exhibition Organization Market by improving event accessibility. Hybrid models combining physical and virtual participation increase attendance flexibility. Event organizers deploy digital tools for registration, analytics, and virtual booths. These technologies reduce operational costs and expand the audience base beyond geographic limits. Companies benefit from real-time visitor data for performance tracking and lead generation. It enables exhibitors to maintain engagement before and after events. Cloud-based solutions streamline coordination among multiple stakeholders. This transformation supports inclusivity, accessibility, and measurable outcomes for global participants.
Rising Corporate Marketing Investments and Expansion of Industry-Specific Expos
The market gains momentum through higher corporate allocations toward experiential marketing. Businesses across technology, healthcare, and manufacturing sectors sponsor dedicated exhibitions to target niche audiences. Industry-specific expos attract focused participants, improving lead quality and ROI. It drives stronger participation from international exhibitors seeking new opportunities. Large enterprises invest in pavilion spaces to reinforce global branding strategies. Sponsorship packages and product launch events enhance corporate presence. Exhibition organizers innovate with customized formats and sectoral networking hubs. This evolution aligns marketing goals with direct audience interaction, sustaining long-term growth.
Supportive Government Policies and Trade Promotion Initiatives Driving Market Growth
Government-led initiatives play a key role in shaping the Global Exhibition Organization Market. Trade ministries and export councils invest in infrastructure and promotion programs. Incentives for SMEs to participate in international exhibitions broaden market diversity. Free trade agreements encourage global business participation in cross-border events. It drives venue expansion in emerging markets to attract international attention. Cities develop dedicated exhibition centers and convention complexes. Partnerships between public bodies and private organizers enhance event scale and visibility. The collective focus on business tourism contributes to economic and employment growth.
Market Trends:
Emergence of Sustainable Exhibition Practices and Environmentally Conscious Operations
Sustainability is becoming a defining trend in the Global Exhibition Organization Market. Event organizers adopt eco-friendly practices such as digital ticketing and waste management systems. Reusable booth materials and renewable energy usage reduce carbon footprints. Attendees favor events that demonstrate environmental accountability. It encourages suppliers to align services with green standards. Certification systems promote transparency in environmental performance. Venues adopt energy-efficient lighting and HVAC systems to meet global standards. Sustainability now defines brand reputation and investor perception across major trade events.
- For instance, the Union of International Fairs (UFI) reported that across 812 organizers at 2023 European fairs there were 567,758 exhibitors and 49.9 million visits, noting an increasing portion of “eco-efficient” exhibitor practices.
Growing Integration of Data Analytics, AI, and Automation in Event Management
The adoption of analytics and AI tools is reshaping event planning and execution. Organizers use predictive analytics for visitor profiling and scheduling optimization. Automated lead capture systems enhance exhibitor efficiency. It allows better matchmaking between buyers and sellers. AI-driven chatbots improve real-time communication and attendee support. Data-driven insights help refine booth placement, pricing, and marketing strategy. Cloud-based analytics platforms facilitate performance evaluation for future editions. This integration supports precision marketing and outcome-based decision-making in exhibitions.
- For instance, analytics platforms deployed by event companies include dashboards providing real-time visitor density, booth dwell time and heat-map data.
Rising Popularity of Niche and Sector-Focused Trade Events Across Regions
The Global Exhibition Organization Market is witnessing a surge in niche events tailored to specific industries. Specialized expos in renewable energy, beauty, robotics, and aerospace attract targeted visitors. It enables brands to showcase expertise in focused segments. Such events foster high conversion rates due to defined participant profiles. Regional clusters develop around industry-specific exhibitions to support local ecosystems. Niche formats encourage startups to enter competitive spaces with limited budgets. This trend diversifies event portfolios and deepens industry collaboration worldwide.
Expansion of International Exhibition Networks and Cross-Border Collaborations
Global collaboration between organizers is expanding market boundaries. Partnerships among regional players improve operational capability and audience reach. It allows co-hosting of events across continents with unified branding. Cross-border cooperation supports resource sharing and standardization. International exhibition alliances promote exchange of innovation and technology. Collaborative scheduling prevents overlap and enhances attendance consistency. Such alliances create stronger global recognition and long-term market sustainability. These integrated frameworks redefine competitive dynamics in the exhibition industry.
Market Challenges Analysis:
High Operational Costs, Venue Limitations, and Uneven Global Infrastructure
The Global Exhibition Organization Market faces challenges from escalating operational expenses. Venue rentals, logistics, and staff costs continue to rise across major cities. Limited infrastructure in developing countries restricts large-scale event planning. It forces organizers to depend on established markets, limiting regional diversification. Maintenance and technological upgrades also add recurring costs. Smaller players struggle to compete due to limited budgets and lack of advanced facilities. Regulatory restrictions and taxation policies create further hurdles for cross-border event management. These barriers impact profit margins and slow down expansion in new regions.
Competition from Digital Alternatives and Shifting Participant Behavior
Digital conferencing tools and virtual events challenge traditional exhibition formats. Many firms opt for online platforms offering lower costs and broader reach. It forces organizers to invest in hybrid models to retain participants. The shift in attendee expectations toward digital interactivity affects physical attendance. Data privacy concerns and cybersecurity threats complicate virtual engagement strategies. Event fatigue among audiences also reduces participation frequency. Maintaining visitor retention and exhibitor satisfaction remains a critical issue. Balancing physical presence with digital integration defines future market resilience.
Market Opportunities:
Expanding Opportunities in Emerging Economies with Strong Trade and Industrial Growth
The Global Exhibition Organization Market sees new opportunities in Asia-Pacific, Latin America, and the Middle East. Rapid industrialization and economic diversification attract international exhibitors. Governments invest in world-class convention centers and business tourism facilities. It strengthens regional competitiveness and boosts event participation. Local businesses seek global exposure through trade showcases. Expanding middle-class populations raise consumer-driven exhibitions in multiple sectors. These markets present significant growth potential for global organizers and sponsors.
Technological Advancements and Personalized Visitor Engagement Solutions Creating New Avenues
Technology-driven innovation opens new frontiers for organizers and exhibitors. AI-based matchmaking tools enhance lead generation quality. Virtual and augmented reality features elevate the attendee experience. It supports personalized recommendations, product demos, and interactive displays. Data analytics helps exhibitors design targeted marketing campaigns. Cloud-based ticketing and engagement apps simplify user experience. These advancements foster continuous engagement and long-term brand connections. The integration of immersive technologies promises stronger audience retention and measurable outcomes.
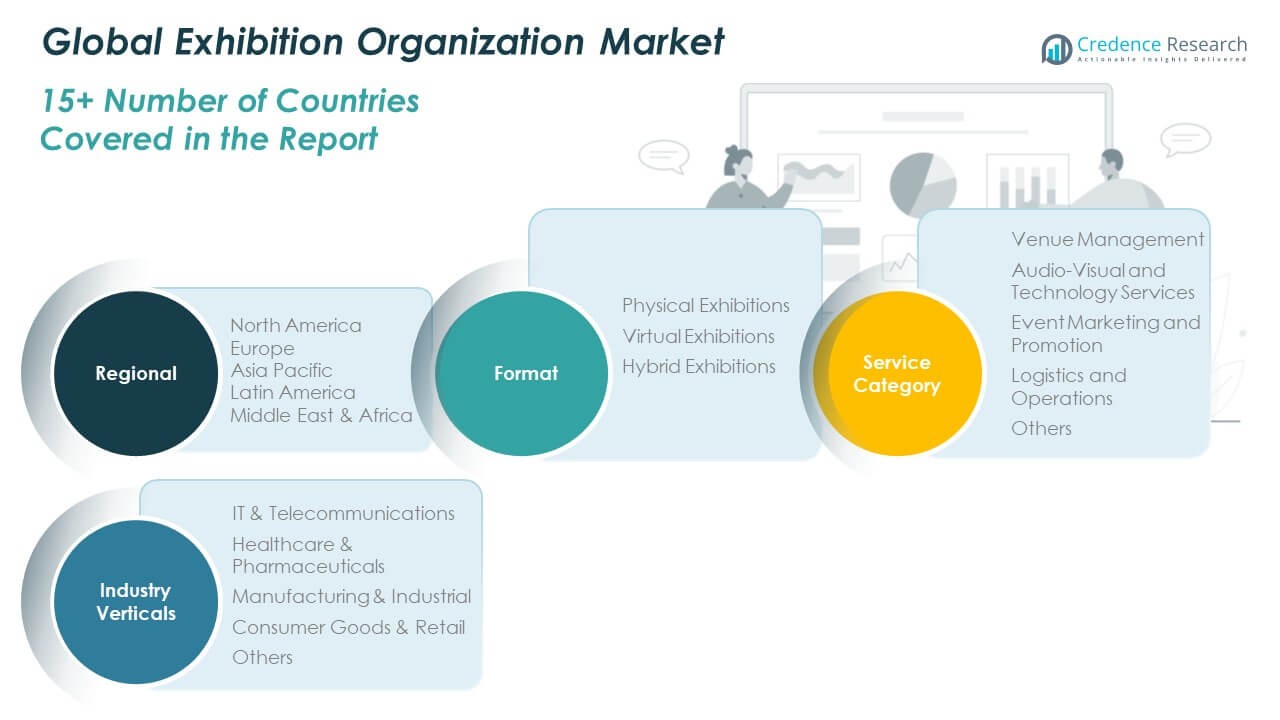
Market Segmentation Analysis:
By Format Segment
The Global Exhibition Organization Market is divided into physical, virtual, and hybrid exhibitions. Physical exhibitions hold a dominant share due to their networking value, live demonstrations, and strong sponsorship returns. Virtual formats have gained relevance with the adoption of digital platforms that enable global participation. Hybrid exhibitions are expanding rapidly by combining face-to-face engagement with digital accessibility. It provides flexibility for exhibitors and attendees, reducing travel limitations and cost barriers. The hybrid format enhances event reach, offering measurable engagement through integrated analytics and virtual tools.
- For instance, platforms used by exhibitors showed that 50.7 % of executives expect all in-person events to include a virtual component.
By Service Category Segment
Key service categories include venue management, audio-visual and technology services, event marketing and promotion, logistics and operations, and others. Venue management contributes significantly due to large-scale convention operations and infrastructure development. Audio-visual and technology services grow with demand for digital displays, live streaming, and interactive platforms. Event marketing and promotion strengthen brand visibility and attendee engagement. It enables organizers to attract high-value sponsors and participants, improving event outcomes.
- For instance, the use of live streaming of major exhibitions expanded with analytics tools showing session popularity and attendee drop-off points.
By Industry Verticals Segment
The market serves industries such as IT & telecommunications, healthcare & pharmaceuticals, manufacturing & industrial, consumer goods & retail, and others. IT & telecommunications lead due to continuous product innovations and global conferences. Healthcare and pharmaceuticals follow, driven by regulatory events and medical expos. Manufacturing and industrial sectors emphasize trade shows for machinery and automation. It showcases emerging technologies and business collaborations. Consumer goods and retail exhibitions support product launches and retail partnerships across global markets.
Segmentation:
By Format Segment
- Physical Exhibitions
- Virtual Exhibitions
- Hybrid Exhibitions
By Service Category Segment
- Venue Management
- Audio-Visual and Technology Services
- Event Marketing and Promotion
- Logistics and Operations
- Others
By Industry Verticals Segment
- IT & Telecommunications
- Healthcare & Pharmaceuticals
- Manufacturing & Industrial
- Consumer Goods & Retail
- Others
By Country (Examples under Each Region)
- North America:S., Canada, Mexico
- Europe: UK, France, Germany, Italy, Spain, Russia, Rest of Europe
- Asia Pacific: China, Japan, South Korea, India, Australia, Southeast Asia, Rest of Asia Pacific
- Latin America: Brazil, Argentina, Rest of Latin America
- Middle East: GCC Countries, Israel, Turkey, Rest of Middle East
- Africa: South Africa, Egypt, Rest of Africa
Regional Analysis:
North America
The North America Global Exhibition Organization Market size was valued at USD 11,735.38 million in 2018 to USD 18,876.26 million in 2024 and is anticipated to reach USD 34,960.77 million by 2032, at a CAGR of 7.5% during the forecast period. North America holds a market share of approximately 43.8% in 2024. The region leads due to a strong corporate culture, advanced infrastructure, and consistent investments in large-scale trade events. The United States remains the central hub for technology, manufacturing, and healthcare exhibitions. It benefits from a well-established ecosystem of venue operators, sponsors, and media networks. Canada and Mexico are emerging participants with growing business tourism and international event hosting. Major cities such as Las Vegas, Chicago, and Toronto continue to attract global exhibitions. High exhibitor participation and advanced event technology enhance regional competitiveness and sustainability.
Europe
The Europe Global Exhibition Organization Market size was valued at USD 7,615.84 million in 2018 to USD 11,935.15 million in 2024 and is anticipated to reach USD 20,767.15 million by 2032, at a CAGR of 6.6% during the forecast period. Europe accounts for a market share of around 27.6% in 2024. The region benefits from established exhibition venues, international trade events, and a long tradition of industry fairs. Germany, the UK, France, and Italy dominate due to their robust manufacturing and trade networks. It supports global collaboration through renowned fairs such as Hannover Messe and Paris Air Show. Strong government support for business tourism enhances the region’s event ecosystem. European companies also focus on sustainability and digital integration in exhibition operations. The increasing use of hybrid formats strengthens participant engagement across borders.
Asia Pacific
The Asia Pacific Global Exhibition Organization Market size was valued at USD 5,089.15 million in 2018 to USD 8,968.30 million in 2024 and is anticipated to reach USD 18,771.40 million by 2032, at a CAGR of 9.1% during the forecast period. Asia Pacific represents a market share of approximately 20.7% in 2024. Rapid industrialization, trade liberalization, and infrastructure expansion are driving exhibition activities in China, India, Japan, and South Korea. The region benefits from government-led trade promotion initiatives and rapid digital adoption. It attracts global exhibitors seeking access to fast-growing consumer and industrial markets. Singapore, Shanghai, and Mumbai are key hubs for international conventions. The rise of technology-focused expos and startup events boosts participation from SMEs. Asia Pacific continues to lead in virtual and hybrid event adoption, enhancing regional competitiveness.
Latin America
The Latin America Global Exhibition Organization Market size was valued at USD 1,176.48 million in 2018 to USD 1,886.63 million in 2024 and is anticipated to reach USD 3,056.72 million by 2032, at a CAGR of 5.7% during the forecast period. Latin America contributes about 4.4% to the global market in 2024. Brazil and Mexico are key drivers with growing interest in consumer goods and industrial exhibitions. The region is witnessing expansion in trade shows related to agriculture, renewable energy, and manufacturing. It benefits from rising cross-border partnerships and investment-driven infrastructure upgrades. Local governments support exhibitions to attract foreign business and tourism. Event organizers face challenges from currency fluctuations but continue to invest in hybrid event formats. It enhances connectivity between regional and global participants, improving the long-term growth outlook.
Middle East
The Middle East Global Exhibition Organization Market size was valued at USD 615.01 million in 2018 to USD 895.49 million in 2024 and is anticipated to reach USD 1,334.64 million by 2032, at a CAGR of 4.5% during the forecast period. The region holds a market share of approximately 2.1% in 2024. Growth is supported by rising demand for international trade shows in the UAE, Saudi Arabia, and Qatar. It benefits from economic diversification strategies and rising investments in tourism and business services. Dubai and Riyadh host world-class exhibitions across construction, healthcare, and technology sectors. Regional event organizers focus on promoting MICE (Meetings, Incentives, Conferences, Exhibitions) tourism. Infrastructure projects such as Expo City Dubai enhance event hosting capabilities. Strategic partnerships with global exhibition companies expand regional market visibility and capacity.
Africa
The Africa Global Exhibition Organization Market size was valued at USD 364.87 million in 2018 to USD 663.05 million in 2024 and is anticipated to reach USD 946.85 million by 2032, at a CAGR of 4.0% during the forecast period. Africa accounts for a market share of around 1.5% in 2024. Growth is primarily concentrated in South Africa, Nigeria, and Egypt, driven by emerging trade corridors and government incentives. It gains momentum from investment in convention centers and logistics networks. Local industries participate actively in trade events promoting agriculture, energy, and consumer goods. Challenges remain due to limited infrastructure and high operational costs. Global players are entering partnerships to strengthen local exhibition capabilities. Rising regional integration under the African Continental Free Trade Area supports future market expansion.
Shape Your Report to Specific Countries or Regions & Enjoy 30% Off!
Key Player Analysis:
- Informa PLC
- Reed Exhibitions (RX Global)
- GL Events
- Messe Frankfurt GmbH
- MCI Group
- Easyfairs Group
- ITE Group PLC
- Emerald Expositions Events, Inc.
- Kenes Group
- UBM
Competitive Analysis:
The Global Exhibition Organization Market is characterized by the presence of global leaders and regional players competing through innovation, partnerships, and large-scale event portfolios. Leading companies such as Informa PLC, Reed Exhibitions, Messe Frankfurt, and GL Events dominate through extensive venue networks and specialized event categories. It focuses on technology-driven formats, sustainability, and enhanced exhibitor engagement. Emerging companies strengthen their regional positions through strategic collaborations and tailored event experiences. The market remains moderately consolidated, with continuous investment in hybrid platforms and data-driven attendee analytics defining competitive differentiation.
Recent Developments:
- July 2025, Informa published its half-year results, highlighting strong growth across Live B2B Events and Academic Markets, with underlying revenue up mid-single digits and upgraded guidance for the full year, reflecting strategic portfolio expansion and higher visibility into forward bookings.
- March 2025, RX Global released a comprehensive look at Event Operations for 2025, highlighting AI-enabled efficiency, weather resilience, sustainability, and inclusive planning as core themes shaping the year’s events across regions.
- March 2025, Emerald Expositions announced acquisitions related to expanding its global experiential and luxury travel event footprint, reinforcing its growth in B2B events across new verticals.
- May 2025, Informa extended a strategic partnership in Monaco through Top Marques, signaling ongoing collaboration with prestige automotive/luxury sectors to enhance high-end event offerings.
Report Coverage:
The research report offers an in-depth analysis based on Format Segment and Service Category Segment. It details leading market players, providing an overview of their business, product offerings, investments, revenue streams, and key applications. Additionally, the report includes insights into the competitive environment, SWOT analysis, current market trends, as well as the primary drivers and constraints. Furthermore, it discusses various factors that have driven market expansion in recent years. The report also explores market dynamics, regulatory scenarios, and technological advancements that are shaping the industry. It assesses the impact of external factors and global economic changes on market growth. Lastly, it provides strategic recommendations for new entrants and established companies to navigate the complexities of the market.
Future Outlook:
- Hybrid exhibitions will dominate due to flexibility and global reach.
- Event digitalization will improve operational efficiency and engagement.
- Asia Pacific will emerge as the fastest-growing regional market.
- Sustainability practices will influence venue and supplier selection.
- Data analytics will drive exhibitor performance optimization.
- Government trade initiatives will strengthen global participation.
- Corporate spending on live events will rebound post-pandemic.
- Virtual reality and AI tools will enhance attendee experience.
- Consolidation among global organizers will increase market power.
- New infrastructure investments will expand exhibition hosting capacity.


