Market Overview:
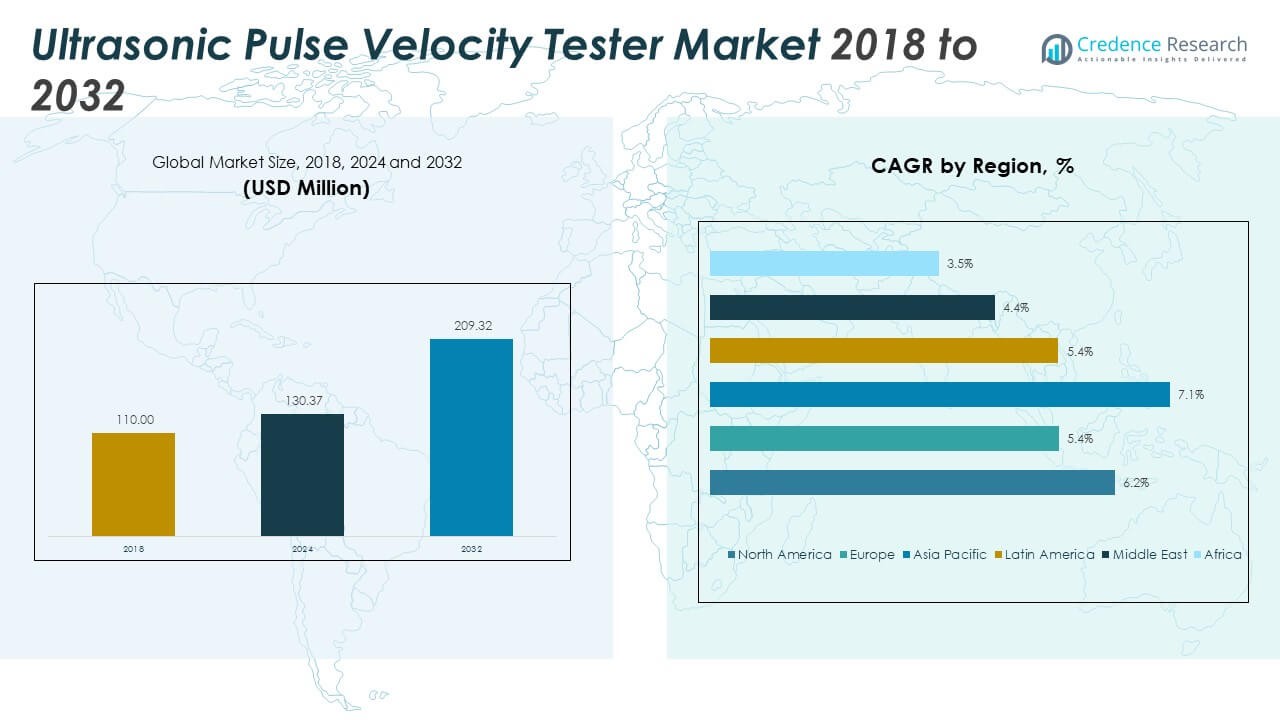
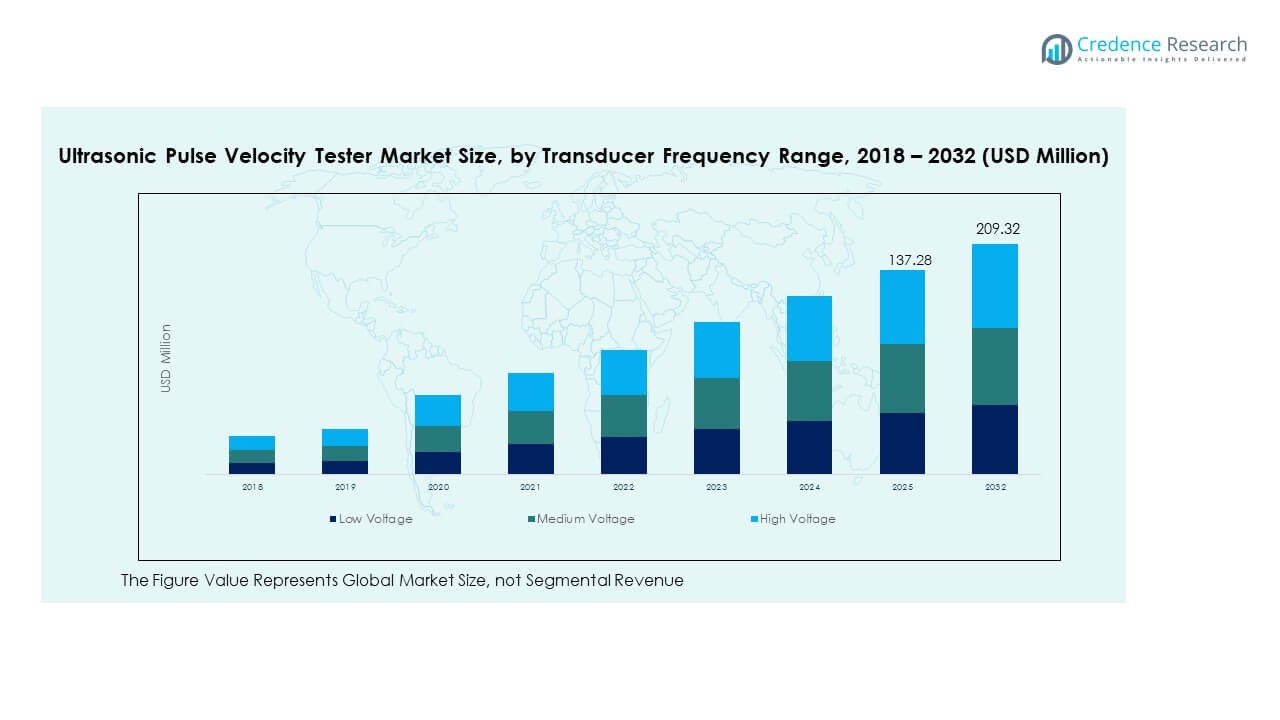
The Ultrasonic Pulse Velocity Tester Market size was valued at USD 110.00 million in 2018 to USD 130.37 million in 2024 and is anticipated to reach USD 209.32 million by 2032, at a CAGR of 6.21% during the forecast period.
| REPORT ATTRIBUTE |
DETAILS |
| Historical Period |
2020-2023 |
| Base Year |
2024 |
| Forecast Period |
2025-2032 |
| Ultrasonic Pulse Velocity Tester Market Size 2024 |
USD 130.37 Million |
| Ultrasonic Pulse Velocity Tester Market, CAGR |
6.21% |
| Ultrasonic Pulse Velocity Tester Market Size 2032 |
USD 209.32 Million |
Growth in the market is driven by increasing adoption of non-destructive testing methods in construction, infrastructure, and research sectors. Ultrasonic pulse velocity testers play a vital role in evaluating concrete quality, detecting internal flaws, and ensuring long-term structural safety. The growing preference for digital and wireless testing devices enhances operational convenience and accuracy. Rising demand for quality assurance in large-scale projects and advancements in portable technologies continue to strengthen market performance globally.
Asia-Pacific dominates the market due to rapid urbanization, extensive infrastructure projects, and government-led modernization programs. North America and Europe follow, supported by strict construction quality standards and technological innovations in testing equipment. Emerging regions such as Latin America and the Middle East show potential growth with ongoing urban infrastructure expansion and increased emphasis on safety compliance in construction practices.
Access crucial information at unmatched prices!
Request your sample report today & start making informed decisions powered by Credence Research Inc.!
Download Sample
Market Insights:
- The Ultrasonic Pulse Velocity Tester Market was valued at USD 110.00 million in 2018, grew to USD 130.37 million in 2024, and is projected to reach USD 209.32 million by 2032, registering a 6.21% CAGR.
- Asia Pacific leads with a 36% share, driven by rapid urbanization and large-scale infrastructure investments across China, India, and Southeast Asia.
- North America holds 27% of the market, supported by advanced construction testing regulations and strong technological adoption, followed by Europe with 22% share due to strict quality standards.
- Asia Pacific is the fastest-growing region, fueled by government-funded smart city projects, research advancements, and expanding construction activities.
- Segment distribution shows low-frequency transducers accounting for 42% of demand, medium-frequency units 33%, and high-frequency models 25%, reflecting balanced adoption across structural and research applications.
Market Drivers
Rising Emphasis on Infrastructure Quality and Safety Testing
Governments and construction firms are prioritizing quality assurance to prevent structural failures. The demand for reliable tools to assess concrete uniformity and detect internal flaws continues to expand. The Ultrasonic Pulse Velocity Tester Market benefits from strict compliance norms in public infrastructure projects. Engineers prefer these devices for their accuracy and non-destructive nature. The growing focus on preventive maintenance supports their adoption across highways, bridges, and tunnels. The technology helps determine material homogeneity and detect voids effectively. Expanding urbanization across developing economies creates consistent testing needs. The overall emphasis on structural longevity sustains equipment demand globally.
- For instance, Screening Eagle Technologies’ Pundit PD8000 and PD8050 products are documented to offer wireless inspection solutions with multi-channel ultrasonic pulse echo technology, enabling engineers to detect internal concrete defects with high precision in real-world infrastructure settings.
Growing Integration of Digital Technologies and Smart Features
Digital transformation is reshaping conventional testing equipment toward intelligent systems. Manufacturers are embedding data analytics, wireless connectivity, and cloud-based storage for seamless monitoring. The market is progressing toward IoT-enabled testers that provide real-time data access for quality evaluation. It allows engineers to analyze and document results with improved traceability. Remote control capabilities enhance operational flexibility in field applications. Demand for intuitive interfaces and instant reporting features is increasing. Integration with smart infrastructure projects further drives usage. These innovations are redefining how testing professionals assess concrete integrity.
Expanding Construction and Rehabilitation Activities Worldwide
Large-scale infrastructure renewal projects in developed regions are propelling testing demand. Governments are investing in road expansions, metro systems, and smart city development. The Ultrasonic Pulse Velocity Tester Market finds strong growth in concrete-intensive projects. It provides engineers a non-invasive solution to assess existing structures for safety. The method ensures accurate detection of cracks, honeycombs, and weak zones. Growing replacement of aging infrastructure supports adoption across industrial and residential sectors. Contractors are deploying these devices to meet regulatory quality requirements. Rising public-private investments sustain consistent market momentum worldwide.
R&D Investments Driving Accuracy and Device Innovation
Manufacturers are channeling resources into improving transducer design and testing accuracy. Research initiatives focus on multi-frequency pulse analysis and portable calibration tools. Enhanced data acquisition speed and digital signal processing strengthen performance reliability. The integration of high-resolution sensors provides better diagnostic results. It helps reduce the margin of error during in-situ testing. Compact and battery-efficient models improve field usability for engineers. Companies are competing to introduce advanced handheld testers with faster result delivery. Continuous innovation ensures a strong competitive edge across product portfolios.
- For instance, James Instruments is a well-documented manufacturer specializing in non-destructive ultrasonic testers like the V-Meter MK IV system. Their product specifications show high-resolution sensor arrays and digital signal processing, supporting traceable inspection and rapid report creation for concrete evaluation; these features are detailed in official manufacturer documentation.
Market Trends
Shift Toward Wireless and Cloud-Connected Testing Platforms
The demand for connected testing systems is accelerating across construction inspection workflows. Cloud-enabled devices allow engineers to store and retrieve field data remotely. The Ultrasonic Pulse Velocity Tester Market is witnessing upgrades that enable automated synchronization and analysis. It supports project traceability by integrating test logs with centralized platforms. Wireless testing enhances operational speed and minimizes human errors. Remote collaboration among engineers and laboratories strengthens decision-making. The shift toward digitized workflows is increasing efficiency in real-time evaluations. Continuous improvements in data management ensure reliable performance consistency.
Adoption of AI and Predictive Maintenance Capabilities in Testing Equipment
AI-driven algorithms are gaining traction in non-destructive testing processes. The technology helps identify micro-defects invisible through traditional methods. It enables pattern recognition in pulse velocity readings to predict material degradation. The integration of AI enhances data accuracy and test reliability. The market benefits from faster diagnostic cycles and automated interpretation. It reduces manual intervention while improving result precision. Manufacturers are integrating self-calibration systems powered by AI tools. The trend indicates a long-term shift toward intelligent infrastructure inspection.
- For instance, Evident Corporation, formerly Olympus NDT, designs high-precision ultrasonic testing systems that detect sub-millimeter cracks and material flaws with advanced imaging and analysis software. These systems enhance inspection accuracy and speed across construction and industrial non-destructive evaluation applications.
Rising Focus on Sustainable and Eco-Friendly Construction Practices
Green construction trends are influencing testing standards across the industry. Engineers are selecting tools that align with sustainability and minimal material wastage. The Ultrasonic Pulse Velocity Tester Market aligns with these practices by offering non-invasive testing. It ensures concrete durability without causing physical damage or resource loss. Global initiatives promoting energy-efficient buildings strengthen its relevance. The equipment supports lifecycle analysis of concrete structures. Increased focus on minimizing rework costs adds to adoption growth. Sustainability-linked certifications are further shaping demand in this segment.
- For instance, Humboldt Manufacturing’s ultrasonic pulse velocity testers are employed in the U.S. for LEED-compliant, non-destructive evaluation and enable long-term monitoring of concrete durability to support zero-waste audits and green building certification, as evidenced by product use cases and industry publications.
Increasing Demand for Multi-Function and Portable Testing Solutions
Contractors prefer compact, multi-purpose tools for field testing operations. Manufacturers are designing dual-mode testers that combine ultrasonic and rebound hammer capabilities. The trend highlights an industry shift toward multifunctional solutions. It helps engineers perform multiple tests without carrying multiple instruments. Lightweight designs and rechargeable power systems improve portability. Demand is rising for rugged and weather-resistant models suitable for outdoor projects. Enhanced mobility drives use in remote or high-altitude infrastructure inspections. Portability now defines a key product differentiation factor in the market.
Market Challenges Analysis
High Equipment Cost and Limited Awareness in Developing Regions
Advanced non-destructive testing systems involve high procurement and maintenance costs. Many small contractors still rely on traditional methods due to budget constraints. The Ultrasonic Pulse Velocity Tester Market faces resistance from cost-sensitive end users. It often limits large-scale deployment across emerging economies. Lack of awareness regarding testing accuracy and long-term benefits slows adoption. Limited availability of trained operators creates further operational gaps. It restricts efficient use in rural or small-scale construction projects. Manufacturers face challenges in balancing affordability with performance excellence.
Technical Complexity and Inconsistent Testing Standardization
Complex calibration and interpretation procedures demand skilled personnel for accurate operation. Differences in regional testing standards lead to inconsistency in data evaluation. The market encounters obstacles in harmonizing global testing protocols. Variations in concrete composition influence test outcomes, requiring expert judgment. It becomes difficult for engineers to achieve uniform measurements across conditions. Environmental factors such as moisture and temperature can distort pulse readings. Manufacturers must develop adaptive calibration systems to overcome this limitation. Lack of unified regulations hampers product standardization and industry interoperability.
Market Opportunity
Growing Adoption in Infrastructure Modernization and Retrofitting Projects
Expanding investments in infrastructure renewal and retrofitting projects create strong business potential. The Ultrasonic Pulse Velocity Tester Market is gaining prominence for assessing structural soundness in aging constructions. It assists in identifying cracks and material weaknesses without causing damage. Governments are emphasizing sustainable restoration over complete reconstruction. Equipment capable of precise data capture enhances decision-making in structural repairs. The growing need for asset life extension across bridges and dams sustains long-term demand. Integration with smart infrastructure monitoring systems amplifies its future adoption. Continuous advancements in user-friendly designs improve field deployment efficiency.
Emergence of Automation and Remote Testing Capabilities
Automation is creating opportunities for faster and safer testing operations. Robotic and drone-assisted testing units are under development for complex site environments. It allows engineers to access challenging locations while maintaining high accuracy. Integration with remote sensing devices ensures minimal human intervention. The market benefits from reduced downtime and improved safety outcomes. Adoption of software-driven automation is transforming inspection workflows. AI-backed automated analysis helps standardize testing procedures across projects. Growing collaboration between hardware developers and software innovators strengthens market potential.
Market Segmentation Analysis:
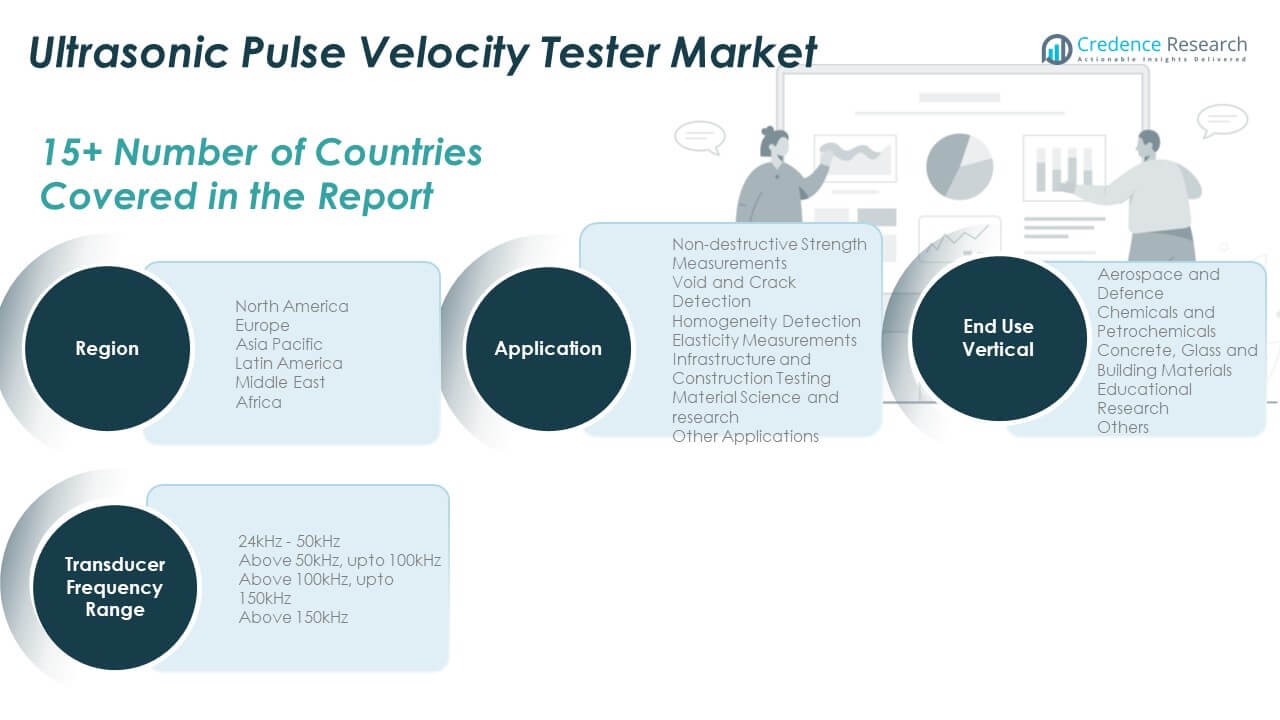
The Ultrasonic Pulse Velocity Tester Market is segmented by transducer frequency range, application, and end use vertical, reflecting the industry’s technical and operational diversity.
By transducer frequency range, devices operating between 24kHz–50kHz dominate general concrete testing due to optimal penetration depth. The above 50kHz up to 100kHz range serves laboratory applications requiring higher resolution in smaller samples. Segments above 100kHz up to 150kHz and above 150kHz gain importance for precision engineering and thin material inspections in specialized industries. This range variation enables flexible testing across both dense and porous materials.
- For instance, Waygate Technologies’ Krautkrämer USM 100 ultrasonic flaw detector, launched internationally in September 2021, is engineered for high-resolution defect detection at frequencies well above 100kHz, and is used in weld inspection and material integrity checks for aerospace composites and specialist electronic components.
By application, the market covers non-destructive strength measurements, void and crack detection, and homogeneity detection, which are crucial in structural health assessments. Elasticity measurements and infrastructure and construction testing support durability analysis in civil engineering projects. Material science and research applications strengthen product development in academic and industrial labs. Other applications span quality verification in manufacturing environments where accuracy is critical for compliance. Each segment reflects unique technical requirements driving instrument customization.
By end use vertical, concrete, glass, and building materials lead adoption, driven by global infrastructure development and quality control norms. Aerospace and defence utilize advanced testers for material certification and stress analysis. Chemicals and petrochemicals apply ultrasonic velocity testing to ensure structural stability of storage units and processing facilities. Educational research institutions continue integrating testing systems for applied learning and laboratory experiments. The inclusion of other industrial users highlights broader adoption beyond traditional construction applications.
- For instance, Hilti’s PS 300 Ferroscan system is a leading rebar/metal locator for reinforced concrete, offering detection up to 200 mm depth with an accuracy of ±3 mm. Hilti documentation and third-party technical reviews confirm the PS 300 is deployed across tens of thousands of commercial and infrastructure projects, with optimized 2D imaging and digital reporting downloaded into Hilti Profis software for on-site recordkeeping.
Segmentation:
By Transducer Frequency Range
- 24kHz – 50kHz
- Above 50kHz, up to 100kHz
- Above 100kHz, up to 150kHz
- Above 150kHz
By Application
- Non-destructive Strength Measurements
- Void and Crack Detection
- Homogeneity Detection
- Elasticity Measurements
- Infrastructure and Construction Testing
- Material Science and Research
- Other Applications
By End Use Vertical
- Aerospace and Defence
- Chemicals and Petrochemicals
- Concrete, Glass, and Building Materials
- Educational Research
- Others
By Region
- North America
- Europe
- Germany
- France
- U.K.
- Italy
- Spain
- Rest of Europe
- Asia Pacific
- China
- Japan
- India
- South Korea
- South-east Asia
- Rest of Asia Pacific
- Latin America
- Brazil
- Argentina
- Rest of Latin America
- Middle East & Africa
- GCC Countries
- South Africa
- Rest of the Middle East and Africa
Regional Analysis:
North America
The North America Ultrasonic Pulse Velocity Tester Market size was valued at USD 29.15 million in 2018 to USD 33.97 million in 2024 and is anticipated to reach USD 54.44 million by 2032, at a CAGR of 6.2% during the forecast period. North America holds a 27% market share driven by advanced construction standards and robust infrastructure investments. The region emphasizes structural integrity assessment in bridges, tunnels, and transportation networks. The U.S. dominates demand due to strict non-destructive testing regulations and federal infrastructure programs. Canada shows steady growth through modernization of its transportation and energy sectors. The presence of key manufacturers and early adoption of digital inspection technologies strengthen regional competitiveness. It benefits from growing smart city initiatives and sustainable building practices. Expanding renovation projects across public and private sectors continue to stimulate demand.
Europe
The Europe Ultrasonic Pulse Velocity Tester Market size was valued at USD 25.58 million in 2018 to USD 28.98 million in 2024 and is anticipated to reach USD 43.59 million by 2032, at a CAGR of 5.4% during the forecast period. Europe accounts for a 22% market share led by strong compliance with EN and ISO testing standards. The UK, Germany, and France remain key contributors, driven by advanced R&D infrastructure and construction renovation programs. Strict safety regulations encourage the use of ultrasonic testing devices in public infrastructure and energy projects. It is witnessing growing use of portable and wireless testers among civil engineers and researchers. Smart infrastructure projects across Scandinavia and Western Europe expand adoption further. The region benefits from technology integration and sustainability-focused construction policies. The presence of global NDT equipment leaders fosters innovation and localized manufacturing.
Asia Pacific
The Asia Pacific Ultrasonic Pulse Velocity Tester Market size was valued at USD 42.24 million in 2018 to USD 51.48 million in 2024 and is anticipated to reach USD 88.19 million by 2032, at a CAGR of 7.1% during the forecast period. Asia Pacific leads the global market with a 36% share due to rapid infrastructure development in China, India, and Southeast Asia. Government initiatives for smart cities, metro expansion, and industrial corridors boost adoption. It supports major construction and material testing requirements across large-scale urban projects. Demand for high-performance testing equipment grows within educational and research institutions. Japan and South Korea exhibit strong technological integration within non-destructive testing practices. Local manufacturers are expanding through affordable, portable devices tailored for field inspections. Continuous industrialization and housing growth sustain long-term regional momentum.
Latin America
The Latin America Ultrasonic Pulse Velocity Tester Market size was valued at USD 7.81 million in 2018 to USD 9.18 million in 2024 and is anticipated to reach USD 13.79 million by 2032, at a CAGR of 5.4% during the forecast period. Latin America holds a 6% market share driven by rising infrastructure rehabilitation and public works programs. Brazil leads adoption due to extensive road and housing modernization. Mexico and Argentina show steady growth with investments in construction quality assurance. It benefits from the need for cost-efficient non-destructive testing tools across municipal and private projects. Engineering consultancies increasingly adopt portable testers to improve operational efficiency. The region faces moderate adoption challenges due to limited awareness and skilled labor shortages. Expansion of local testing service providers is improving accessibility. Growing construction safety initiatives sustain gradual market expansion.
Middle East
The Middle East Ultrasonic Pulse Velocity Tester Market size was valued at USD 3.18 million in 2018 to USD 3.45 million in 2024 and is anticipated to reach USD 4.82 million by 2032, at a CAGR of 4.4% during the forecast period. The region contributes a 5% share supported by large-scale infrastructure, energy, and urban development projects. Saudi Arabia and the UAE drive demand through smart city and megaproject investments. It is gaining traction in quality inspections for concrete-intensive structures and industrial facilities. Construction of new airports, rail lines, and industrial hubs enhances application opportunities. The presence of international NDT companies supports technological transfer and training. Ongoing diversification of regional economies strengthens infrastructure monitoring needs. The focus on sustainable construction practices increases adoption in premium construction projects. Expansion of local distribution networks enhances accessibility across GCC nations.
Africa
The Africa Ultrasonic Pulse Velocity Tester Market size was valued at USD 2.05 million in 2018 to USD 3.31 million in 2024 and is anticipated to reach USD 4.49 million by 2032, at a CAGR of 3.5% during the forecast period. Africa accounts for a 4% market share, with steady demand growth driven by urban development and infrastructure rehabilitation projects. South Africa dominates regional use through ongoing modernization of transport and energy facilities. Egypt and Nigeria are emerging markets with rising construction safety regulations. It supports project verification needs for roads, bridges, and public utilities. Limited awareness and high equipment costs remain adoption barriers. Regional governments are promoting quality assurance in public construction projects. International collaborations improve access to modern testing technologies. Expanding urbanization and foreign-funded development programs support long-term market potential.
Shape Your Report to Specific Countries or Regions & Enjoy 30% Off!
Key Player Analysis:
Competitive Analysis:
The Ultrasonic Pulse Velocity Tester Market features a moderately consolidated structure with global and regional players competing on technology, product accuracy, and service reliability. Leading companies such as Aimil Ltd., Controls S.p.A., Humboldt Mfg. Co., Proceq Group, and James Instruments Inc. focus on innovation, integrating digital interfaces and wireless connectivity for enhanced testing precision. It emphasizes compact, portable designs with faster data processing to meet on-site testing needs. Firms like Canopus Instruments and Mitech Co., Ltd. expand their regional presence through affordable solutions tailored for developing markets. Partnerships with construction firms and research institutions strengthen market access and brand positioning. Ongoing product advancements, regulatory compliance, and calibration accuracy remain critical competitive factors. Manufacturers are investing in R&D to enhance performance, durability, and user experience, aligning offerings with the evolving demands of infrastructure, research, and material testing industries worldwide.
Report Coverage:
- The research report offers an in-depth analysis based on Transducer Frequency Range, Application and End Use Vertical. It details leading market players, providing an overview of their business, product offerings, investments, revenue streams, and key applications. Additionally, the report includes insights into the competitive environment, SWOT analysis, current market trends, as well as the primary drivers and constraints. Furthermore, it discusses various factors that have driven market expansion in recent years. The report also explores market dynamics, regulatory scenarios, and technological advancements that are shaping the industry. It assesses the impact of external factors and global economic changes on market growth. Lastly, it provides strategic recommendations for new entrants and established companies to navigate the complexities of the market.
Future Outlook:
- Growing integration of AI-driven analysis and predictive algorithms will enhance testing precision and efficiency.
- Expansion of infrastructure modernization and urban redevelopment programs will increase equipment demand worldwide.
- Rising investments in smart city and sustainable construction projects will strengthen adoption across public sectors.
- Advancements in portable and wireless ultrasonic testers will redefine field testing flexibility and reliability.
- Manufacturers will focus on automation and data synchronization to improve operational speed and user convenience.
- Increasing collaboration between research institutions and equipment developers will accelerate product innovation.
- Standardization of global testing protocols will support product interoperability and market consistency.
- Demand from aerospace, petrochemical, and educational sectors will continue to diversify market applications.
- Rapid technological progress in digital signal processing will boost accuracy in complex material assessments.
- Growing awareness of non-destructive testing benefits will expand market reach across emerging economies.


