Connected Tire Market: USD 233.5 million in 2025, a Fleet Data Business Before a Car Feature
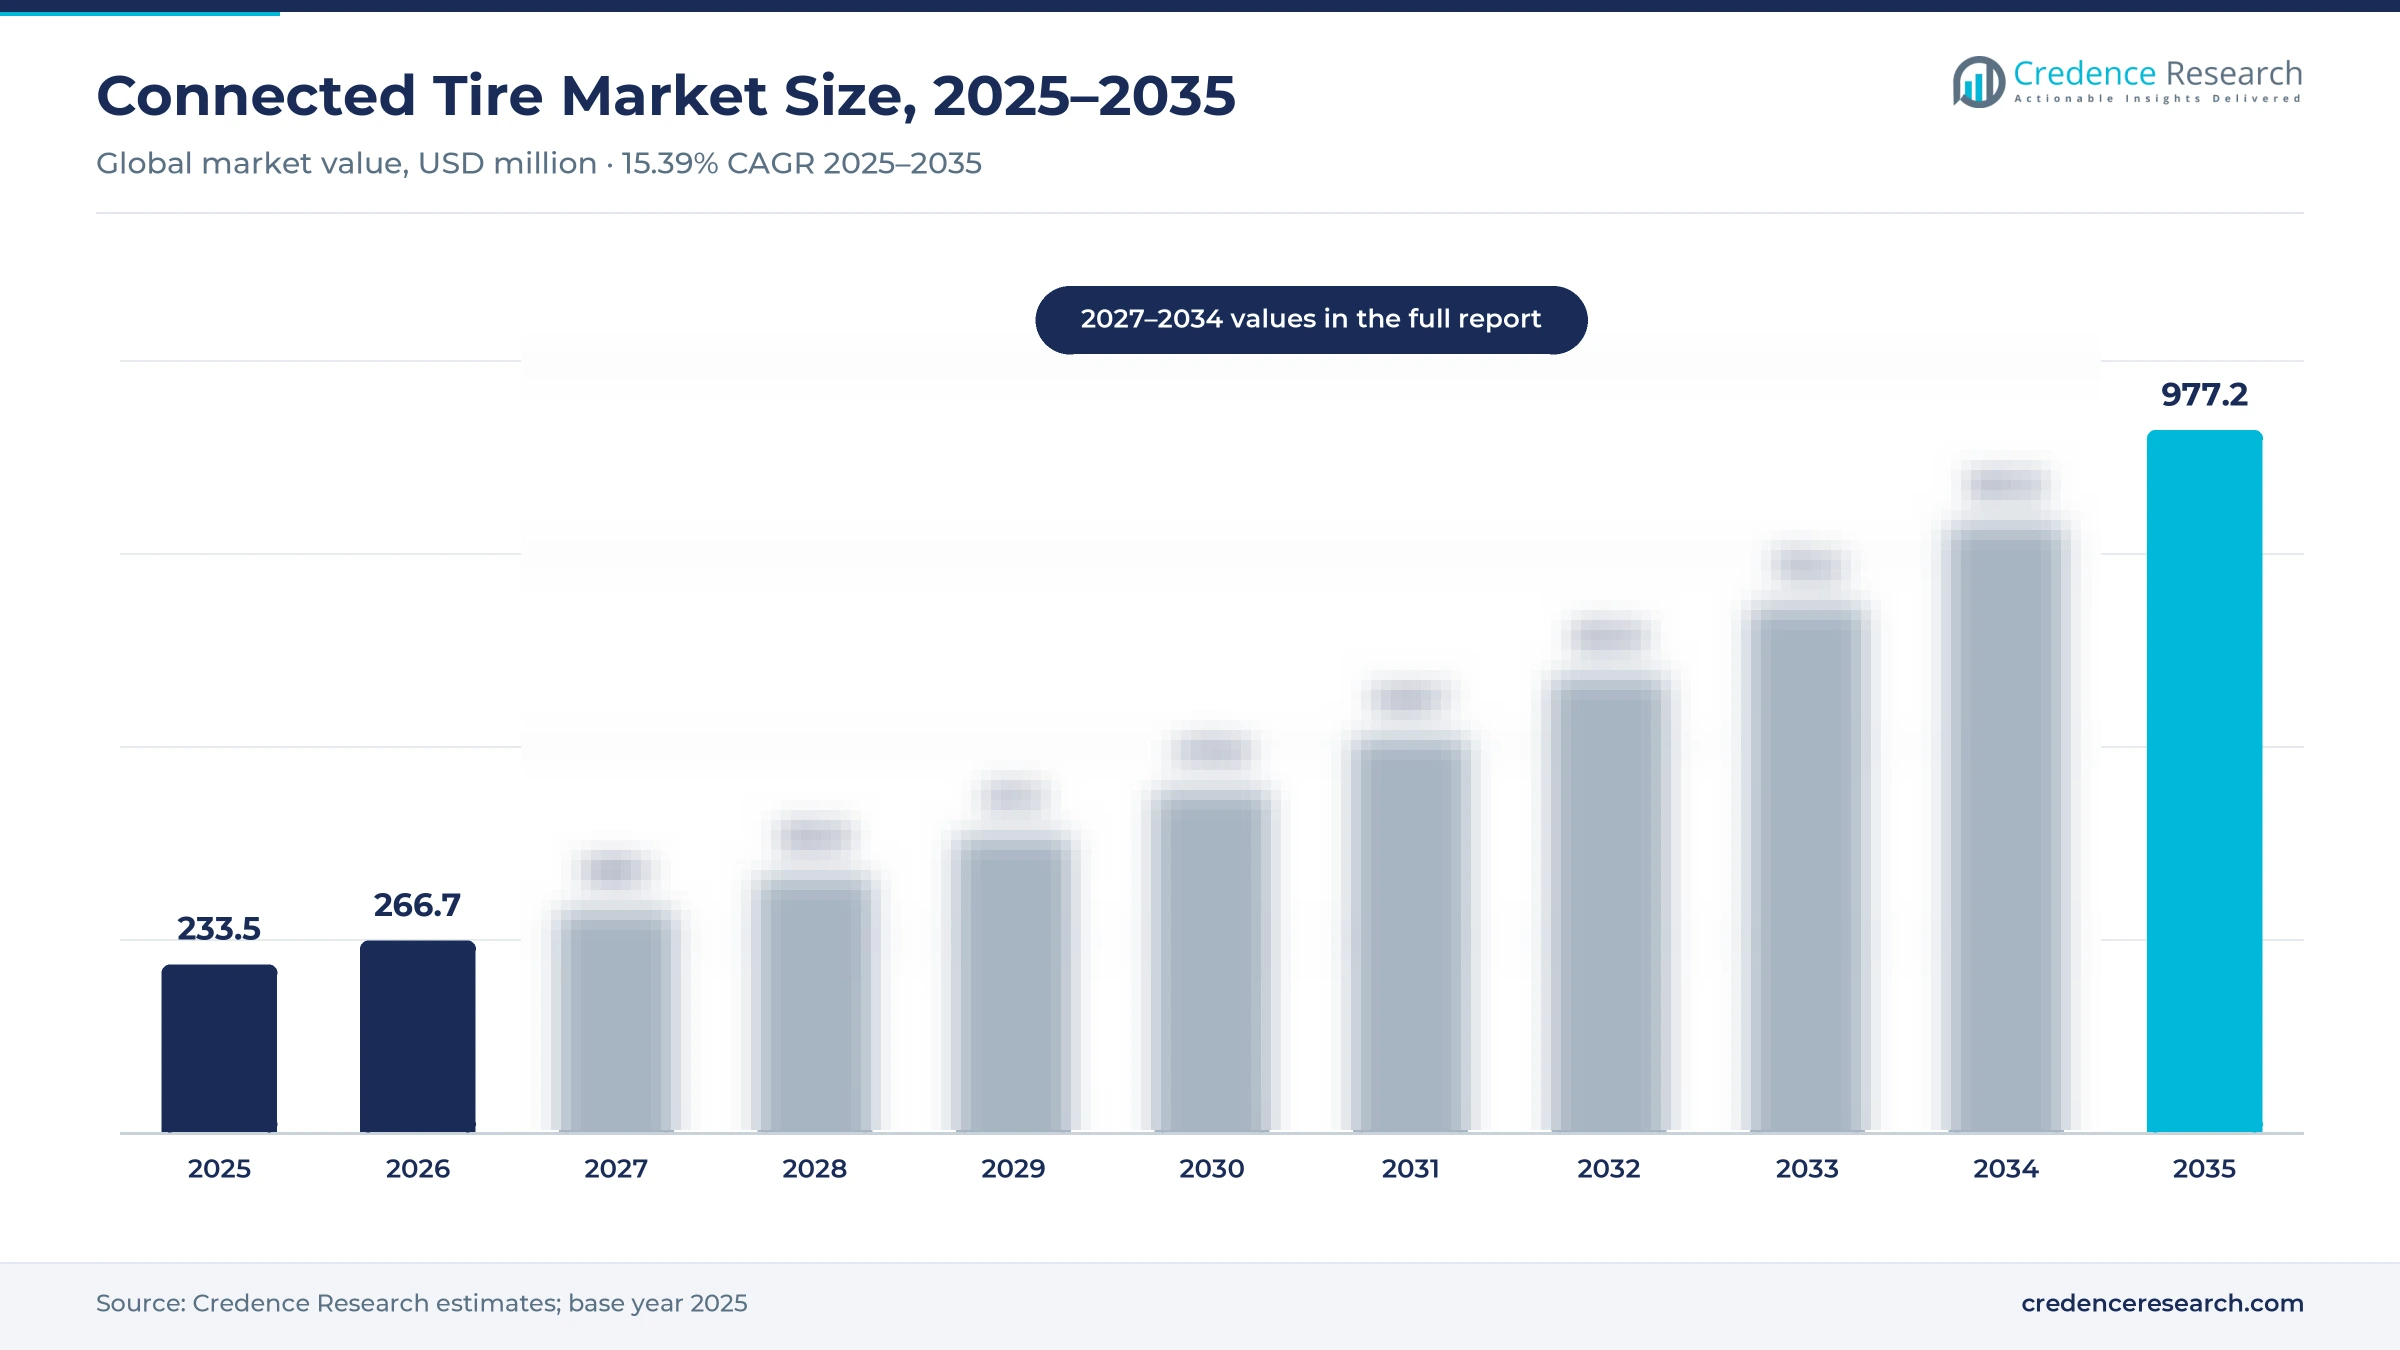
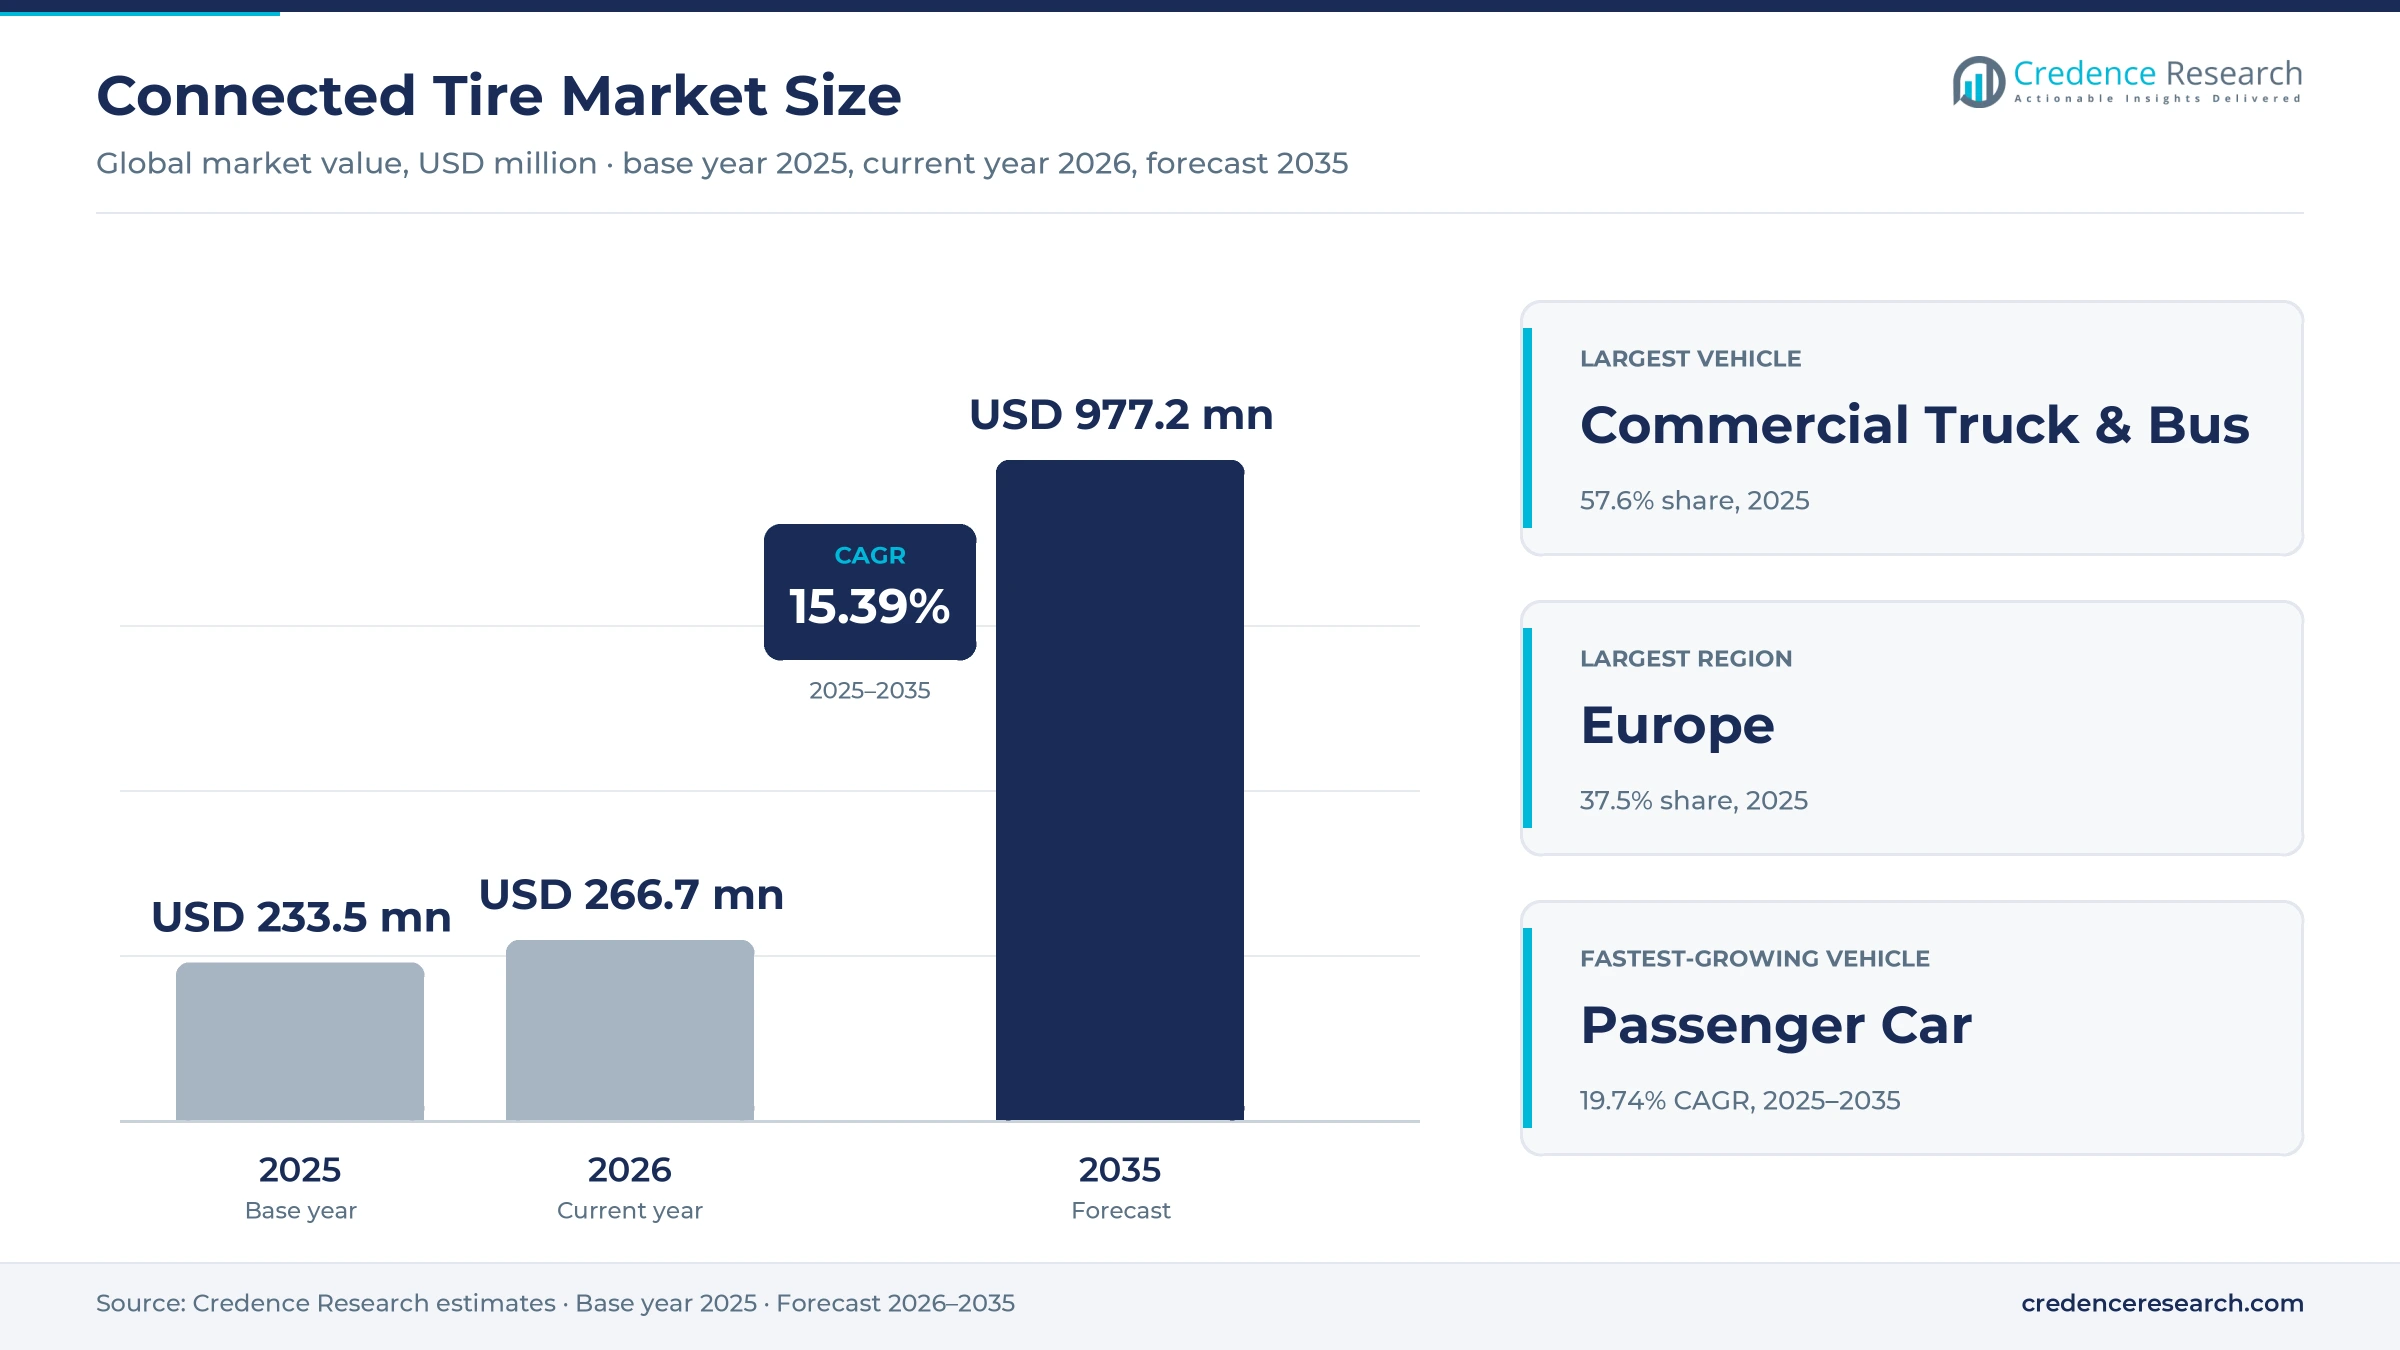
The global connected tire market, counted as the sensing, tagging and data value added to tires, was worth USD 233.5 million in 2025, and we forecast it to reach USD 977.2 million by 2035, a CAGR of 15.39% over 2025–2035. Truck and bus fleets paying to avoid roadside failures buy most of it, and we put the market at USD 266.7 million in 2026, the current year.
These are our own estimates. We built them vehicle by vehicle from the bottom up, valuing the sensing hardware, the identification tags and the software sold on top, and then checked the total against what the major tire makers disclose about their tire-intelligence programs. No other published market study went into the numbers.
Our central view: a connected tire earns money for the person who pays for the downtime. Truck and bus fleets lose revenue every hour a vehicle stands at the roadside, so they buy sensors and monitoring subscriptions first. Car buyers do not yet pay separately for tire data, which keeps the passenger segment small but fast-growing.
What do we count as a connected tire?
We count the intelligence added to the tire, not the tire itself. That means three things, all valued at the price paid by the fleet, vehicle maker or tire maker:
- Tire-mounted sensors: sensors bonded to the inner liner or built into the tire that read pressure, temperature, load or wear, a 43.0% share in 2025.
- Embedded RFID tags: passive identification tags moulded into or patched onto the tire, giving each casing a readable digital identity, a 21.9% share.
- Software and analytics services: tire-management platforms, alerting, predictive maintenance and road-condition data sold as subscriptions or licences, a 35.1% share.
We leave out three things:
- Valve-stem and rim-band pressure sensors fitted to meet tire pressure monitoring rules. Those are mandatory vehicle equipment, bought by every car maker for compliance, and sit in our tire pressure monitoring systems study.
- Indirect pressure monitoring that infers inflation from ABS wheel-speed signals, with no hardware in or on the tire.
- The value of the tire carcass and tread, which our smart tire study counts in full.
Why separate connected tires from mandatory TPMS?
Because the buyer and the reason to buy are different. In the United States, FMVSS No. 138 has required a low-pressure warning on passenger cars and light trucks since 1 September 2007, triggered when a tire falls 25% below the recommended cold pressure. A valve-stem sensor does that job well and at the lowest cost. A tire-mounted sensor goes further: it knows which tire it sits in, reads temperature at the casing, and can feed load and wear data to a fleet platform.
Lumping the two together makes the market look both larger and slower than it is. Compliance TPMS is a mature, regulation-paced business. The connected tire is an optional purchase that has to prove its payback, and we size it on that basis.
Report Attributes
| Attribute | Details |
|---|---|
| Market size (2025) | USD 233.5 million |
| Market size (2026) | USD 266.7 million |
| Market size (2035) | USD 977.2 million |
| CAGR (2025–2035) | 15.39% |
| Base year | 2025 |
| Forecast period | 2026–2035 |
| Largest vehicle segment | Commercial Truck & Bus (57.6%) |
| Fastest-growing vehicle segment | Passenger Car (19.74% CAGR) |
| Largest offering | Tire-Mounted Sensors (43.0%) |
| Largest region | Europe (37.5%) |
| Fastest-growing region | Asia Pacific (18.60% CAGR) |
| Segments covered | Vehicle, Offering, Region |
How did we size the market?
We used two independent lenses and kept the estimate only where they agreed:
- Vehicle and offering build. For trucks and buses, passenger cars and off-highway machines we estimated sensor shipments, tagged tires and vehicles on monitoring subscriptions, then applied an average selling price or annual fee to each.
- Supplier check. We compared the total with the tire-intelligence activities that Michelin, Bridgestone, Continental, Goodyear and Pirelli describe in their filings and press releases, and with the RFID and sensor suppliers that sell into tire plants.
The full report sets out the shipments, prices and subscription base behind each segment, region and year.
Connected Tire Market Insights
- The connected tire market was worth USD 233.5 million in 2025 and we forecast USD 977.2 million by 2035, a 15.39% CAGR.
- We estimate the market at USD 266.7 million in 2026, the current year.
- Commercial trucks and buses hold a 57.6% share; passenger cars are the fastest-growing vehicle segment at 19.74% a year.
- Tire-mounted sensors lead offerings with 43.0%, while software and analytics grow fastest at 17.50% a year.
- Europe is the largest region at 37.5%; Asia Pacific grows fastest at 18.60% a year.
- Valve-stem TPMS fitted for compliance is excluded; we count only tire-mounted sensing, embedded RFID and tire data services.
Trucks Carry the Revenue, Cars Carry the Growth
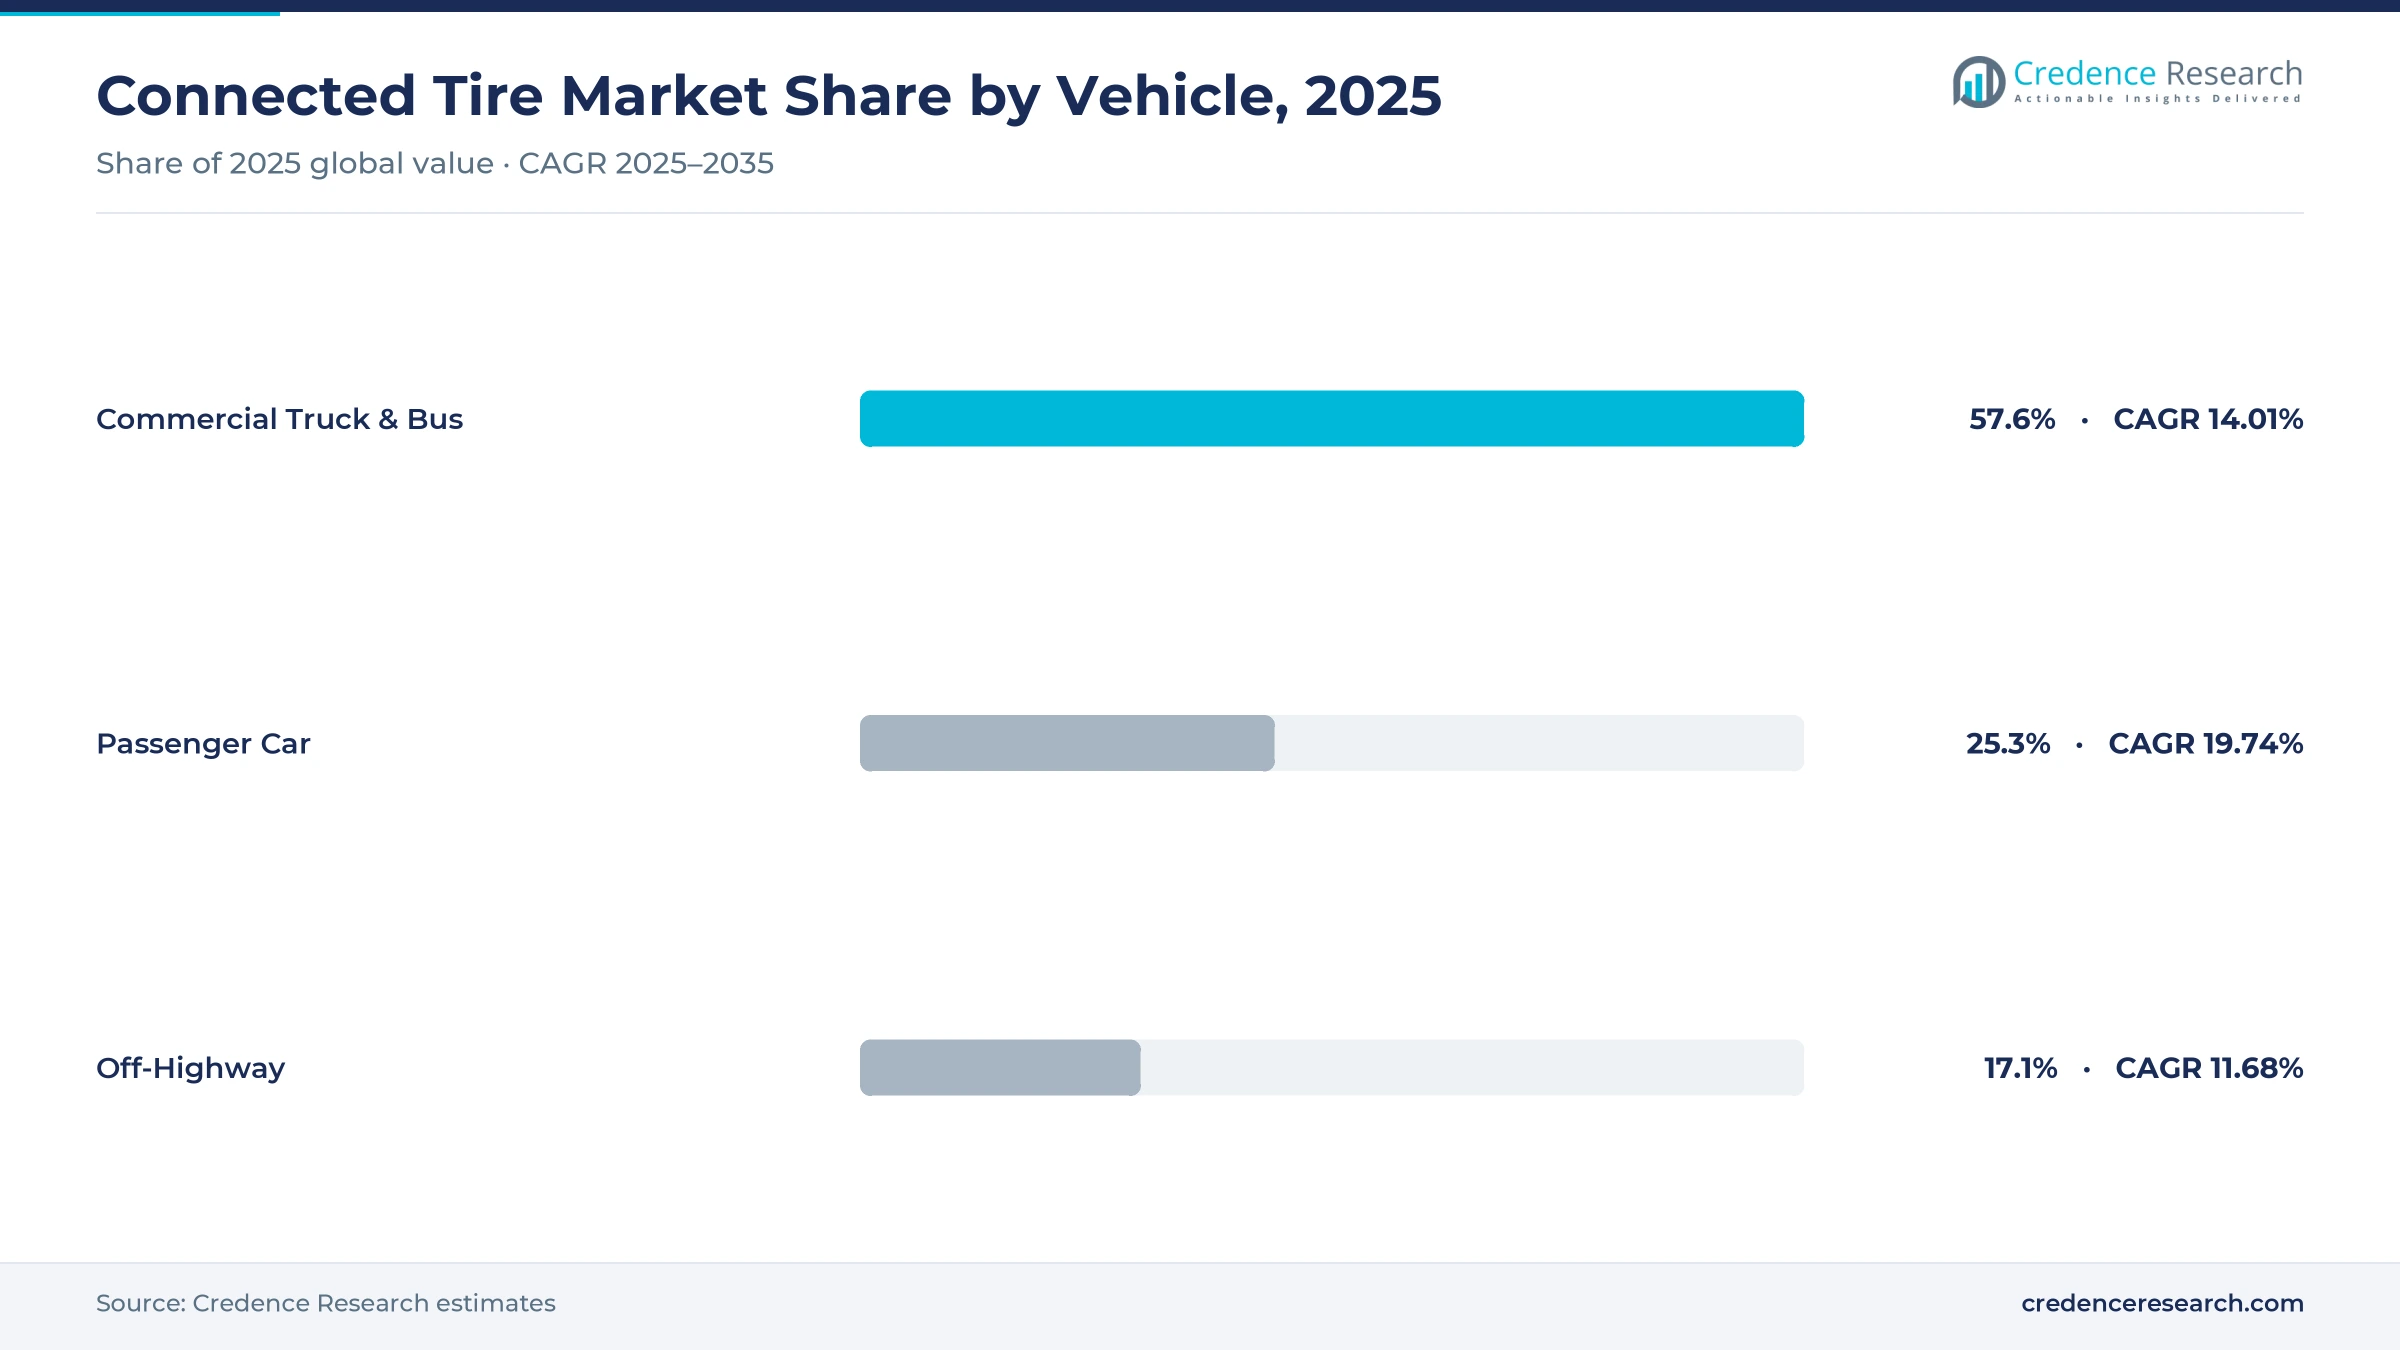
Commercial trucks and buses are the largest vehicle segment with a 57.6% share of 2025 value. Passenger cars are the fastest-growing at 19.74% a year, from a much smaller base.
| Vehicle | Share 2025 | CAGR 2025–2035 |
|---|---|---|
| Commercial Truck & Bus | 57.6% | 14.01% |
| Passenger Car | 25.3% | 19.74% |
| Off-Highway | 17.1% | 11.68% |
Why do commercial trucks and buses lead?
Commercial trucks and buses hold a 57.6% share and grow at 14.01% a year. Fleets have tire managers, repeat buying and a direct cost of downtime, so they buy sensors, tags and subscriptions together. Long-haul and regional transport, city buses and last-mile vans all sit here.
The UK cement and aggregates fleet of Cemex shows the model in practice. In January 2026 Continental reported that ContiConnect sensors in each tire send pressure and temperature data to the cab and to a web platform, with yard reader stations at plant sites and alerts that also help spot brake and wheel-bearing faults.
How fast can passenger cars catch up?
Passenger cars hold a 25.3% share, and they are the fastest-growing segment at 19.74% a year. Most of today's value is RFID moulded into car tires for traceability. Sensor-equipped car tires remain limited to ultra-high-end models such as those fitted with Pirelli's Cyber Tyre, but integration into standard control units opens a wider path.
What makes off-highway different?
Off-highway holds a 17.1% share and grows at 11.68% a year. Mining haul trucks, port handlers, cranes and farm machinery run few but very expensive tires, so value per sensor is the highest in the market. Growth is steadier because the largest mines adopted monitoring years ago.
Which offering earns the most?
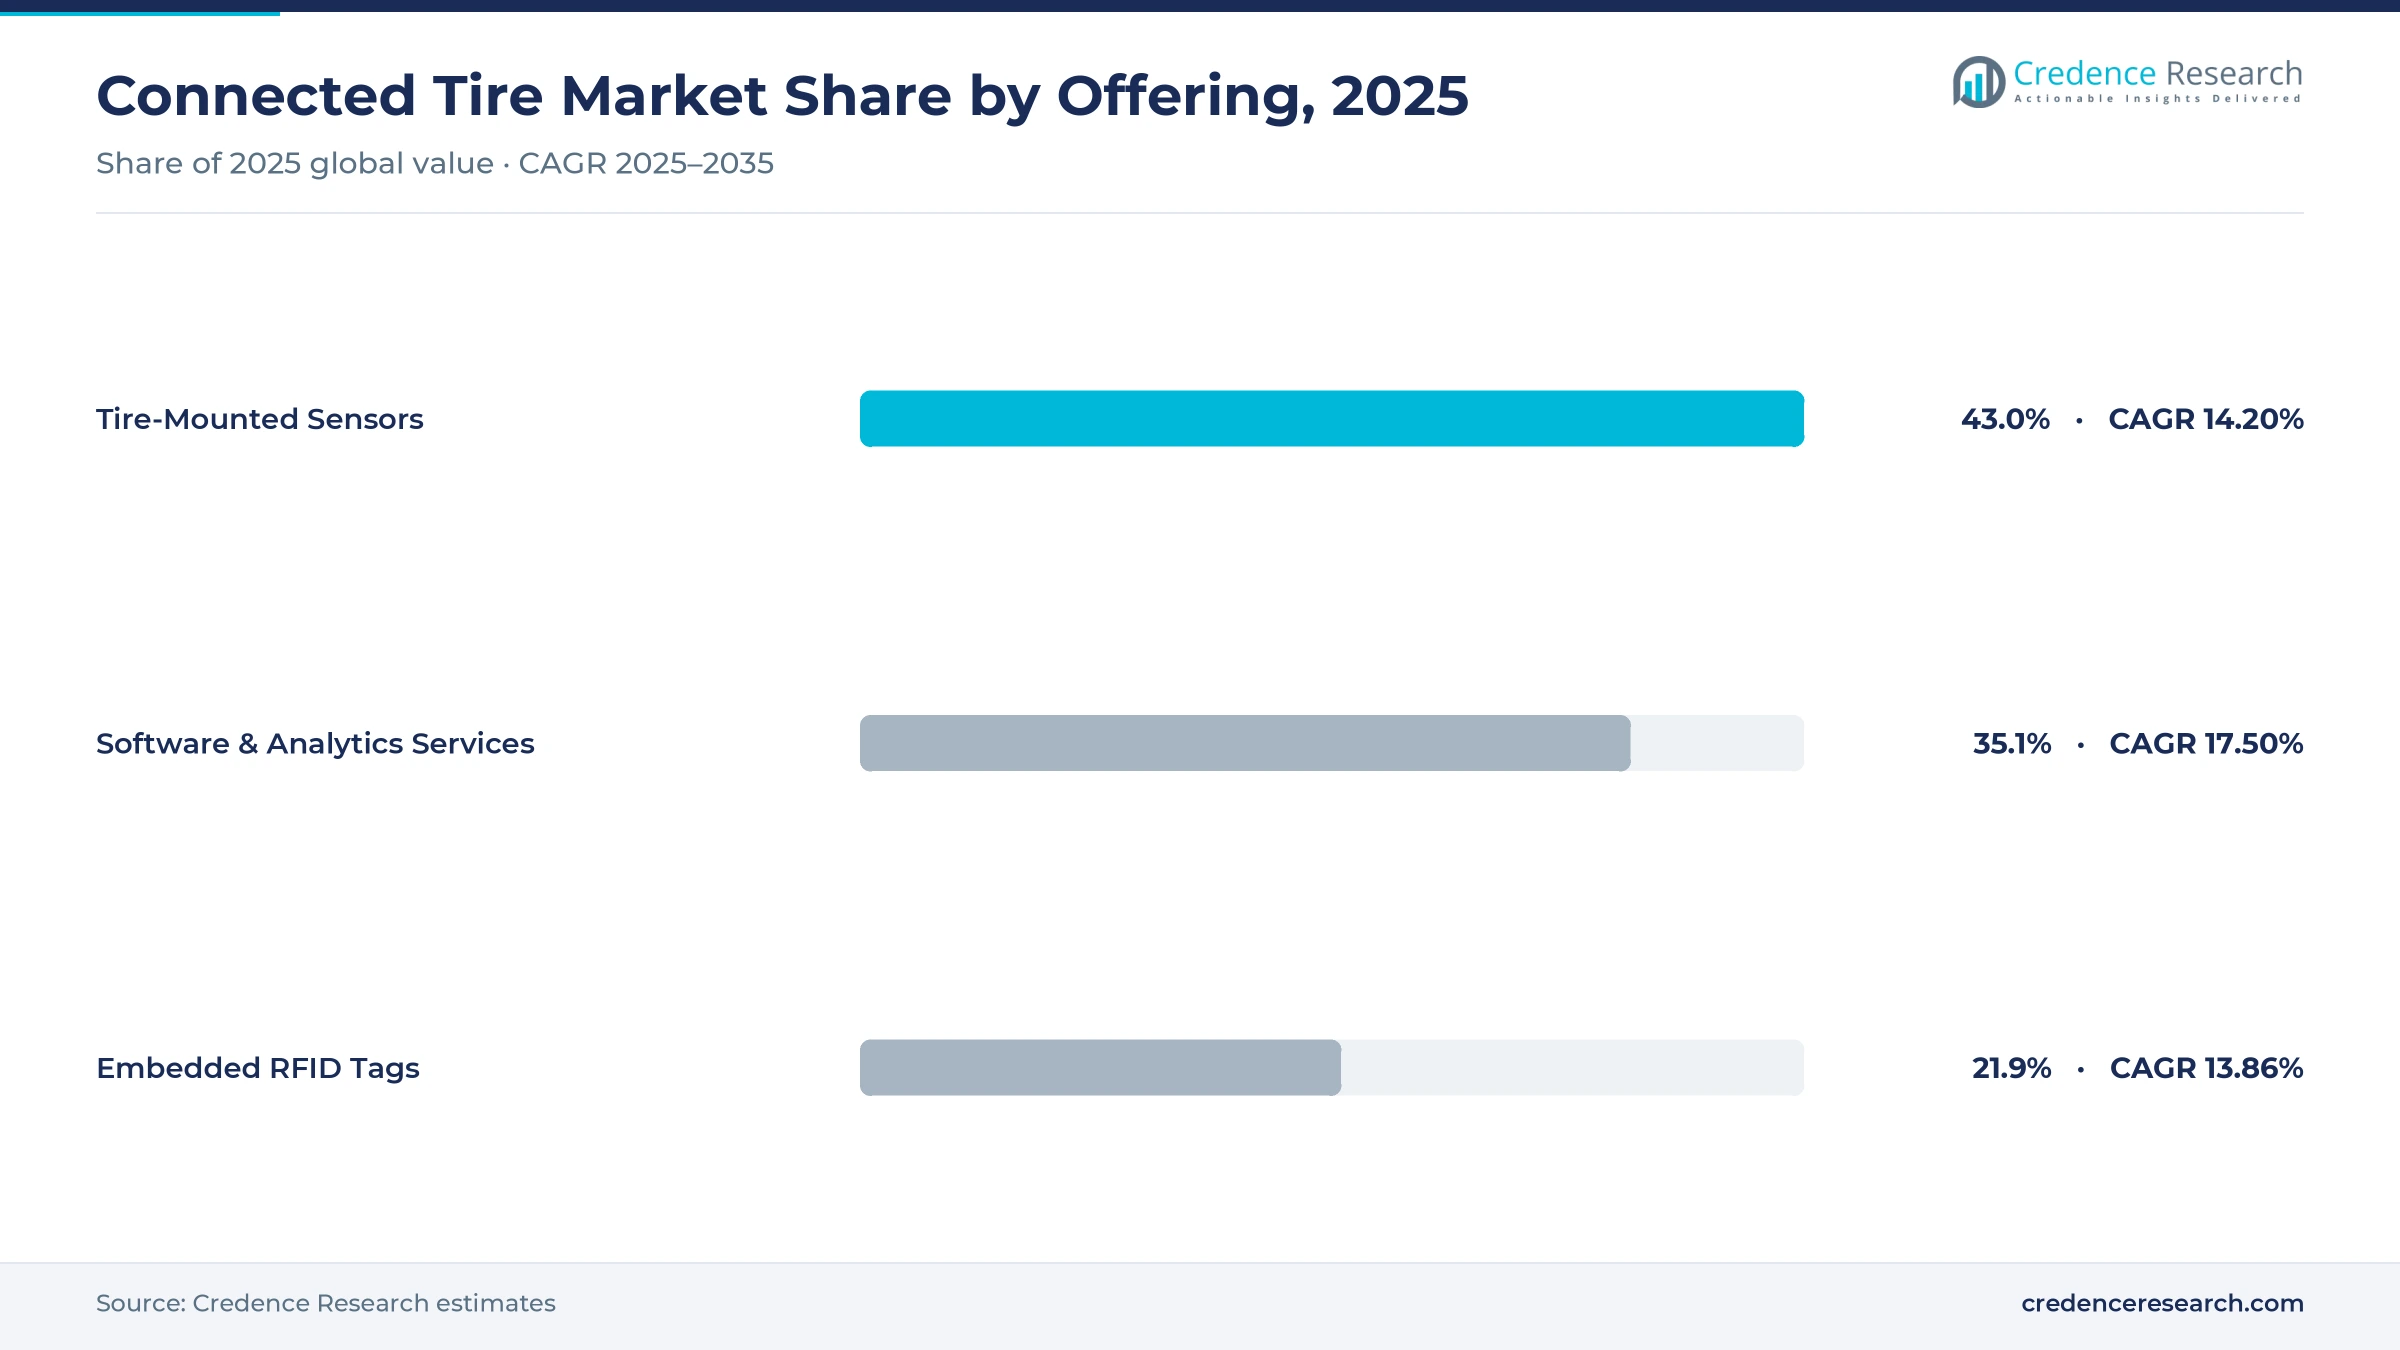
Tire-mounted sensors are the largest offering at 43.0% of 2025 value, ahead of software and analytics services at 35.1% and embedded RFID tags at 21.9%. Software grows fastest at 17.50% a year as subscription bases build.
| Offering | Share 2025 | CAGR 2025–2035 |
|---|---|---|
| Tire-Mounted Sensors | 43.0% | 14.20% |
| Software & Analytics Services | 35.1% | 17.50% |
| Embedded RFID Tags | 21.9% | 13.86% |
Tire-mounted sensors
Tire-mounted sensors hold a 43.0% share and grow at 14.20% a year. Prices fall as volumes rise, which caps value growth even as fitment spreads.
Embedded RFID tags
Embedded RFID tags hold a 21.9% share and grow at 13.86% a year. Each tag is cheap, so the segment depends on breadth of fitment across car and truck tire lines rather than price.
Software and analytics services
Software and analytics services hold a 35.1% share and grow at 17.50% a year, the fastest-growing offering. Fleet subscriptions dominate today; road-condition data and vehicle-maker licences add new streams after 2027.
Request a Free Sample
Fill in your details and we'll send you a free sample report.
- Sample data tables & charts
- Research methodology
Why Fleets Pay for Tire Data: Downtime, Fuel and Casing Life
How much does a tire failure cost a fleet?
More than the tire. A roadside blowout on a loaded truck means a missed delivery window, a service call, sometimes a tow, and a driver who sits idle. Slow leaks do quieter damage: an under-inflated casing runs hot, wears unevenly and loses its value as a retread candidate. Fleets in our fleet management coverage already track engines and drivers in real time; the tire is one of the last major cost items they still check with a gauge.
Tire makers now publish pilot results that make the payback case in plain terms. When Goodyear launched a subscription tires-as-a-service offer in June 2024, it reported nearly 80% fewer emergency breakdown events in a US last-mile delivery pilot and nearly 50% fewer in a European commercial fleet, with fuel use up to 4% lower. Continental says optimised pressure can cut fuel consumption by up to 2% and continuous monitoring can extend tire life by up to 20%. We treat these as vendor claims, but buyers act on them.
Why are subscriptions growing faster than sensors?
Sensors are a one-off sale; the data platform is paid every month. As the installed base of sensor-equipped tires grows, recurring software revenue compounds on top of it. Software and analytics services hold a 35.1% share today and grow at 17.50% a year, the fastest of the three offerings. In our view the tire makers want exactly that shift, because it ties a fleet to one supplier's platform for the life of the contract.
Michelin makes the ambition explicit. Its group strategy sets a target of 15% annual growth by 2030 for its connected solutions business, which includes the fleet telematics brand Michelin Connected Fleet.
How does regulation help, even though we exclude compliance TPMS?
Regulation widens the habit of monitoring. Under the EU General Safety Regulation, tire pressure monitoring under UN Regulation No 141 now reaches buses, heavy trucks and heavy trailers (categories M2, M3, N2, N3, O3 and O4), not only cars. A fleet that must fit some form of TPMS anyway faces a smaller step up to tire-mounted sensors that also report temperature and identify each casing. We count only that step up, not the base compliance hardware.
Why do driver-assistance systems want tire data?
Braking and stability systems work better when they know the grip available at the contact patch. Goodyear and TNO showed in January 2025 that feeding SightLine tire data into automatic emergency braking let the system brake earlier on wet roads. NHTSA's light-vehicle AEB rule, published in May 2024, sets a 2029 compliance date, which gives car makers a reason to test tire-road friction inputs now. Pirelli is working with Bosch to embed Cyber Tyre data directly in Bosch vehicle control units, so car makers would no longer need a dedicated integration project for each model.
From Pressure Alerts to Road Intelligence: Where Tire Sensing Is Heading
We track four trends that are changing what a tire sensor is for and who pays for its data. Each shows up in tire makers' launches and regulators' texts from 2024 to 2026.
Trend 1: Sensors are moving from the valve into the casing
The clearest trend is the shift of the sensor into the tire itself, led by fleets and premium cars. A sensor bonded inside the tire stays with the casing through rotation, retreading and resale, and it reads the tire rather than the wheel. Continental's DockMaster Radial port tire, shown at TOC Europe in May 2026, carries an integrated sensor for temperature and inflation pressure. Tire-mounted sensors hold a 43.0% share of 2025 value and grow at 14.20% a year.
Trend 2: The tire is becoming a road-condition sensor
A second trend turns tire data into road data. In September 2026 Pirelli signed an agreement with the Arma dei Carabinieri to test Cyber Tyre on patrol cars in Rome, combining tire data with camera data to map road surface defects and signage problems. Pirelli has run similar projects with Movyon, part of the Autostrade per l'Italia group, and with the Apulia region. Road operators, not drivers, become the paying customer.
Trend 3: Sensors are being bundled into tires-as-a-service
Tire makers are shifting from selling tires to selling kilometres. Selling a tire per kilometre or per month only works if the supplier can see how each tire is used. Goodyear bundles tire intelligence, round-the-clock monitoring and Aperia's Halo automatic inflator into its subscription offer. Michelin cites the continued growth of tire-as-a-service in Europe and the United States in its 2025 universal registration document. We expect most new fleet contracts in Europe to include some connected element by the early 2030s.
Trend 4: Digital product passports are making RFID standard
The fourth trend is regulatory. The EU Ecodesign for Sustainable Products Regulation, adopted on 13 June 2024, names tyres among the first product groups to prioritise and links each digital product passport to a unique product identifier. An RFID tag moulded into the tire is the most practical carrier for that identity. Embedded RFID tags hold a 21.9% share and grow at 13.86% a year, and our RFID tags study tracks the wider tag supply base.
What Slows Adoption: Payback Proof, Data Ownership and Security Rules
Why is the payback hard to prove for small fleets?
The savings are real but spread thin: a little less fuel, a few avoided breakdowns, a longer casing life. A fleet with a handful of trucks and no tire manager rarely measures any of them. Continental answers with ContiConnect Lite, an app-based entry tier that needs no yard infrastructure, alongside a Pro tier for large fleets. Price tiers help, yet in our view small-fleet adoption stays slow until sensors come factory-fitted in the tire.
Who owns the tire data?
The fleet, the truck maker, the telematics provider and the tire maker all want it. Truck makers increasingly control access to vehicle data through their own gateways, while tire makers want direct access to sell services. Without clear contracts, fleets end up paying twice, once to the tire supplier and again to the telematics platform.
Can connected-vehicle security rules block a tire?
The question has already been tested. Pirelli's September 2026 investor release states that it obtained authorization from the US Bureau of Industry and Security to market the Cyber Tyre system in the United States, and ties that step to governance changes. A tire that talks to the vehicle and the cloud is treated as connected-vehicle hardware, and ownership questions can delay its launch in a market.
Where the Next Revenue Pools Sit for Tire Intelligence
Can tire data be sold to road authorities?
Yes. Geo-located grip, roughness and pothole data from ordinary vehicles costs far less to collect than dedicated survey vans. Pirelli's road-mapping pilots in Italy point to a public-sector buyer that pays per kilometre of network monitored.
Will car makers buy tire data as a feature?
Pirelli's 2025 annual report says Aston Martin will integrate Cyber Tyre into future models from 2027 and that other premium agreements are being finalised. If control-unit integration through Bosch works, the passenger segment can move from a handful of supercars to mainstream premium models within the forecast period.
Is retreading the hidden prize?
A casing with a full digital history of pressure, temperature and load is a better retread candidate, and it is easier to prove so. In our view RFID plus sensor history will become a pricing input in the truck and bus tire retread trade.
Europe Leads on Fleet Services, Asia Pacific Builds the Next Base
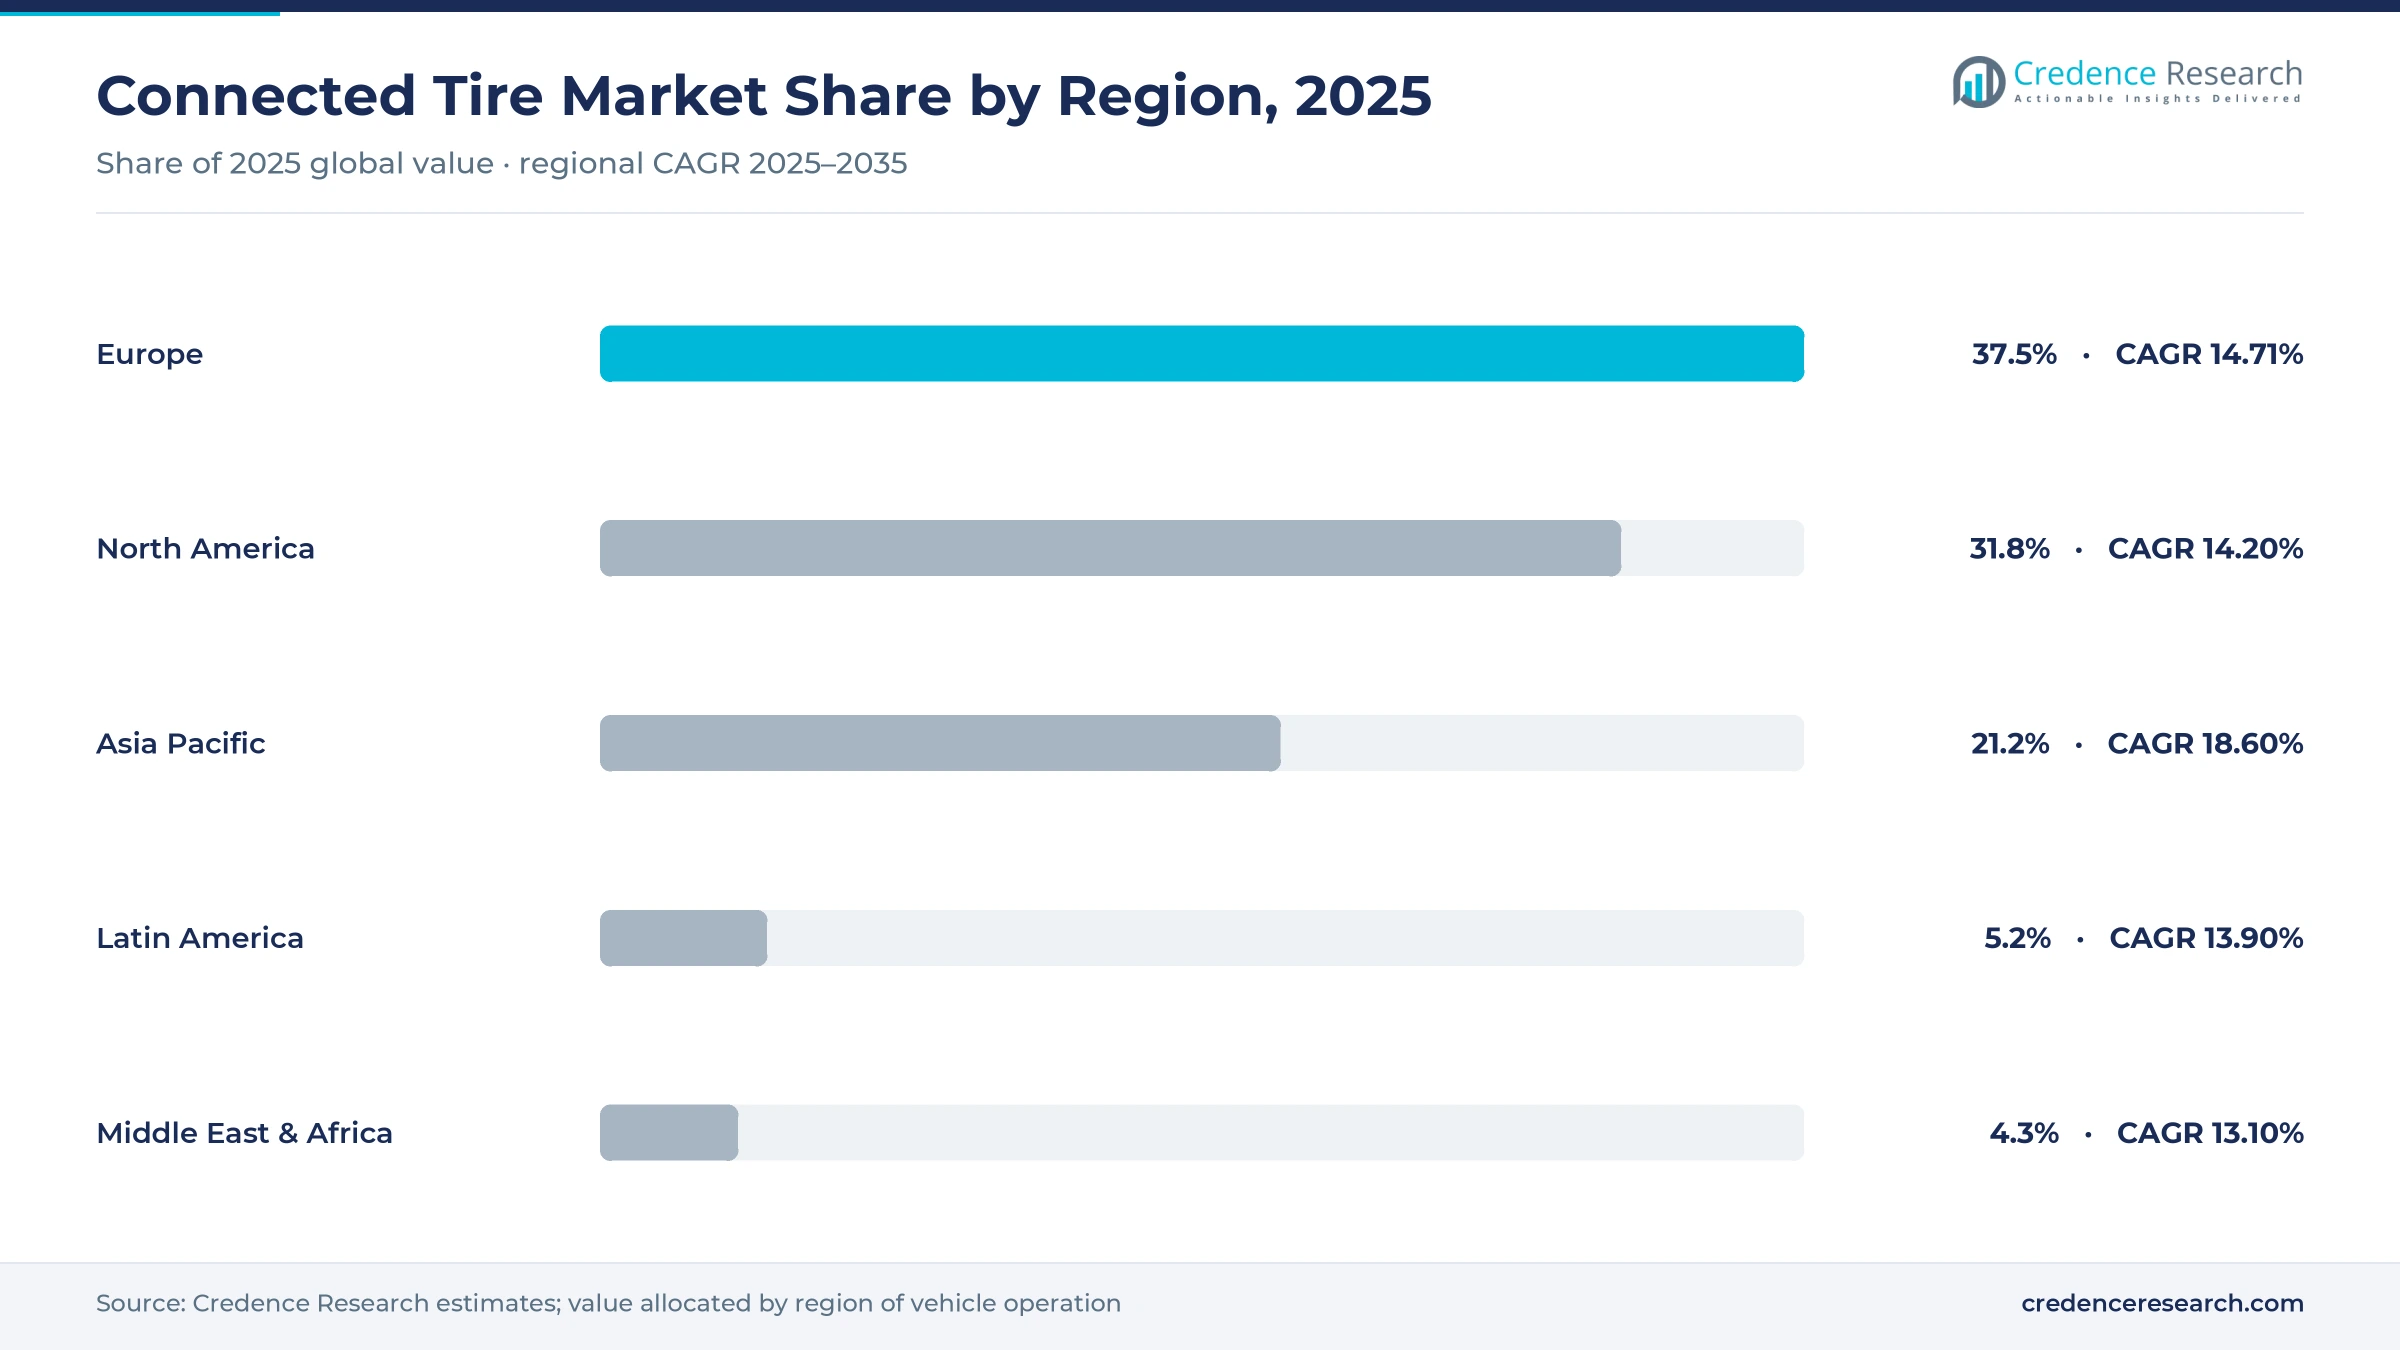
Tire intelligence follows organised fleets and the tire makers' home markets. Europe and North America together account for more than two-thirds of 2025 value, while Asia Pacific is the fastest-growing region at 18.60% a year.
| Region | Share 2025 | CAGR 2025–2035 |
|---|---|---|
| Europe | 37.5% | 14.71% |
| North America | 31.8% | 14.20% |
| Asia Pacific | 21.2% | 18.60% |
| Latin America | 5.2% | 13.90% |
| Middle East & Africa | 4.3% | 13.10% |
Europe
Europe holds a 37.5% share of 2025 value and grows at 14.71% a year. Michelin, Continental and Pirelli are all headquartered here, cross-border haulage rewards uptime, and the EU's heavy-vehicle tire pressure rules and product passport plans push fleets toward digital tire records.
North America
North America holds a 31.8% share and grows at 14.20% a year. Long-haul trucking, large last-mile delivery fleets and tires-as-a-service offers drive demand. Goodyear's SightLine work with autonomous trucking and its fleet subscription programs are centred on the United States.
Asia Pacific
Asia Pacific holds a 21.2% share and is the fastest-growing region at 18.60% a year. Japanese and Korean tire makers are developing sensing, Australian mines are long-standing users of off-highway monitoring, and Chinese logistics fleets are moving from basic TPMS to managed tire services.
Latin America
Latin America holds a 5.2% share and grows at 13.90% a year. Brazilian trucking and Chilean and Peruvian copper mines are the main buyers; Bridgestone applied its Tirematics fleet solution to bus rapid transit in Rio de Janeiro as early as 2016.
Middle East & Africa
Middle East & Africa holds a 4.3% share and grows at 13.10% a year. Mining in southern Africa and Gulf logistics and port fleets account for most demand, where heat makes tire temperature monitoring especially valuable.
Sensor Launches, Fleet Rollouts and Rule Changes, 2024–2026
| Date | Development | Why it matters |
|---|---|---|
| September 2026 | Pirelli's board approved in 2026 a US investment plan for its Rome, Georgia plant that includes Cyber Tyre production, and reported US BIS authorization to market the Cyber Tyre system. | Opens the largest premium car market to Pirelli's connected tire. |
| September 2026 | Pirelli and the Arma dei Carabinieri signed an agreement in 2026 to test Cyber Tyre on patrol cars in Rome for road-condition mapping. | Shows public authorities as buyers of tire data. |
| September 2026 | Bridgestone launched the VHS3 crane tire in 2026, with launch customer Sarens pairing it with a TPMS solution for real-time pressure and temperature. | Extends monitoring in off-highway lifting fleets. |
| May 2026 | Continental showed the DockMaster Radial port tire with an integrated sensor and ContiConnect Lite and Pro at TOC Europe 2026. | Moves sensors into the tire for port handling equipment. |
| January 2026 | Continental reported in 2026 that Cemex's UK fleet runs ContiConnect sensors in each tire, with yard reader stations at plant sites. | A fleet-wide reference case for in-tire monitoring. |
| January 2025 | Goodyear and TNO demonstrated in 2025 that SightLine tire data lets automatic emergency braking act earlier on wet roads. | Links tire data to mandated safety systems. |
| June 2024 | Goodyear introduced a subscription tires-as-a-service offer in 2024 for US and European fleets, bundling tire intelligence and 24/7 monitoring. | Turns tire data into a recurring service fee. |
| June 2024 | The EU adopted the Ecodesign for Sustainable Products Regulation in 2024, naming tyres as a priority group for product passports. | Favours RFID as the tire's digital identity carrier. |
| May 2024 | NHTSA published its final rule on automatic emergency braking for light vehicles in 2024, with a 2029 compliance date. | Raises the value of tire-road friction data for car makers. |
| January 2024 | TDK and Goodyear announced a collaboration in 2024 to advance tire intelligence technologies. | Brings an electronics supplier into sensor development. |
Need a Custom Version of This Report?
Tailor the scope, geography, or segments to your exact requirements.
- Custom geography or segment scope
- Direct access to our analyst team
Tire Makers Versus Platforms: Who Controls Tire Intelligence
The market is led by the large tire makers, which own the casing, the fitment relationship and increasingly the data platform. Electronics and automotive suppliers provide sensors and integration, and RFID makers supply the tags that go into the mould.
How do the big tire makers position themselves?
- Michelin runs Michelin Connected Fleet, built from Sascar, NexTraq and Masternaut, and states that its connected tire research is already used on premium mass-produced cars.
- Continental sells ContiConnect in Lite and Pro tiers, with in-tire sensors for trucks, buses and port vehicles, and positions it as a white-paper-backed answer to cost pressure in EU logistics.
- Goodyear markets SightLine as its tire intelligence platform for wear, load, inflation and temperature, available for light cargo van fleets, autonomous systems and select original equipment vehicles.
- Bridgestone offers Tirematics pressure and temperature monitoring, CAIS road-surface sensing that classifies roads into seven states, and the Webfleet telematics platform.
- Pirelli sells Cyber Tyre, a hardware and software system already adopted on ultra-high-end car models, and plans Cyber Tyre production at its Rome, Georgia plant in the United States.
Which technology partners matter?
Bosch is the key partner for Pirelli, embedding Cyber Tyre data in vehicle control units. TDK announced a collaboration with Goodyear in January 2024 to advance tire intelligence technologies, and Aperia Technologies supplies the Halo inflator in Goodyear's subscription offer. Sumitomo Rubber Industries and Hankook Tire are developing their own sensing approaches.
How concentrated is the market?
We estimate that the five largest tire makers control well over half of connected tire value, because they decide which tires carry sensors and tags. Independent sensor and analytics firms win where fleets run mixed tire brands. In our view, the balance will tilt further toward the tire makers as RFID becomes standard and sensors move into the mould, but truck makers' control of vehicle data gateways is the main counterweight.
Frequently Asked Questions
How big is the connected tire market?
What is the difference between a connected tire and TPMS?
Which vehicle segment leads the connected tire market?
Which offering grows fastest?
Which region is largest for connected tires?
Who are the main connected tire suppliers?
What holds back connected tire adoption?
How was the connected tire market sized?
Table of Content
Chapter 1 Market Segmentation
- 1.1 Segmentation Framework
- 1.1.1 Product and Service Classification
- 1.1.2 Application and End-Use Classification
- 1.1.3 Technology and Solution Classification
- 1.1.4 Customer and Distribution Channel Classification
- 1.1.5 Geographic Segmentation
- 1.1.6 Market Segment Definitions and Boundaries
- 1.2 By Vehicle
- 1.2.1 Commercial Truck & Bus
- 1.2.2 Passenger Car
- 1.2.3 Off-Highway
- 1.3 By Offering
- 1.3.1 Tire-Mounted Sensors
- 1.3.2 Embedded RFID Tags
- 1.3.3 Software & Analytics Services
Chapter 2 Introduction
- 2.1 Report Objectives and Scope
- 2.2 Product Definition and Industry Terminology
- 2.3 Market Inclusions and Exclusions
- 2.4 Research Process
- 2.4.1 Primary Research and Expert Interviews
- 2.4.2 Secondary Research and Source Review
- 2.4.3 Top-Down and Bottom-Up Estimation
- 2.4.4 Data Triangulation and Verification
- 2.5 Market Size Measurement Basis
- 2.5.1 2025: USD 233.5 million → 2035: USD 977.2 million
- 2.6 Historical and Forecast Reference Periods
- 2.6.1 Historical Period: 2018-2025
- 2.6.2 Base Year: 2025
- 2.6.3 Forecast Period: 2025-2035
- 2.7 Research Assumptions and Limitations
Chapter 3 Executive Summary
- 3.1 Market Snapshot and Key Findings
- 3.2 Base-Year Market Size, 2025
- 3.3 Forecast Market Size, 2035
- 3.4 Revenue and Volume Growth Outlook
- 3.5 Key Demand and Supply Indicators
- 3.6 Leading Market Segments
- 3.7 Fastest-Growing Market Opportunities
- 3.8 Regional Performance Highlights
- 3.9 Technology and Industry Transformation
- 3.10 Competitive Landscape Summary
- 3.11 Analyst View and Strategic Implications
Chapter 4 Global Connected Tire Market Trends and Developments
- 4.1 Historical Industry Development, 2018-2025
- 4.2 Recent Market Trends and Developments
- 4.3 Demand and Customer Behavior Trends
- 4.4 Technology and Product Innovation
- 4.5 Artificial Intelligence, Automation and Digitalization
- 4.6 Local Manufacturing and Supply Chain Realignment
- 4.7 Industry Partnerships, Mergers and Acquisitions
- 4.8 Sustainability and Circular Economy Developments
- 4.9 Government and Private Sector Investment Trends
- 4.10 Emerging Business Models and Commercialization
- 4.11 Industry Developments and Announcements
Chapter 5 Global Connected Tire Market Production, Supply and Demand Analysis
- 5.1 Demand Trend and Consumption Analysis, 2018-2025
- 5.2 Demand Forecast, 2025-2035
- 5.3 Production and Output Trend, 2018-2025
- 5.4 Production and Output Forecast, 2025-2035
- 5.5 Installed Capacity and Capacity Utilization
- 5.6 Company-Wise Production Plants and Statistics
- 5.6.1 Installed Production Capacity
- 5.6.2 Actual Production
- 5.6.3 Planned Capacity and Expansion Targets
- 5.7 Supply Chain Structure and Procurement Trends
- 5.8 Supply-Demand Gap and Bottlenecks
- 5.9 Import Dependence and Sourcing Structure
- 5.10 Contract Manufacturing and Outsourcing
- 5.11 Regional Supply and Demand Concentration
Chapter 6 Global Connected Tire Market Pricing Analysis
- 6.1 Pricing Structure and Measurement
- 6.2 Historical Pricing Trends, 2018-2025
- 6.3 Pricing Outlook, 2025-2035
- 6.4 Average Selling Price and Unit Economics
- 6.5 Pricing by Product and Market Segment
- 6.6 Geographic Pricing Differences
- 6.7 Key Input, Energy, Labor and Logistics Costs
- 6.8 Contract Pricing and Purchasing Models
- 6.9 Pricing Sensitivity and Competitive Positioning
- 6.10 Price, Margin and Profitability Implications
Chapter 7 Global Connected Tire Market Dynamics
- 7.1 Market Growth Drivers
- 7.1.1 Demand-Side Drivers
- 7.1.2 Technology and Innovation Drivers
- 7.1.3 Infrastructure and Investment Drivers
- 7.1.4 Regulatory and Policy Drivers
- 7.2 Market Restraints
- 7.2.1 Cost and Affordability Constraints
- 7.2.2 Technology and Adoption Barriers
- 7.2.3 Supply Chain and Operational Constraints
- 7.3 Market Challenges
- 7.3.1 Competitive Pressure and Margin Erosion
- 7.3.2 Skills, Infrastructure and Implementation Gaps
- 7.4 Emerging Market Opportunities
- 7.5 Market Dynamics Impact and Time-Horizon Assessment
Chapter 8 Global Connected Tire Value Chain Analysis
- 8.1 Industry Value Chain Overview
- 8.2 Upstream Suppliers and Critical Inputs
- 8.3 Technology and Component Providers
- 8.4 Manufacturing or Service Delivery
- 8.5 Distribution, Channel Partners and Integrators
- 8.6 Downstream Applications and End Users
- 8.7 Value Addition and Profit Pools
- 8.8 Vertical Integration and Outsourcing
- 8.9 Supplier Concentration and Risk
- 8.10 Supply Chain Localization and Resilience
Chapter 9 Global Connected Tire Market Regulations and Policies
- 9.1 Relevant Laws, Standards and Compliance Frameworks
- 9.2 Product, Service, Safety and Quality Requirements
- 9.3 Government Policies, Incentives and Subsidies
- 9.4 Imports, Exports and Trade Barriers
- 9.5 Public Procurement and Local Content Requirements
- 9.6 Environmental and Sustainability Compliance
- 9.7 Upcoming Policy Changes and Market Implications
Chapter 10 Global Connected Tire Market Hotspots and Opportunities
- 10.1 Market Opportunity Mapping and Growth Hotspots
- 10.2 High-Growth Applications and Customer Groups
- 10.3 Underserved Markets and White-Space Opportunities
- 10.4 Emerging Technology and Product Opportunities
- 10.5 New Capacity and Investment Hotspots
- 10.6 Market Entry and Expansion Opportunities
- 10.7 Distribution and Partnership Opportunities
- 10.8 Near-Term and Long-Term Commercial Potential
- 10.9 Opportunity Attractiveness and Execution Risks
Chapter 11 Global Connected Tire Market Outlook, 2025-2035
- 11.1 Market Size and Analysis
- 11.1.1 Revenue (Market Measurement: 2025: USD 233.5 million → 2035: USD 977.2 million)
- 11.1.2 Market Volume and Quantity Sold
- 11.1.3 Historical Market Size, 2018-2025
- 11.1.4 Base-Year Market Size, 2025
- 11.2 Market Forecast, 2025-2035
- 11.2.1 Revenue Forecast to 2035
- 11.2.2 Volume Forecast to 2035
- 11.2.3 CAGR and Year-on-Year Growth
- 11.2.4 Incremental Revenue Opportunity
- 11.3 Forecast Assumptions and Scenario Analysis
- 11.3.1 Base-Case Forecast
- 11.3.2 Optimistic and Conservative Scenarios
- 11.3.3 Technology, Pricing and Policy Sensitivities
- 11.4 Market Attractiveness and Growth Outlook
Chapter 12 Global Connected Tire Market Segmentation and Outlook
- 12.1 Segmentation Summary and Market Shares, 2025
- 12.2 Largest and Fastest-Growing Segments
- 12.3 By Vehicle - Market Size and Forecast, 2025-2035
- 12.3.1 Segment Definition and Scope
- 12.3.2 Historical Market Size, 2018-2025
- 12.3.3 Revenue Forecast, 2025-2035
- 12.3.4 Volume Forecast, 2025-2035
- 12.3.5 Base-Year Market Share, 2025
- 12.3.6 Segment CAGR and Growth Drivers
- 12.3.7 Subsegment Market Size and Forecast
- 12.3.7.1 Commercial Truck & Bus
- 12.3.7.2 Passenger Car
- 12.3.7.3 Off-Highway
- 12.3.8 Subsegment Pricing and Adoption Trends
- 12.3.9 Leading Suppliers and Competition
- 12.3.10 Regional Demand and Opportunities
- 12.4 By Offering - Market Size and Forecast, 2025-2035
- 12.4.1 Segment Definition and Scope
- 12.4.2 Historical Market Size, 2018-2025
- 12.4.3 Revenue Forecast, 2025-2035
- 12.4.4 Volume Forecast, 2025-2035
- 12.4.5 Base-Year Market Share, 2025
- 12.4.6 Segment CAGR and Growth Drivers
- 12.4.7 Subsegment Market Size and Forecast
- 12.4.7.1 Tire-Mounted Sensors
- 12.4.7.2 Embedded RFID Tags
- 12.4.7.3 Software & Analytics Services
- 12.4.8 Subsegment Pricing and Adoption Trends
- 12.4.9 Leading Suppliers and Competition
- 12.4.10 Regional Demand and Opportunities
- 12.5 Segment Growth Comparison
- 12.6 Segment Attractiveness and Priority Matrix
Chapter 13 Global Connected Tire Geographic Market Outlook, 2025-2035
- 13.1 Regional Market Size and Share, 2025
- 13.2 Regional Market Forecast, 2025-2035
- 13.3 Regional Pricing, Production and Demand Differences
- 13.4 North America
- 13.4.1 United States
- 13.4.2 Canada
- 13.4.3 Mexico
- 13.5 Europe
- 13.5.1 Germany
- 13.5.2 France
- 13.5.3 Italy
- 13.5.4 United Kingdom
- 13.5.5 Spain
- 13.5.6 Poland
- 13.5.7 Russia
- 13.5.8 Netherlands
- 13.5.9 Belgium
- 13.5.10 Sweden
- 13.5.11 Denmark
- 13.5.12 Norway
- 13.5.13 Rest of Europe
- 13.6 Asia Pacific
- 13.6.1 China
- 13.6.2 India
- 13.6.3 Japan
- 13.6.4 South Korea
- 13.6.5 Thailand
- 13.6.6 Indonesia
- 13.6.7 Vietnam
- 13.6.8 Malaysia
- 13.6.9 Australia
- 13.6.10 Rest of Asia Pacific
- 13.7 Latin America
- 13.7.1 Brazil
- 13.7.2 Argentina
- 13.7.3 Colombia
- 13.7.4 Chile
- 13.7.5 Rest of Latin America
- 13.8 Middle East
- 13.8.1 Saudi Arabia
- 13.8.2 United Arab Emirates
- 13.8.3 Turkey
- 13.8.4 Israel
- 13.8.5 Iran
- 13.8.6 Rest of the Middle East
- 13.9 Africa
- 13.9.1 South Africa
- 13.9.2 Egypt
- 13.9.3 Nigeria
- 13.9.4 Morocco
- 13.9.5 Rest of Africa
- 13.10 Regional Investment, Policy and Supply Chain Differences
- 13.11 Regional Competitive Landscape
- 13.12 Geographic Growth Hotspots
Chapter 14 Global Connected Tire Technology, Innovation and Sustainability Outlook
- 14.1 Technology Landscape and Maturity
- 14.2 Product, Process and Service Innovation
- 14.3 AI, Automation and Digital Tools in the Industry
- 14.4 Technology Adoption and Performance Benchmarking
- 14.5 Innovation Pipeline and R&D Investment
- 14.6 Patent and Intellectual Property Trends
- 14.7 Energy Efficiency and Resource Management
- 14.8 Sustainability, Recycling and Circularity
- 14.9 Technology Roadmap, 2025-2035
- 14.10 Risks of Obsolescence and Technology Substitution
Chapter 15 Global Connected Tire Market Key Strategic Imperatives
- 15.1 Growth and Market Entry Priorities
- 15.2 High-Return Products and Segments
- 15.3 Pricing, Profitability and Cost Optimization
- 15.4 Technology Investment and Product Differentiation
- 15.5 Supply Chain Localization and Resilience
- 15.6 Distribution and Customer Acquisition
- 15.7 Partnership, Acquisition and Capacity Strategy
- 15.8 Regional Expansion Priorities
- 15.9 Short-, Medium- and Long-Term Actions
Chapter 16 Competition Outlook
- 16.1 Industry Competition Characteristics
- 16.2 Market Structure and Concentration
- 16.3 Market Share and Competitive Positioning, 2025
- 16.4 Company-Wise Revenue and Product Benchmarking
- 16.5 Production and Service Capacity Benchmarking
- 16.6 Technology, Pricing and Differentiation
- 16.7 Regional Footprint and Distribution Strength
- 16.8 Mergers, Acquisitions and Strategic Alliances
- 16.9 New Entrants and Competitive Threats
- 16.10 Porter's Five Forces and Industry Attractiveness
- 16.11 Competitive Outlook, 2025-2035
Chapter 17 Company Profiles
- 17.1 Company Coverage and Selection Criteria
- 17.2 Michelin
- 17.2.1 Business Description
- 17.2.2 Company Ownership and Geographic Presence
- 17.2.3 Product and Service Portfolio
- 17.2.4 Manufacturing and Operating Footprint
- 17.2.5 Production Capacity and Expansion Plans
- 17.2.6 Financial Performance and Investment
- 17.2.7 Market Share and Competitive Position
- 17.2.8 Technology and Innovation Capabilities
- 17.2.9 Strategic Alliances or Partnerships
- 17.2.10 Recent Developments
- 17.2.11 Growth Strategy and Outlook
- 17.3 Continental
- 17.4 Goodyear
- 17.5 Bridgestone
- 17.6 Pirelli
- 17.7 Bosch
- 17.8 TDK
- 17.9 Aperia Technologies
- 17.10 Sumitomo Rubber Industries
- 17.11 Hankook Tire
- 17.12 Other Relevant Market Participants
Note: Every listed company is profiled on the structure shown under the first company. The company list is preliminary and may change based on research findings, market developments, data availability and client requirements.
Chapter 18 Disclaimer
- 18.1 Research and Forecast Disclaimer
- 18.2 Data Source and Estimation Limitations
Note: The depth of individual sections depends on data availability for this market. Volume, capacity, trade and other unit-based metrics are included where applicable.