Market Overview
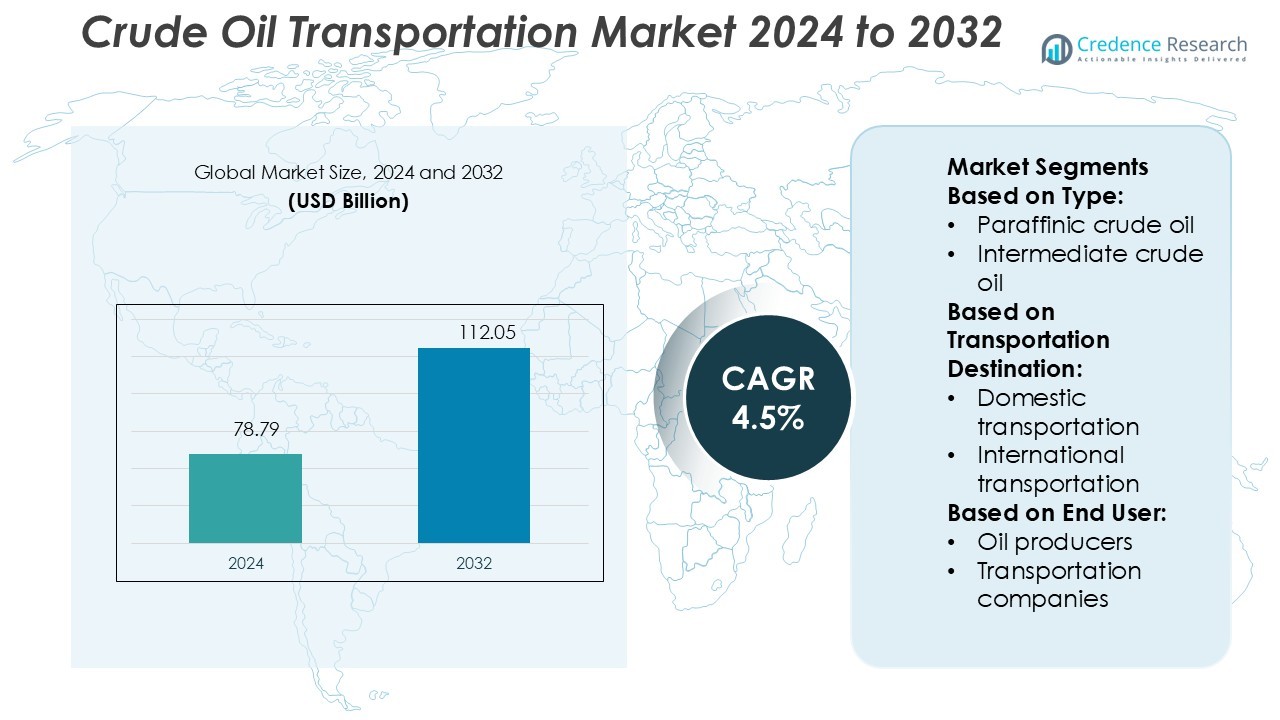
Crude Oil Transportation Market size was valued USD 78.79 billion in 2024 and is anticipated to reach USD 112.05 billion by 2032, at a CAGR of 4.5% during the forecast period.
| REPORT ATTRIBUTE |
DETAILS |
| Historical Period |
2020-2023 |
| Base Year |
2024 |
| Forecast Period |
2025-2032 |
| Crude Oil Transportation Market Size 2024 |
USD 78.79 Billion |
| Crude Oil Transportation Market, CAGR |
4.5% |
| Crude Oil Transportation Market Size 2032 |
USD 112.05 Billion |
The crude oil transportation market is shaped by leading companies such as TotalEnergies SE, ExxonMobil Corporation, Kinder Morgan, BP PLC, Chevron Corporation, Valero Energy, Enbridge, Marathon Petroleum, Royal Dutch Shell, and Saudi Aramco. These players dominate through extensive pipeline networks, advanced shipping fleets, and strategically located storage hubs. They focus on expanding export routes, integrating digital monitoring systems, and improving fuel efficiency to maintain strong operational control. North America leads the global market with a 36% share, supported by vast pipeline infrastructure, robust export capacity, and strong refining operations. The region’s well-established logistics network and investment in modernization initiatives strengthen its competitive edge. These factors position top operators to capitalize on rising global demand and ensure reliable crude supply flows.
Access crucial information at unmatched prices!
Request your sample report today & start making informed decisions powered by Credence Research Inc.!
Download Sample
Market Insights
- The Crude Oil Transportation Market was valued at USD 78.79 billion in 2024 and is expected to reach USD 112.05 billion by 2032, growing at a CAGR of 4.5%.
- Rising global energy demand and refinery expansion are driving investments in pipelines, shipping fleets, and storage facilities to support continuous supply.
- Advanced digital monitoring, real-time tracking, and low-emission fleet upgrades are shaping operational trends and improving efficiency.
- North America holds a 36% market share, leading due to strong infrastructure, while Asia Pacific and Europe follow as key regions supporting trade growth.
- High infrastructure costs, environmental regulations, and operational risks restrain smaller operators, while pipeline transportation remains the dominant segment, securing a significant share of global crude flows.
Market Segmentation Analysis:
By Type
Paraffinic crude oil dominates the market with the largest share due to its lower sulfur content and high refining efficiency. Refineries prefer paraffinic grades for producing gasoline and diesel with minimal processing. Naphthenic and intermediate crude oils follow, driven by their specialized use in lubricant and petrochemical production. Growing investment in upstream exploration and the expansion of pipeline infrastructure further boost paraffinic crude movement. This segment benefits from lower transportation costs and stronger integration with existing refining networks, ensuring stable demand from global energy markets.
- For instance, TotalEnergies SE operates the Donges Refinery in France, which has a crude oil processing capacity of approximately 11.5 million tonnes annually. It uses advanced hydrodesulfurization units to produce low-sulfur fuels and other products, meeting stringent European specifications.
By Transportation Destination
International transportation leads the market with a major share, supported by large export volumes from key producing regions. Major oil-exporting nations rely on robust shipping, pipeline, and terminal networks to serve overseas refineries. Rising global energy demand and stable maritime trade routes drive international flows. Domestic transportation remains essential for moving crude to local refineries and storage hubs. However, the scale of international trade, supported by strategic shipping corridors and global supply chain integration, solidifies its dominant position in the market.
- For instance, ExxonMobil’s Baytown complex supports export shipping by integrating with the Houston Ship Channel. The Baytown refinery has a crude input capacity of 588,000 barrels per day, and its supporting hydrogen / CO₂ infrastructure is designed to capture 7 million metric tons of CO₂ annually for export / storage projects.
By End User
Refineries hold the largest share in this segment, driven by their critical role in converting crude oil into refined products. Consistent demand from refinery operations ensures stable crude transport volumes. Oil producers and transportation companies follow, focusing on moving crude efficiently from extraction points to processing facilities. Government agencies support this network through regulation, infrastructure investment, and energy security measures. The refinery segment benefits from stable processing demand, established supply agreements, and the expansion of downstream capacity in major oil-importing regions.
Key Growth Drivers
Rising Global Energy Demand
The surge in global energy consumption strongly drives crude oil transportation. Growing industrialization, rapid urbanization, and increasing fuel use in emerging economies create consistent demand for crude movement. Refineries and power generation facilities rely on steady supply chains, boosting pipeline and tanker utilization. Expanding refining capacities in Asia and the Middle East increase long-haul transportation volumes. Oil-exporting nations are investing in modern logistics to enhance export capabilities. This growth ensures stable transportation demand across key international routes and inland networks.
- For instance, Kinder Morgan owns or operates approximately 79,000 miles of pipelines and 139 terminals across North America, making it one of the continent’s largest energy infrastructure operators.
Expansion of Pipeline Infrastructure
Pipeline expansion projects significantly accelerate market growth. Governments and private operators are building large-scale pipelines to connect oil fields, refineries, and ports more efficiently. Advanced pipeline monitoring technologies improve safety and minimize leak risks. Pipelines also offer cost advantages over road or rail, strengthening their role in long-term strategies. Regions like North America, Asia Pacific, and the Middle East lead capacity additions. These investments support steady throughput volumes and enhance transportation reliability for both domestic and international trade.
- For instance, BP operates the Baku–Supsa oil pipeline, which is 833 km long and currently delivers around 145,000 barrels per day of crude from Azerbaijan to Georgia.
Increasing International Trade Activities
Rising crude oil exports and imports directly support market expansion. Key producers like Saudi Arabia, the U.S., and Russia are strengthening shipping routes and export terminals. Tanker fleets are growing to handle larger volumes efficiently. Expanding storage facilities at strategic ports ensures smoother distribution. The rise of long-term contracts between producers and refiners creates predictable demand for transportation services. This trend boosts tanker and pipeline utilization rates, supporting capacity expansion and enhancing supply chain resilience.
Key Trends & Opportunities
Adoption of Digital and Automation Technologies
Automation and digitalization are transforming crude oil logistics. Advanced tracking systems, AI-based route optimization, and IoT sensors improve operational visibility. These technologies reduce delays, improve safety, and optimize fleet performance. Predictive maintenance tools lower downtime and increase delivery reliability. Companies adopting such solutions strengthen their competitive position. Technology integration also helps meet environmental compliance goals through improved monitoring and reporting accuracy.
- For instance, Chevron opened its Engineering and Innovation Excellence Center (ENGINE) in Bengaluru, India, covering 312,000 square feet, to centralize AI, digital workflows, and high-performance computing for global operations.
Growing Focus on Energy Security
Countries are prioritizing stable and secure crude supply chains. Strategic reserves, diversified routes, and modern transport systems reduce risks from geopolitical disruptions. Investment in secure infrastructure creates opportunities for logistics providers and service contractors. Enhanced storage capacities at key hubs increase flexibility in emergency scenarios. This trend positions crude transportation networks as vital elements of national energy strategies.
- For instance, Valero joined Summit Carbon Solutions’ proposed pipeline project to transport CO₂ from eight of its ethanol plants, targeting capture of 3.1 million metric tons of CO₂ annually.
Shift Toward Environmentally Responsible Transport
The crude oil transportation sector is under pressure to reduce emissions. Shipowners and pipeline operators are adopting cleaner propulsion systems and efficient pumping solutions. LNG-powered tankers and energy-efficient pipelines help cut carbon footprints. Green transport strategies attract investment and improve regulatory compliance. Sustainability-focused initiatives also create opportunities for service providers offering low-emission solutions.
Key Challenges
High Capital and Operational Costs
Crude oil transportation requires massive infrastructure investments. Building pipelines, terminals, and tanker fleets involves high upfront capital. Rising maintenance costs, safety compliance, and insurance also impact profitability. Smaller operators face financial barriers to entry, limiting market diversity. Volatile oil prices add further uncertainty to investment planning.
Geopolitical and Environmental Risks
Geopolitical tensions, trade disputes, and territorial conflicts threaten crude supply chains. Political instability can disrupt key shipping lanes and pipeline networks. Additionally, environmental incidents like spills can lead to heavy penalties and reputational damage. These risks require advanced risk management strategies and strong compliance frameworks, increasing operational complexity and costs.
Regional Analysis
North America
North America holds the largest share of the crude oil transportation market with 36%. The region benefits from extensive pipeline networks and well-developed maritime infrastructure. The U.S. leads due to strong production from the Permian Basin and Gulf Coast export terminals. Canada supports this growth with heavy crude exports to U.S. refineries. High investment in pipeline modernization and storage capacity strengthens market resilience. The region’s regulatory framework ensures efficient operations and reduces logistical risks. Increasing crude exports to Asia and Europe further boost its dominance. Strategic infrastructure and export capacity keep North America at the forefront of global crude transport.
Europe
Europe accounts for 24% of the crude oil transportation market. The region relies heavily on seaborne imports from the Middle East and Africa. Major terminals in Rotterdam, Wilhelmshaven, and Marseille serve as key hubs. Refineries across Germany, France, and the UK drive steady demand. Europe is investing in cleaner transport technologies to meet decarbonization goals. Strategic pipelines like Druzhba and Transalpine also enhance supply security. Growing demand for energy diversification is boosting crude flows. Infrastructure modernization and stable import demand support the region’s strong position in global transportation networks.
Asia Pacific
Asia Pacific holds a 28% share of the crude oil transportation market. The region is driven by rapid energy demand growth in China, India, Japan, and South Korea. Seaborne trade dominates due to strong reliance on Middle Eastern crude imports. Key ports such as Ningbo-Zhoushan, Mumbai, and Busan play central roles in handling large volumes. Expansion of LNG and oil terminals enhances regional capacity. India and China continue to invest in refining and pipeline infrastructure. Strong refining capacity growth and rising industrial demand position Asia Pacific as a major market driver.
Latin America
Latin America captures 7% of the crude oil transportation market. The region benefits from rich reserves in Venezuela, Brazil, and Mexico. Offshore production, especially in Brazil’s pre-salt fields, fuels export volumes. Crude is mostly transported through tankers and short pipeline networks. Mexico’s proximity to the U.S. strengthens its export flows. Regional governments are investing in port modernization and storage facilities. Rising foreign investment in exploration projects increases supply capacity. Latin America’s strategic location and expanding production base enhance its global market relevance.
Middle East & Africa
The Middle East & Africa hold a 5% share of the crude oil transportation market. The Middle East remains a key supplier to Asia and Europe through major routes like the Strait of Hormuz and Suez Canal. Gulf Cooperation Council (GCC) countries dominate exports with robust port and pipeline infrastructure. Africa, led by Nigeria and Angola, contributes significantly to seaborne trade. Strategic geographic positioning boosts the region’s global importance. Ongoing investment in export terminals and security measures improves transportation efficiency. The region remains central to global crude oil trade flows.
Market Segmentations:
By Type:
- Paraffinic crude oil
- Intermediate crude oil
By Transportation Destination:
- Domestic transportation
- International transportation
By End User:
- Oil producers
- Transportation companies
By Geography
- North America
- Europe
- Germany
- France
- U.K.
- Italy
- Spain
- Rest of Europe
- Asia Pacific
- China
- Japan
- India
- South Korea
- South-east Asia
- Rest of Asia Pacific
- Latin America
- Brazil
- Argentina
- Rest of Latin America
- Middle East & Africa
- GCC Countries
- South Africa
- Rest of the Middle East and Africa
Competitive Landscape
The competitive landscape of the crude oil transportation market features major companies such as TotalEnergies SE, ExxonMobil Corporation, Kinder Morgan, BP PLC, Chevron Corporation, Valero Energy, Enbridge, Marathon Petroleum, Royal Dutch Shell, and Saudi Aramco. The crude oil transportation market is characterized by strong global infrastructure, advanced logistics capabilities, and high capital intensity. Companies focus on expanding pipeline networks, upgrading port facilities, and deploying larger, more efficient tanker fleets to meet rising global energy demand. Investments in real-time monitoring systems and automation enhance operational efficiency and reduce transportation risks. Strategic alliances and long-term supply agreements strengthen market presence and ensure stable crude flows across regions. Increasing regulatory pressure is pushing operators to adopt low-emission transport methods and improve environmental performance. The market remains highly consolidated, with a few large operators dominating global trade through integrated supply chain networks.
Shape Your Report to Specific Countries or Regions & Enjoy 30% Off!
Key Player Analysis
Recent Developments
- In January 2025, Baker Hughes has secured an order from Tecnicas Reunidas to deliver six propane compressors and six gas compression trains for 3rd phase development of Aramco’s Jafurah gas field located in Saudi Arabia. Strengthening its expertise in natural gas value chain, the company will also supply electric motor driven by compression solutions.
- In January 2025, BP has successfully commenced gas flow from wells at the Greater Tortue Ahmeyim Phase 1 LNG project, directing output to its FPSO vessel for next stage of commissioning. Once its completed, the GTA phase 1 is set to deliver of LNG annually.
- In September 2024, Exxon Mobil Corporation and Mitsubishi Corporation entered a project framework agreement for Mitsubishi’s participation in Exxon Mobil’s advanced facility in Baytown, Texas. The project will produce low carbon hydrogen with an impressive 98% carbon capture efficiency in line with low carbon ammonia.
- In July 2024, Energy Transfer LP and Sunoco LP established a strategic partnership targeting crude oil and produced water gathering assets based in the Permian Basin region. By forming this joint venture, these companies are targeting improved operational synergies as well as an aggressive expansion in one of the most productive oil basins of the United States.
Report Coverage
The research report offers an in-depth analysis based on Type, Transportation Destination, End-User and Geography. It details leading market players, providing an overview of their business, product offerings, investments, revenue streams, and key applications. Additionally, the report includes insights into the competitive environment, SWOT analysis, current market trends, as well as the primary drivers and constraints. Furthermore, it discusses various factors that have driven market expansion in recent years. The report also explores market dynamics, regulatory scenarios, and technological advancements that are shaping the industry. It assesses the impact of external factors and global economic changes on market growth. Lastly, it provides strategic recommendations for new entrants and established companies to navigate the complexities of the market.
Future Outlook
- Pipeline expansion projects will strengthen cross-border crude transportation capacity.
- Digitalization will enhance route optimization and cargo tracking efficiency.
- Tanker fleets will adopt advanced fuel-efficient technologies to cut emissions.
- Offshore infrastructure development will boost long-haul crude shipments.
- Strategic storage hubs will support stable global supply chains.
- Investment in smart logistics will reduce operational costs and delays.
- Regulatory policies will push companies toward cleaner transportation solutions.
- Partnerships will increase to secure long-term supply and transport agreements.
- Emerging economies will drive demand for new transportation corridors.
- Innovation in safety systems will improve risk management and reliability.


