
Denmark Pharmaceutical Market Overview:
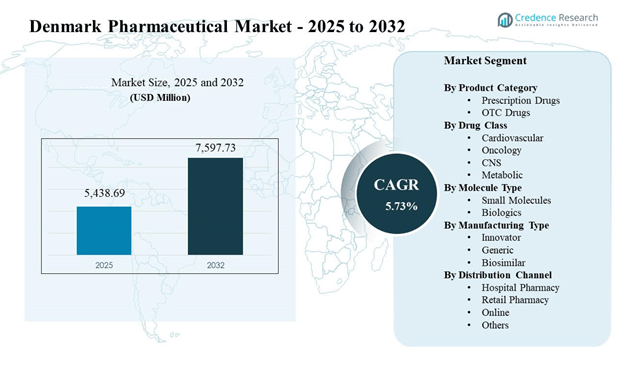
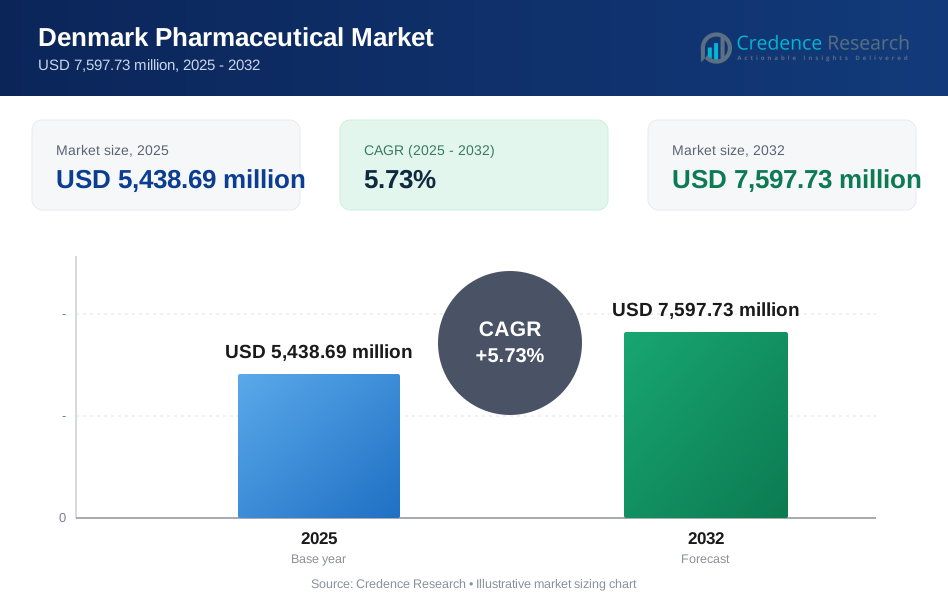
The Denmark Pharmaceutical Market size was estimated at USD 5,438.69 million in 2025 and is expected to reach USD 7,597.73 million by 2032, growing at a CAGR of 5.73% from 2025 to 2032. Growth momentum is primarily supported by Denmark’s high standards of care and steady expansion in chronic disease management, which sustains long-term demand across primary care and specialty therapies. Denmark’s innovation footprint and strong life-sciences ecosystem also help accelerate adoption of newer tr 5.73 eatments through structured reimbursement and clinically driven prescribing pathways.
| REPORT ATTRIBUTE | DETAILS |
|---|---|
| Historical Period | 2020-2024 |
| Base Year | 2025 |
| Forecast Period | 2026-2032 |
| Denmark Pharmaceutical Market Size 2025 | USD 5,438.69 million |
| Denmark Pharmaceutical Market, CAGR | 5.73 % |
| Denmark Pharmaceutical Market Size 2032 | USD 7,597.73 million |
Key Market Trends & Insights
- Denmark Pharmaceutical Market is projected to expand from USD 5,438.69 million (2025) to USD 7,597.73 million (2032), reflecting a 5.73% CAGR over 2025–2032.
- Prescription Drugs held the largest share at 73.4% in 2025, supported by chronic therapy continuity and regulated dispensing dynamics.
- Hospital Pharmacy represented 40.6% share in 2025, reflecting the high weight of hospital-led specialty initiation and centralized procurement.
- The forecast period spans 7 years (2025–2032), with demand supported by long-term therapy persistence in cardiovascular, metabolic, and CNS care.
- The market outlook anchors on 2025 as the base year and 2032 as the forecast year, underscoring stable planning horizons for manufacturers and channel partners.
Segment Analysis
Denmark Pharmaceutical Market segmentation reflects a balance between primary-care continuity and specialty-led growth. Prescription-led consumption remains the structural core because long-term treatment pathways are managed through regulated healthcare delivery and evidence-based protocols. Specialty medicines and biologics continue to influence value growth as hospital settings initiate advanced therapies and follow structured treatment escalation models. Channel strategies prioritize availability, service reliability, and patient support to improve adherence and outcomes.
Manufacturing and molecule trends are shaped by patent cycles and portfolio renewal. Innovator brands remain critical in specialty indications where differentiated efficacy, safety, or dosing convenience determines adoption. Generics remain important for established primary-care categories where cost-effective substitution is mature, and biosimilars support access expansion in biologics-heavy care pathways when substitution policies and physician confidence align. Distribution strategies increasingly blend physical pharmacy access with digital ordering and refill convenience within Denmark’s regulatory framework.
By Product Category Insights
Prescription Drugs accounted for the largest share of 73.4% in 2025. Prescription-led therapy remains dominant because chronic disease management depends on clinician-directed initiation, monitoring, and dose optimization. Structured reimbursement and treatment guidelines reinforce continuity of care, which improves long-term therapy persistence. Pharmacy-led counseling and refill routines further support sustained prescription volumes and stable demand planning for suppliers.
By Drug Class Insights
Drug class leadership was not specified with a published 2025 share in the provided inputs. Cardiovascular and metabolic therapies typically benefit from long-duration treatment pathways and high adherence focus through primary care. Oncology demand is shaped by specialty-care protocols, hospital-led initiation, and the expanding use of targeted therapies. CNS categories reflect persistent need, but uptake is closely tied to clinical differentiation, tolerability, and patient-reported outcomes.
By Molecule Type Insights
Leading molecule-type share for 2025 was not specified with a published value in the provided inputs. Small molecules remain central to broad primary-care therapy because they support scalable prescribing, established protocols, and cost-effective manufacturing. Biologics continue to reshape value growth through specialty care, targeted mechanisms, and expansion into earlier lines of therapy. Biosimilar availability can further widen access and intensify competition without reducing clinical standards.
By Manufacturing Type Insights
Leading manufacturing-type share for 2025 was not specified with a published value in the provided inputs. Innovator portfolios drive differentiation in specialty indications where clinical outcomes, safety profiles, and convenient administration can justify adoption. Generic penetration remains strong in mature therapy areas where substitution and procurement routines emphasize affordability and supply continuity. Biosimilars influence competitive dynamics in biologics-heavy categories as payers, providers, and clinicians align on interchangeability confidence and treatment protocols.
By Distribution Channel Insights
Hospital Pharmacy accounted for the largest share of 40.6% in 2025. Hospital-led initiation is influential because specialty medicines often begin in secondary care settings with structured clinical oversight. Centralized procurement and formulary decisions shape early adoption and standardize usage patterns across provider networks. Retail and online channels support continuity of therapy after initiation, particularly for refills and patient-managed chronic treatments.
Denmark Pharmaceutical Market Drivers
Expansion of chronic disease management and prevention pathways
Denmark Pharmaceutical Market growth is supported by sustained demand for long-term therapy across cardiovascular, metabolic, and CNS care. Clinical pathways emphasize early diagnosis, proactive treatment, and monitoring, which extends therapy duration and improves adherence. Prescribing is guided by structured protocols that favor evidence-backed medicines and consistent treatment routines. Provider focus on outcomes and patient quality of life reinforces steady utilization rather than episodic demand patterns.
- For instance, Novo Nordisk reported that once-weekly semaglutide 2.4 mg reduced major adverse cardiovascular events by 20% in the SELECT trial involving 17,604 adults, with 1,270 first MACE events accrued.
Specialty-care innovation and hospital-led adoption
Advanced therapies increasingly influence market value as hospitals initiate complex regimens and enforce standardized treatment escalation models. Hospital formularies and clinical committees support systematic adoption of differentiated products when real-world outcomes and safety performance are clear. Specialty medicines also benefit from patient-support programs that improve persistence and reduce discontinuation risks. This dynamic sustains value growth even when overall population growth is moderate.
- For instance, Genmab announced that epcoritamab monotherapy improved progression-free survival in the Phase 3 EPCORE DLBCL-1 study with a hazard ratio of 0.74 and a 95% confidence interval of 0.60 to 0.92.
Regulated pharmacy framework supporting stable dispensing economics
Pharmacy-led dispensing stability supports consistent access and predictable procurement cycles. Prescription dominance is reinforced by clinician-directed initiation and follow-up, which anchors demand in the healthcare system rather than discretionary retail behavior. Professional counseling and structured refill models improve therapy adherence and continuity. This environment benefits manufacturers that can ensure uninterrupted supply and consistent product availability.
Portfolio lifecycle management and competitive substitution dynamics
Market demand is shaped by patent expiries, product switching, and the uptake of cost-effective alternatives where clinical equivalence is accepted. Manufacturers sustain competitiveness through line extensions, improved formulations, and differentiated delivery devices. Generics and biosimilars expand access and intensify competition, especially where procurement emphasizes value. Supply reliability and regulatory compliance remain decisive differentiators in tender-driven decisions.
Denmark Pharmaceutical Market Challenges
Pricing and reimbursement discipline can constrain revenue expansion, particularly for premium-priced specialty medicines where health-economic justification must be robust. Decision cycles may be prolonged when formulary inclusion requires multi-stakeholder evaluation and long-term budget impact clarity. Manufacturers also face pressure to demonstrate real-world outcomes, not just clinical trial performance, to secure sustained adoption. Competitive substitution can accelerate in mature categories, compressing margins and shifting volume toward cost-focused alternatives.
- For instance, Amgen reported that in the 27,564-patient FOURIER outcomes study, Repatha reduced LDL-C from a median of 92 mg/dL to 30 mg/dL, a 59% reduction at week 48, while also lowering the risk of major adverse cardiovascular events by 20%.
Supply resilience and regulatory compliance remain persistent challenges, especially for temperature-sensitive biologics and products with complex manufacturing requirements. Any disruptions in production, quality, or distribution can lead to channel instability and rapid product switching. Demand forecasting can be difficult when therapy guidelines evolve or when new entrants alter treatment patterns. These risks increase operational complexity for both innovators and follow-on manufacturers.
Denmark Pharmaceutical Market Trends and Opportunities
Digital engagement is increasingly relevant as patients and providers expect easier ordering, refill management, and treatment support. Channel partners that combine physical access with digital convenience can improve adherence and reduce therapy discontinuation. Manufacturers benefit from improving patient-support services, education, and outcomes tracking, especially in chronic and specialty categories. Data-driven engagement can also strengthen product differentiation where clinical performance is comparable.
- For instance, Walgreens Boots Alliance reported that its Walgreens app had more than 94 million lifetime downloads, while users could access features such as pill reminders, prescription refill-by-scan, 24/7 pharmacist chat, and same-day prescription delivery.
Specialty expansion creates opportunities for differentiated therapies, biosimilar portfolio scaling, and targeted partnerships. Hospitals remain important for early adoption, but lifecycle strategies increasingly plan for continuation through retail and digital channels. Therapeutic innovation, improved administration routes, and better tolerability profiles can shift treatment choices even in established categories. Companies that align market access, evidence generation, and reliable supply are positioned to gain share as competition intensifies.
Regional Insights
Hovedstaden (Capital Region)
Hovedstaden is typically the most influential Denmark region for pharmaceutical demand due to dense population, high healthcare utilization, and concentration of advanced hospital services around Copenhagen. Specialty initiation patterns tend to be stronger where tertiary care and specialist availability are higher. Channel requirements emphasize rapid availability, high service levels, and strong cold-chain reliability for biologics. Market participants often prioritize stakeholder engagement with major hospital groups and specialist prescribers in this region.
Midtjylland (Central Denmark)
Midtjylland’s demand profile reflects a mix of urban centers and wider geographic coverage that can increase the importance of efficient distribution and refill continuity. Chronic therapy management remains a consistent driver, with stable utilization anchored in primary care coordination. Hospital adoption patterns are shaped by regional care networks and standardized treatment pathways. Manufacturers often focus on ensuring product availability and supporting providers with evidence and adherence programs across dispersed catchments.
Syddanmark (Southern Denmark)
Syddanmark combines community-dispensing stability with hospital-driven specialty initiation across key care hubs. Demand is supported by chronic disease treatment persistence and structured prescribing protocols. Distribution priorities include steady inventory availability and minimized disruption risk, particularly for high-importance therapies. Market growth opportunities often relate to strengthening patient support and ensuring smooth transitions from hospital initiation to community continuation.
Sjælland (Region Zealand)
Sjælland’s pharmaceutical dynamics are shaped by healthcare access patterns and proximity to the Capital Region’s specialist ecosystem. Prescribing and treatment continuation depend on strong coordination between hospital and community settings. Channel performance tends to favor partners that can support predictable supply and consistent dispensing services. Manufacturers typically position products through clinical value messaging and stakeholder engagement aligned with regional care priorities.
Nordjylland (North Denmark)
Nordjylland’s demand emphasizes continuity of supply and efficient distribution because care delivery spans a broader geography with fewer high-density centers. Chronic therapy remains structurally important, reinforcing stable refill-driven consumption. Hospital and community integration is critical to sustain adherence and reduce interruption risks. Market participants often focus on dependable logistics, service responsiveness, and practical patient-support tools that strengthen persistence.
Competitive Landscape
Denmark Pharmaceutical Market competition is shaped by a mix of Denmark-based leaders and global manufacturers competing across specialty and primary-care portfolios. Competitive advantage is supported by clinical differentiation, robust evidence generation, and effective market access execution aligned with reimbursement and formulary processes. Supply reliability, lifecycle management, and patient-support capabilities influence sustained adoption, especially where substitution pressure is high. Companies also compete through targeted partnerships, pipeline renewal, and selective expansion in high-growth therapy areas.
Novo Nordisk is positioned as a high-impact player through focused therapeutic leadership and sustained investment in innovation and outcomes-driven commercialization. Strategic emphasis typically centers on differentiated clinical profiles, strong physician engagement, and scalable supply execution for high-demand categories. Market performance is reinforced when evidence generation supports payer confidence and improves persistence outcomes. Long-term competitiveness also depends on maintaining manufacturing resilience and effective lifecycle strategies amid intensifying category competition.
The industry research and growth report includes detailed analyses of the competitive landscape of the market and information about key companies, including:
- Novo Nordisk
- Lundbeck
- Leo Pharma
- AstraZeneca
- Pfizer
- Roche
- Sanofi
- GSK
- Merck
Qualitative and quantitative analysis of companies has been conducted to help clients understand the wider business environment as well as the strengths and weaknesses of key industry players. Data is qualitatively analyzed to categorize companies as pure play, category-focused, industry-focused, and diversified; it is quantitatively analyzed to categorize companies as dominant, leading, strong, tentative, and weak.
Recent Developments
- In April 2026, Novo Nordisk announced a partnership with OpenAI to transform how medicines are discovered and delivered, marking a notable strategic collaboration for Denmark’s pharmaceutical sector.
- In February 2026, Novo Nordisk entered a partnership with U.S.-based Vivtex Corp in a deal valued at up to $2.1 billion to develop next-generation oral medicines for obesity and diabetes.
- In July 2025, MedCap, through its wholly owned subsidiary Unimedic Pharma AB, completed the acquisition of Danish company XGX Pharma after receiving the necessary regulatory approval in Denmark; the transaction had originally been announced on June 25, 2025.
- In May 2025, DanCann Pharma reported an exclusive distribution agreement with Tetra Pharm Technologies for the Danish market, giving DanCann rights to the ZYNDIKATE delivery system for lipophilic molecules such as cannabinoids.
Report Scope
| Report Attribute | Details |
| Market size value in 2025 | USD 5,438.69 million |
| Revenue forecast in 2032 | USD 7,597.73 million |
| Growth rate (CAGR) | 5.73% (2025–2032) |
| Base year | 2025 |
| Forecast period | 2026-2032 |
| Quantitative units | USD million |
| Segments covered | By Product Category Outlook: Prescription Drugs, OTC Drugs; By Drug Class Outlook: Cardiovascular, Oncology, CNS, Metabolic; By Molecule Type Outlook: Small Molecules, Biologics; By Manufacturing Type Outlook: Innovator, Generic, Biosimilar; By Distribution Channel Outlook: Hospital Pharmacy, Retail Pharmacy, Online, Others |
| Regional scope | Hovedstaden (Capital Region), Midtjylland (Central Denmark), Syddanmark (Southern Denmark), Sjælland (Region Zealand), Nordjylland (North Denmark) |
| Key companies profiled | Novo Nordisk, Lundbeck, Leo Pharma, AstraZeneca, Pfizer, Roche, Sanofi, Bayer, GSK, Merck |
| No. of Pages | 332 |
Segmentation
By Product Category
- Prescription Drugs
- OTC Drugs
By Drug Class
- Cardiovascular
- Oncology
- CNS
- Metabolic
By Molecule Type
- Small Molecules
- Biologics
By Manufacturing Type
- Innovator
- Generic
- Biosimilar
By Distribution Channel
- Hospital Pharmacy
- Retail Pharmacy
- Online
- Others
By Denmark Region
- Hovedstaden (Capital Region)
- Midtjylland (Central Denmark)
- Syddanmark (Southern Denmark)
- Sjælland (Region Zealand)
- Nordjylland (North Denmark)
Request a Free Sample
Fill in your details and we'll send you a free sample report.
- Sample data tables & charts
- Research methodology
Need a Custom Version of This Report?
Tailor the scope, geography, or segments to your exact requirements.
- Custom geography or segment scope
- Direct access to our analyst team
Frequently Asked Questions
What is the market size and forecast for Denmark Pharmaceutical Market?
What is the CAGR for Denmark Pharmaceutical Market?
What is the largest segment in Denmark Pharmaceutical Market?
What factors are driving growth in Denmark Pharmaceutical Market?
Who are the leading companies in Denmark Pharmaceutical Market?
Which Denmark region leads pharmaceutical demand?
Table of Content
Chapter 1. Report Introduction
- 1.1 Report Description & Purpose
- 1.1.1 Report Title & Market Definition
- 1.1.2 Unique Selling Propositions (USP) & Key Differentiators
- 1.1.3 Value Proposition for Stakeholders
- 1.2 Research Objectives
- 1.2.1 Market Sizing Objectives (Volume & Revenue)
- 1.2.2 Segmentation Objectives
- 1.2.3 Competitive Intelligence Objectives
- 1.2.4 Forecast & Scenario Objectives
- 1.3 Report Scope
- 1.3.1 Denmark Pharmaceutical Scope – Types & Subtypes Covered
- 1.3.2 Geographic Scope – Regions & Countries Covered
- 1.3.3 Historical Period, Base Year & Forecast Period (2025; forecast to 2032)
- 1.3.4 Inclusions & Exclusions
- 1.4 HS Code & Classification Framework
- 1.5 Currency, Units & Pricing Basis
- 1.6 Target Stakeholders
- 1.7 Limitations & Assumptions
Chapter 2. Executive Summary
- 2.1 Global Denmark Pharmaceutical Market Snapshot
- 2.1.1 Market Size – Historical (2025) & Forecast (2025-2032) (2025: USD 5,438.69 million → 2032: USD 7,597.73 million)
- 2.1.2 Volume & Revenue – Global Totals
- 2.1.3 Key Market Highlights – Top Five Facts
- 2.2 Denmark Pharmaceutical Market Segmentation Snapshot
- 2.2.1 Market Split by Region – 2025 vs. 2032
- 2.3 Competitive Snapshot
- 2.3.1 Top 10 Players by Revenue Share – 2025
- 2.3.2 Top 10 Players by Volume Share – 2025
- 2.3.3 Recent Strategic Developments (18-Month Summary)
- 2.4 Key Investment Highlights & Strategic Conclusions
Chapter 3. Denmark Pharmaceutical Market Dynamics & Industry Analysis
- 3.1 Market Overview & Context
- 3.1.1 Denmark Pharmaceutical Market Position in the Broader Automotive Value Chain
- 3.1.2 OEM vs. Replacement Market Dynamics
- 3.1.3 Market Maturity & Development Stage by Region
- 3.2 Denmark Pharmaceutical Market Drivers
- 3.3 Denmark Pharmaceutical Market Restraints & Challenges
- 3.4 Denmark Pharmaceutical Market Opportunities
- 3.5 Porter's Five Forces Analysis
- 3.5.1 Threat of New Entrants
- 3.5.2 Bargaining Power of Suppliers
- 3.5.3 Bargaining Power of Buyers
- 3.5.4 Threat of Substitutes
- 3.5.5 Competitive Rivalry – Intensity Assessment
- 3.6 Denmark Pharmaceutical Value Chain Analysis
- 3.6.1 Upstream – Raw Material/Input Suppliers
- 3.6.1.1 Raw Material/Input 1
- 3.6.1.2 Raw Material/Input 2
- 3.6.1.3 Raw Material/Input 3
- 3.6.2 Midstream – Production/Manufacturing/Service Delivery
- 3.6.2.1 Production/Process Overview
- 3.6.2.2 Key Facility Locations & Capacity by Manufacturer
- 3.6.3 Downstream – Distribution & End Consumer
- 3.6.3.1 Primary Channel – B2B/OEM
- 3.6.3.2 Secondary Channels – Dealer, Retail, Online, Direct
- 3.6.4 Value Chain Profitability Analysis
- 3.6.1 Upstream – Raw Material/Input Suppliers
- 3.7 PESTEL Analysis
- 3.7.1 Political Factors
- 3.7.2 Economic Factors
- 3.7.3 Social Factors
- 3.7.4 Technological Factors
- 3.7.5 Environmental Factors
- 3.7.6 Legal Factors
- 3.8 Denmark Pharmaceutical Supply Chain Analysis
- 3.8.1 Raw Material/Input Supply Risk Assessment
- 3.8.2 Manufacturing Concentration Risk (Geographic Exposure)
- 3.8.3 Trade Disruption Impact Analysis
- 3.9 Regulatory & Policy Landscape
Note: The regulatory and policy landscape section covers regulations based on their applicability to the market, Denmark Pharmaceutical category, geography, and scope of the study. Only regulatory frameworks with a material impact on operations, compliance, trade, sustainability, or market access are analyzed in detail.
Chapter 4. Key Investment Pockets & Opportunity Analysis
- 4.1 Denmark Pharmaceutical Market Attractiveness Analysis
- 4.1.1 By Region – Investment Attractiveness Matrix (Volume × CAGR)
- 4.2 Absolute Revenue Growth Opportunity
- 4.2.1 By Region – Absolute USD Growth Through 2032
- 4.3 Incremental Volume Opportunity
- 4.3.1 By Region – Incremental Volume Through 2032
- 4.3.2 Segment – Incremental Volume
- 4.4 Emerging Submarket Opportunity Deep Dive (Subject to Applicability)
- 4.5 Emerging Market Opportunity Scorecards
- 4.5.1 United States
- 4.5.2 Europe
- 4.5.3 Asia
- 4.5.4 Middle East & Africa
Note: Emerging Market Opportunity Scorecards will be included based on relevance and strategic importance. Regions listed are indicative and may vary depending on data availability and market dynamics.
Chapter 5. Denmark Pharmaceutical Import-Export Analysis & Trade Flows
- 5.1 Global Trade Overview
- 5.1.1 Global Export Value by Country (2025)
- 5.1.2 Global Export Volume by Country (2025)
- 5.1.3 Global Import Value by Country (2025)
- 5.1.4 Global Import Volume by Country (2025)
- 5.1.5 Net Trade Balance by Country (2025)
- 5.2 Export Analysis – Segment
- 5.2.1 Type 1 (HS Code)
- 5.2.2 Type 2 (HS Code)
- 5.2.3 Type 3 (HS Code)
- 5.2.4 Type 4 (HS Code)
- 5.2.5 Type 5 (HS Code)
- 5.3 Import Analysis – Segment
- 5.3.1 Type 1 (HS Code)
- 5.3.2 Type 2 (HS Code)
- 5.3.3 Type 3 (HS Code)
- 5.3.4 Type 4 (HS Code)
- 5.3.5 Type 5 (HS Code)
- 5.4 Average Unit Trade Prices
- 5.4.1 Average Export Price – Segment & Country
- 5.4.2 Average Import Price – Segment & Source Country
- 5.4.3 Price Trends (2025)
- 5.5 Key Trade Route Analysis
- 5.5.1 Trade Route 1
- 5.5.2 Trade Route 2
- 5.5.3 Trade Route 3
- 5.5.4 Trade Route 4
- 5.5.5 Trade Route 5
- 5.6 Trade Policy Impact Assessment
- 5.6.1 US Anti-Dumping & Section 301 Tariffs
- 5.6.2 EU Customs Union Impact
- 5.6.3 Major Free Trade Agreements
- 5.6.4 USMCA Rules of Origin
Note: Trade policy analysis will be included only where relevant to the Denmark Pharmaceutical market.
Chapter 6. Competitive Landscape & Company Benchmarking
- 6.1 Denmark Pharmaceutical Market Concentration & Structure
- 6.1.1 Herfindahl-Hirschman Index (HHI) – vs. 2025
- 6.1.2 Tier 1, Tier 2 & Tier 3 Market Structure
- 6.1.3 Global, Regional & Local Player Dynamics
- 6.2 Denmark Pharmaceutical Market Share Analysis – 2025
- 6.2.1 Global Revenue Share by Company
- 6.2.2 Global Volume Share by Company
- 6.2.3 Regional Revenue Share
- 6.2.4 Market Share Evolution ( vs. 2025)
- 6.2.5 OEM Segment Share by Company
- 6.2.6 Replacement Segment Share by Company
- 6.3 Production/Delivery Capacity & Facility Analysis
- 6.3.1 Global Installed Capacity
- 6.3.2 Capacity Utilization Rates
- 6.3.3 Production/Output Volume
- 6.3.4 Facility Locations & Capacity Map
- 6.3.5 Planned Capacity Additions
- 6.4 Denmark Pharmaceutical Competitive Benchmarking Matrix
- 6.4.1 Revenue, Volume, CAGR & Profitability Comparison
- 6.4.2 Channel Revenue Mix
- 6.4.3 Geographic Revenue Exposure
- 6.4.4 R&D Intensity
- 6.4.5 Sustainability Maturity
- 6.5 Strategic Developments in Denmark Pharmaceutical (Last 24 Months)
- 6.5.1 Mergers, Acquisitions & Divestments
- 6.5.2 New Denmark Pharmaceutical Launches
- 6.5.3 Facility Expansions
- 6.5.4 Strategic Alliances, Joint Ventures & Partnerships
- 6.5.5 Distribution Expansion & Market Entry
- 6.5.6 Sustainability & ESG Initiatives
- 6.6 Competitive Strategy Mapping
- 6.6.1 Leader, Challenger, Follower & Niche Classification
- 6.6.2 Pricing Strategy Comparison
- 6.6.3 Channel Strategy Matrix
Note: Strategic developments are included based on their materiality and the availability of reliable information.
Chapter 7. Global Denmark Pharmaceutical Market – By Distribution Channel
- 7.1 Segment Overview
- 7.1.1 Volume & Revenue Split by Channel (2025 & 2032)
- 7.1.2 Channel Mix Evolution (2025-2032)
Chapter 8. Regional Market Analysis – Global Overview
- 8.1 Global Regional Overview
- 8.1.1 Regional Volume Share
- 8.1.2 Regional Revenue Share
- 8.1.3 Regional Volume by Region
- 8.1.4 Regional Revenue by Region
- 8.1.5 Regional Forecast Through 2032
- 8.2 Cross-Regional Segment Analysis
- 8.2.1 By Distribution Channel
- 8.2.2 By Brand/Price Tier
Chapter 9. North America Denmark Pharmaceutical Market
- 9.1 United States
- 9.2 Canada
- 9.3 Mexico
Chapter 10. Europe Denmark Pharmaceutical Market
- 10.1 Germany
- 10.2 France
- 10.3 Italy
- 10.4 United Kingdom
- 10.5 Spain
- 10.6 Poland
- 10.7 Russia
- 10.8 Netherlands
- 10.9 Belgium
- 10.10 Sweden
- 10.11 Denmark
- 10.12 Norway
- 10.13 Rest of Europe
Chapter 11. Asia Pacific Denmark Pharmaceutical Market
- 11.1 China
- 11.2 India
- 11.3 Japan
- 11.4 South Korea
- 11.5 Thailand
- 11.6 Indonesia
- 11.7 Vietnam
- 11.8 Malaysia
- 11.9 Australia
- 11.10 Rest of Asia Pacific
Chapter 12. Latin America Denmark Pharmaceutical Market
- 12.1 Brazil
- 12.2 Argentina
- 12.3 Colombia
- 12.4 Chile
- 12.5 Rest of Latin America
Chapter 13. Middle East Denmark Pharmaceutical Market
- 13.1 Saudi Arabia
- 13.2 United Arab Emirates
- 13.3 Turkey
- 13.4 Israel
- 13.5 Iran
- 13.6 Rest of the Middle East
Chapter 14. Africa Denmark Pharmaceutical Market
- 14.1 South Africa
- 14.2 Egypt
- 14.3 Nigeria
- 14.4 Morocco
- 14.5 Rest of Africa
Chapter 15. Denmark Pharmaceutical Company Profiles
- 15.1 [Company 01]
- 15.1.1 Company Overview
- 15.1.2 Key Management Personnel
- 15.1.3 Products & Services Portfolio
- 15.1.4 Financial Performance
- 15.1.5 Key Market Focus & Geographic Presence
- 15.1.6 Recent Developments & Strategic Initiatives
Note: The company profile list is preliminary and may change based on research findings, market developments, data availability, and client requirements.
Chapter 16. Appendices
- Appendix A – List of Abbreviations & Acronyms
- Appendix B – Industry Classification Code Reference – Full Series
- Appendix C – Production & Capacity Data Tables
- Appendix D – End-Use & Demand Base Tables
- Appendix E – Consumption & Replacement Rate Assumptions
- Appendix F – ASP Reference Tables
- Appendix G – Manufacturing & Facility Database
- Appendix H – Import-Export Data Tables
- Appendix I – Regulatory Summary Tables
- Appendix J – Primary Research Participant List (Anonymized)
- Appendix K – Primary Research Questionnaire Framework
- Appendix L – Data Sources & Bibliography
- Appendix M – Market Size Divergence & Source Comparison
Chapter 17. Research Methodology
- 17.1 Research Framework & Philosophy
- 17.2 Secondary Research – Sources, Hierarchy & Data Extraction
- 17.3 Data Modeling – Bottom-Up & Top-Down Market Sizing
- 17.4 Primary Research – Stakeholder Framework, LOI & Sample Sizes
- 17.5 Forecast Methodology – Regression, Scenario & Sensitivity Analysis
- 17.6 Quality Control – Four-Layer Validation Framework
- 17.7 Limitations & Standard Assumptions
- 17.8 Disclaimer
