
Dental equipment market grows on digital clinic upgrades
The global dental equipment market was valued at USD 12.62 billion in 2025 and is projected to increase from USD 13.23 billion in 2026 to USD 20.37 billion by 2035, registering a CAGR of 4.91% during 2026–2035. Demand comes from the large global burden of tooth decay and gum disease, aging patients who keep more natural teeth, and clinics that replace film and analog tools with digital systems. North America held the largest regional share, 38.0% in 2025, because high treatment prices and broad private coverage support premium imaging and chairside milling. Asia Pacific is the fastest-growing region at 6.05% a year, as China, India and Southeast Asia add private clinics and implant centers. Public policy also shifted in 2024 and 2025, when Canada opened a federal dental plan and parties to the Minamata Convention agreed to end dental amalgam use by 2034. As a result, restorative workflows are moving further toward digital design.
Which products and care settings does this analysis cover?
The analysis counts digital X-ray units, dental lasers, cone beam CT systems, cast machines, electrosurgical units, CAD/CAM systems, treatment chairs, handpieces and other capital devices, valued at manufacturer selling prices. Clinics buy most products through dealers, often with financing or bundled service contracts.
Consumables such as filling materials, implants, aligners and impression materials sit outside the scope of this analysis. The value chain runs from component makers through device manufacturers and dealers to group practices, hospitals, dental schools and the dentists who choose each system.
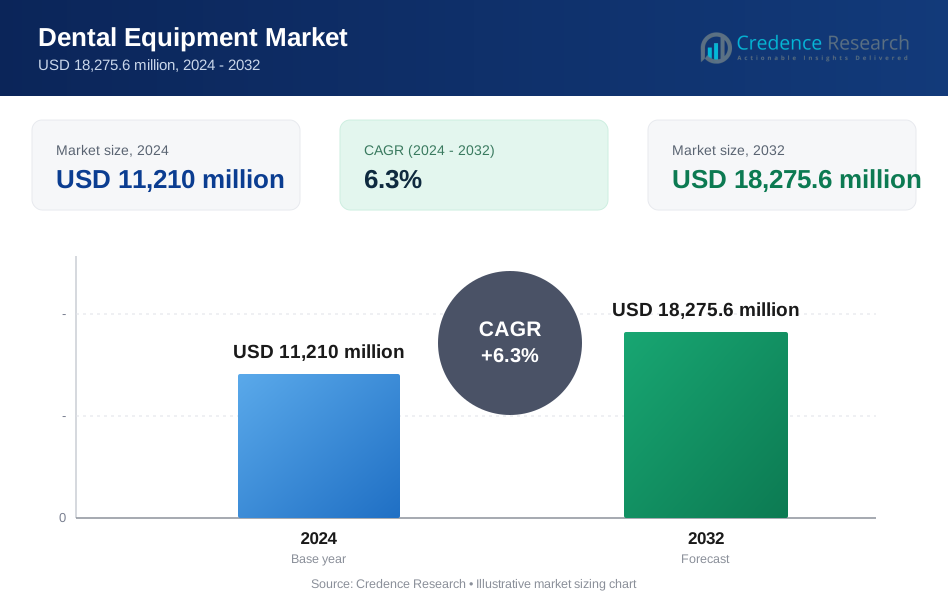
Dental Equipment Market Insights
- The dental equipment market grows from USD 12.62 billion in 2025 to USD 20.37 billion by 2035, a 4.91% CAGR as clinics replace analog tools with digital systems.
- North America held 38.0% of global dental equipment value in 2025, supported by high treatment prices and wide private dental coverage.
- Chairs led product types with 18.0% of 2025 value, while cone beam CT systems grow fastest at 6.13% a year.
- In November 2025, parties to the Minamata Convention agreed to phase out dental amalgam by 2034, which favors digital restorative workflows.
- Dentsply Sirona launched the cloud-native Primescan 2 scanner in September 2024, which shows how platform makers now compete on connected software.
Chairs lead product spending as cone beam CT grows fastest
Why do chairs still lead product spending?
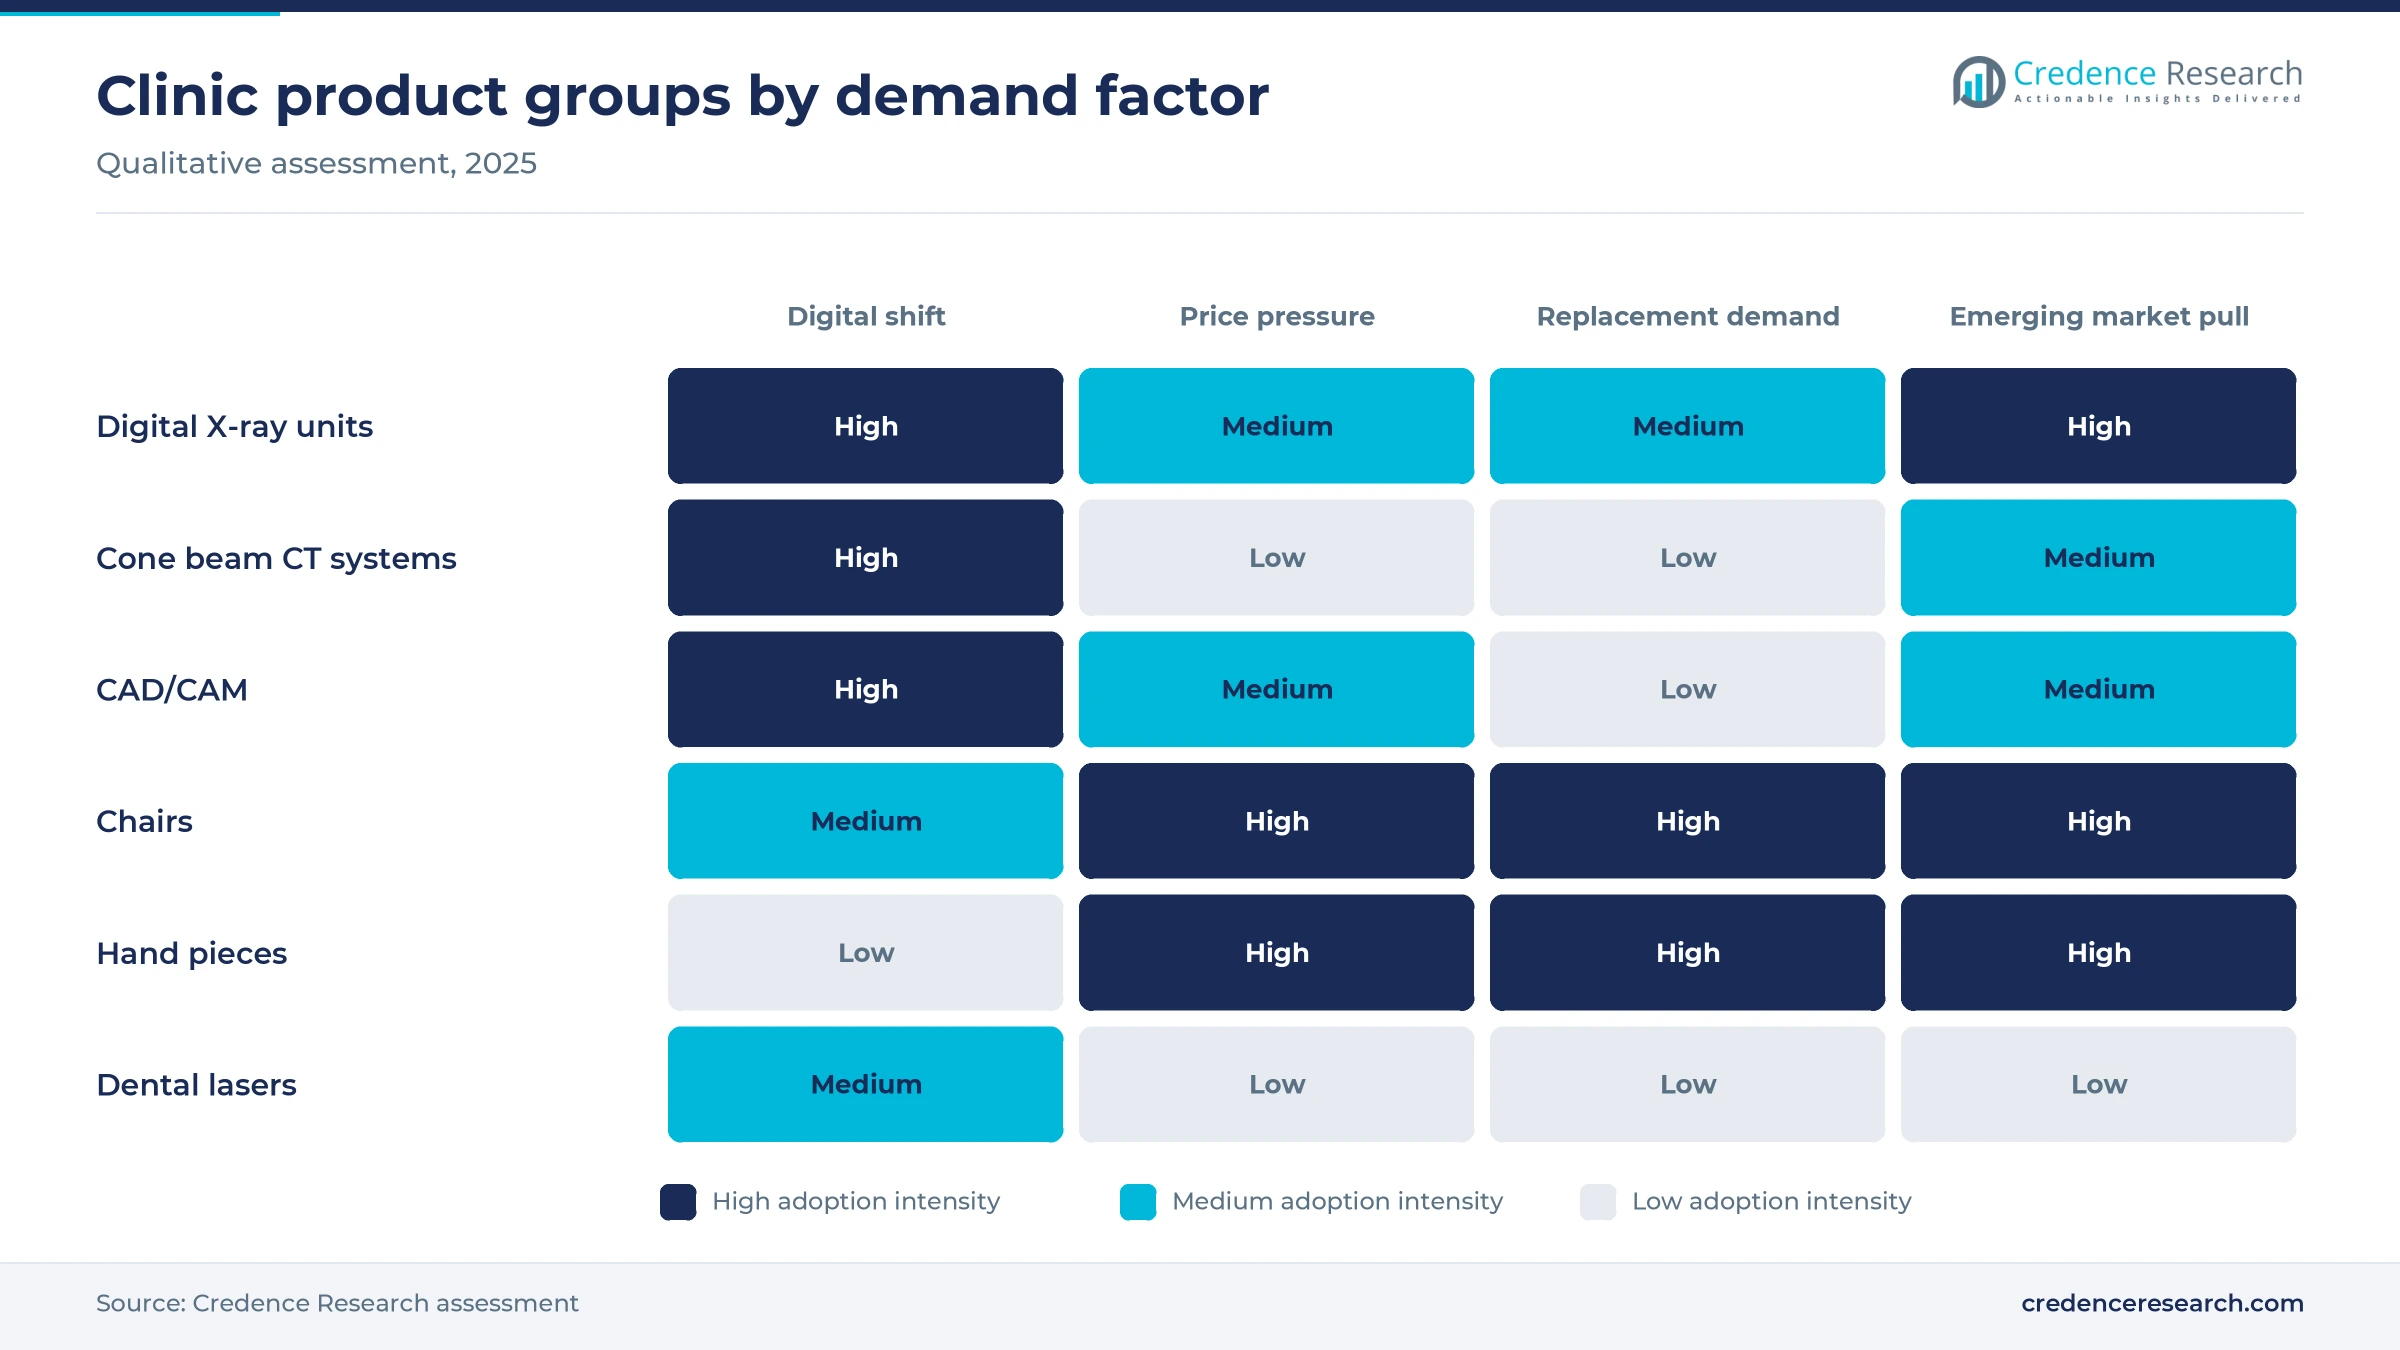
Based on product, the market is categorized into digital X-ray units, dental lasers, cone beam CT systems, cast machines, electrosurgical equipment, CAD/CAM, chairs, hand pieces and others. Chairs led with 18.0% of 2025 value, because every operatory needs a treatment unit and chairs carry high unit prices. Cone Beam CT Systems grow fastest at 6.13% a year, as implant planning and endodontic diagnosis move to 3D imaging. CAD/CAM also gains as clinics mill crowns in one visit.
Which treatment areas drive the most equipment use?
Based on treatment, the market is categorized into orthodontic, endodontic, periodontic and prosthodontic care. The Prosthodontic segment led with a 36.0% share of 2025 value, because crowns, bridges, dentures and implant restorations rely on imaging, scanning and milling systems. The Orthodontic segment grows fastest at 5.64% a year, as digital scans replace impressions for clear aligners and other tooth movement cases. Endodontic care keeps steady demand for handpieces, apex locators and imaging in general practices.
Which care settings buy most clinic technology?
Based on end user, the market is categorized into dental hospitals and clinics, academic and research institutes and others. The Dental Hospitals and Clinics segment led with a 78.0% share of 2025 value, because private practices and group clinics deliver most dental treatment worldwide. The Others segment grows fastest at 5.65% a year, as public programs, mobile units and community centers widen care for underserved groups. Dental schools and research institutes buy training simulators and imaging systems.
| Segment Group | Leading Sub-segment | Share, 2025 | Fastest-growing Sub-segment | CAGR, 2026–2035 |
|---|---|---|---|---|
| By Product | Chairs | 18.0% | Cone Beam CT Systems | 6.13% |
| By Treatment | Prosthodontic | 36.0% | Orthodontic | 5.64% |
| By End User | Dental Hospitals and Clinics | 78.0% | Others | 5.65% |
Request a Free Sample
Fill in your details and we'll send you a free sample report.
- Sample data tables & charts
- Research methodology
Oral disease burden and aging patients lift clinic demand
How does the global burden of oral disease sustain demand?
Oral disease creates the core demand, because tooth decay, gum disease and tooth loss all need diagnosis and treatment in a clinic chair. The World Health Organization estimates that oral diseases affect nearly 3.7 billion people, and severe periodontal disease accounts for more than 1 billion cases worldwide. Untreated decay in permanent teeth is the most common health condition, according to the same March 2025 fact sheet. As a result, clinics need steady capacity for imaging, restoration and gum treatment across every region.
Why do aging patients widen restorative demand?
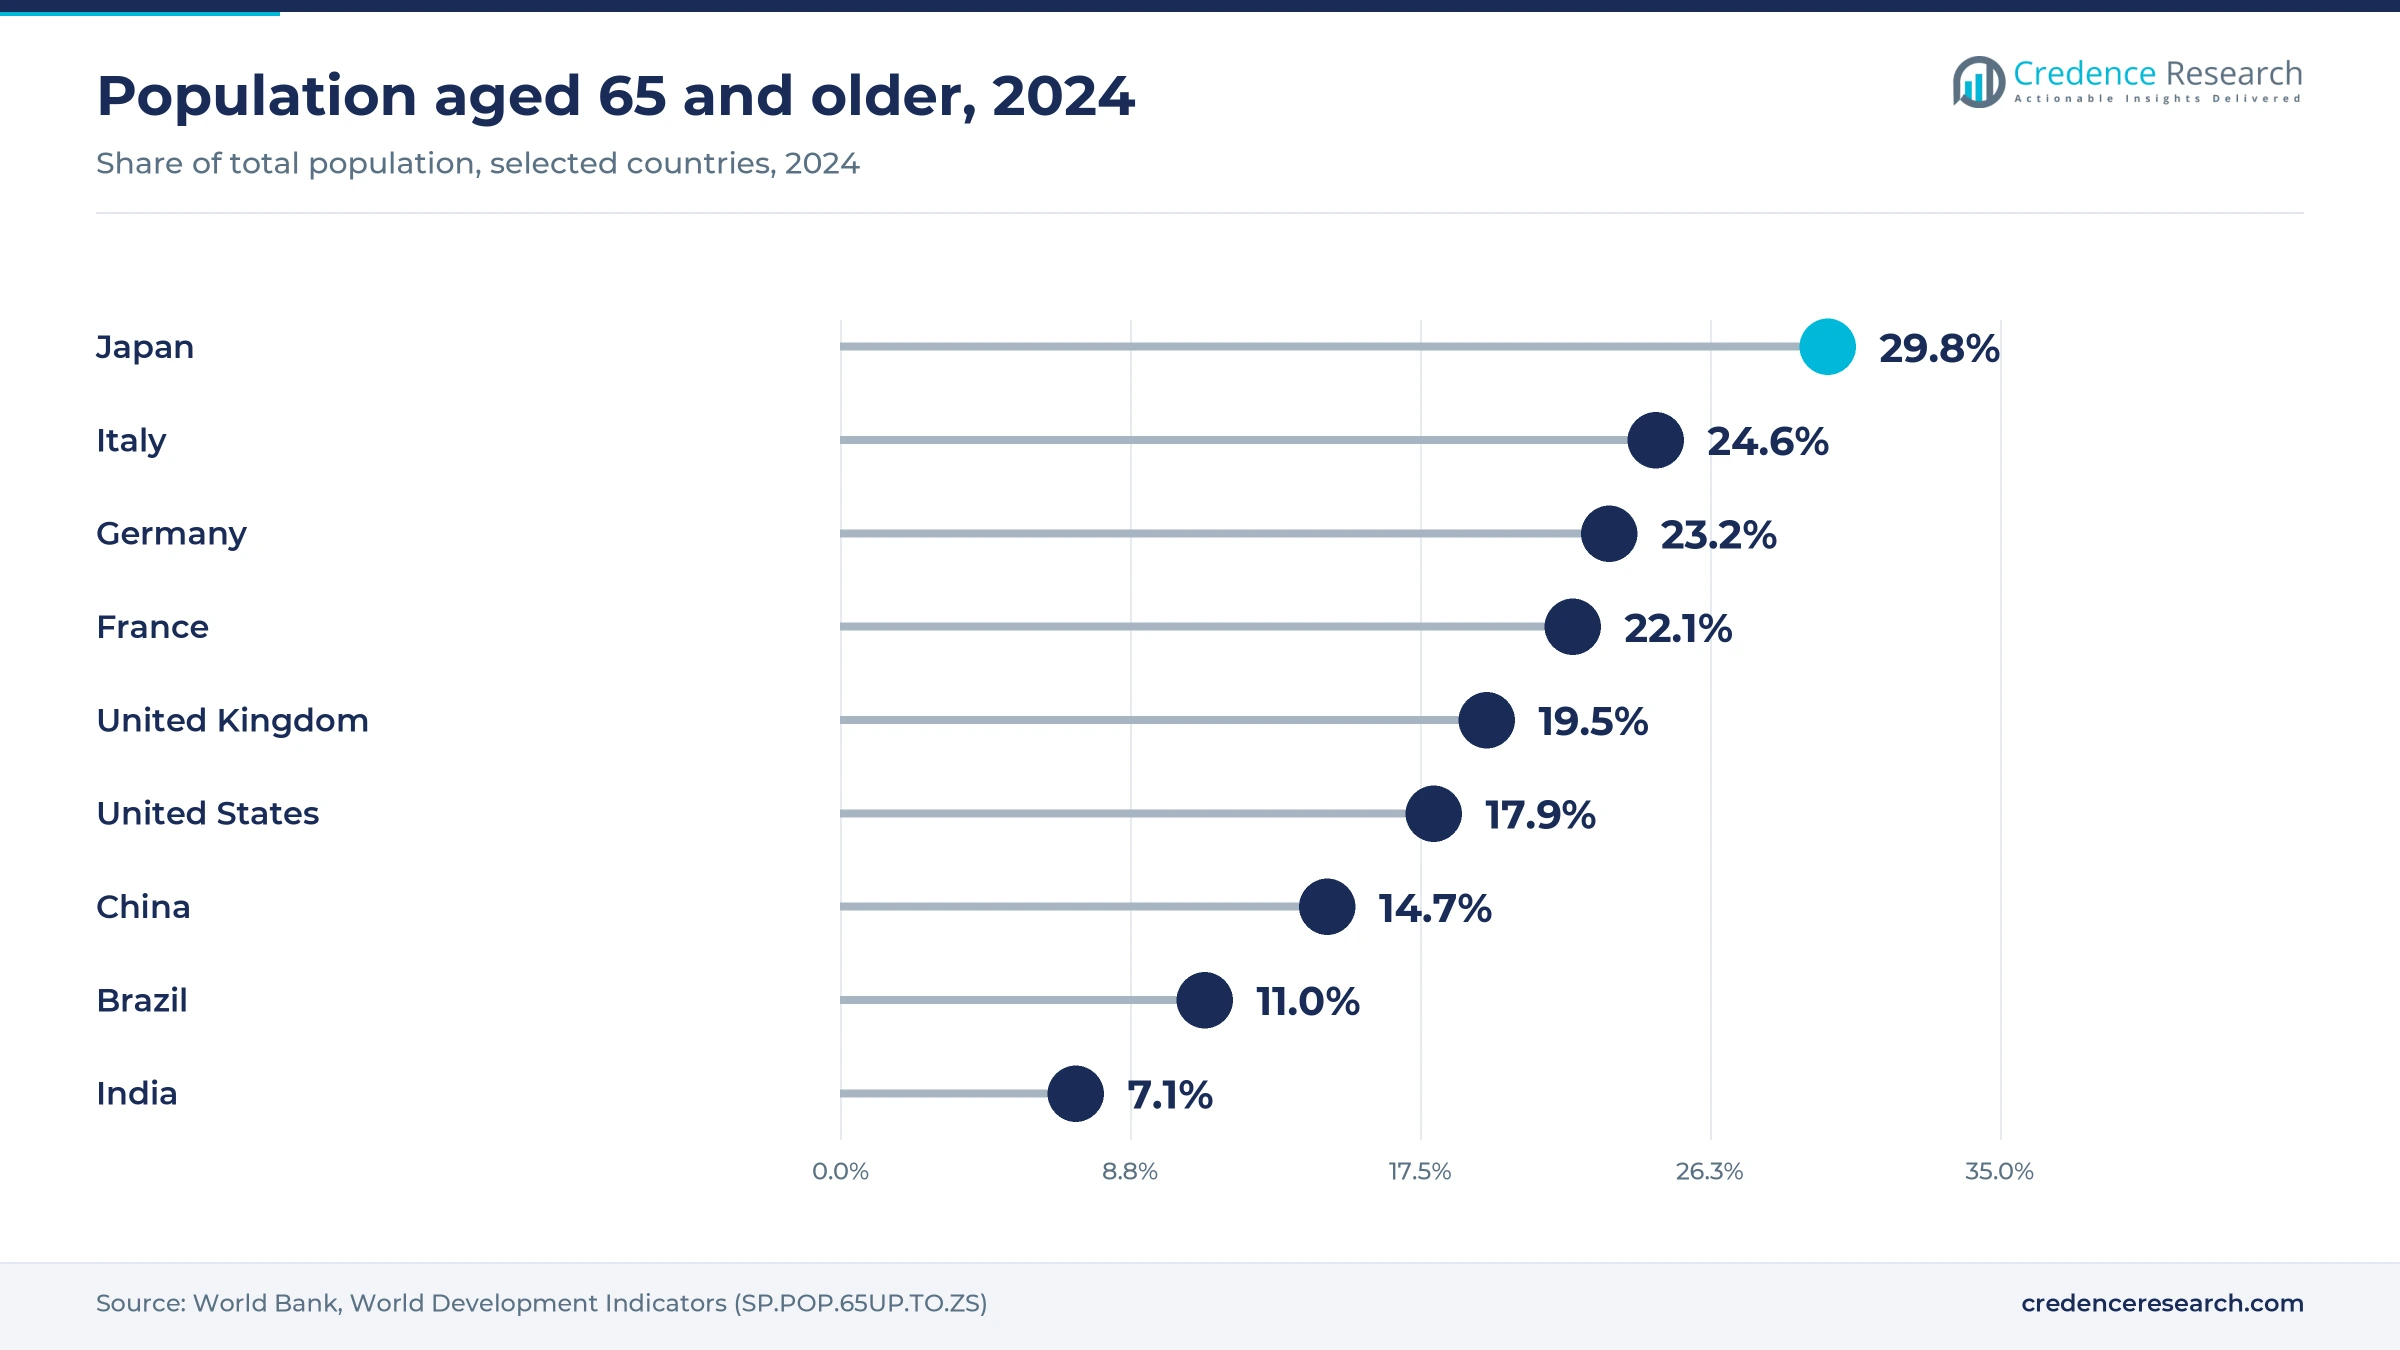
Aging populations widen restorative demand, because older adults keep more natural teeth but also need crowns, implants and dentures more often. The WHO reports that total tooth loss affects about 23% of people aged 60 or older, compared with almost 7% of adults aged 20 or older. Japan had 29.8% of residents aged 65 or older in 2024, and Italy had 24.6%, according to World Bank data. In turn, clinics in these countries invest in imaging and milling systems that support implant restorations.
How do public dental programs add new patients?
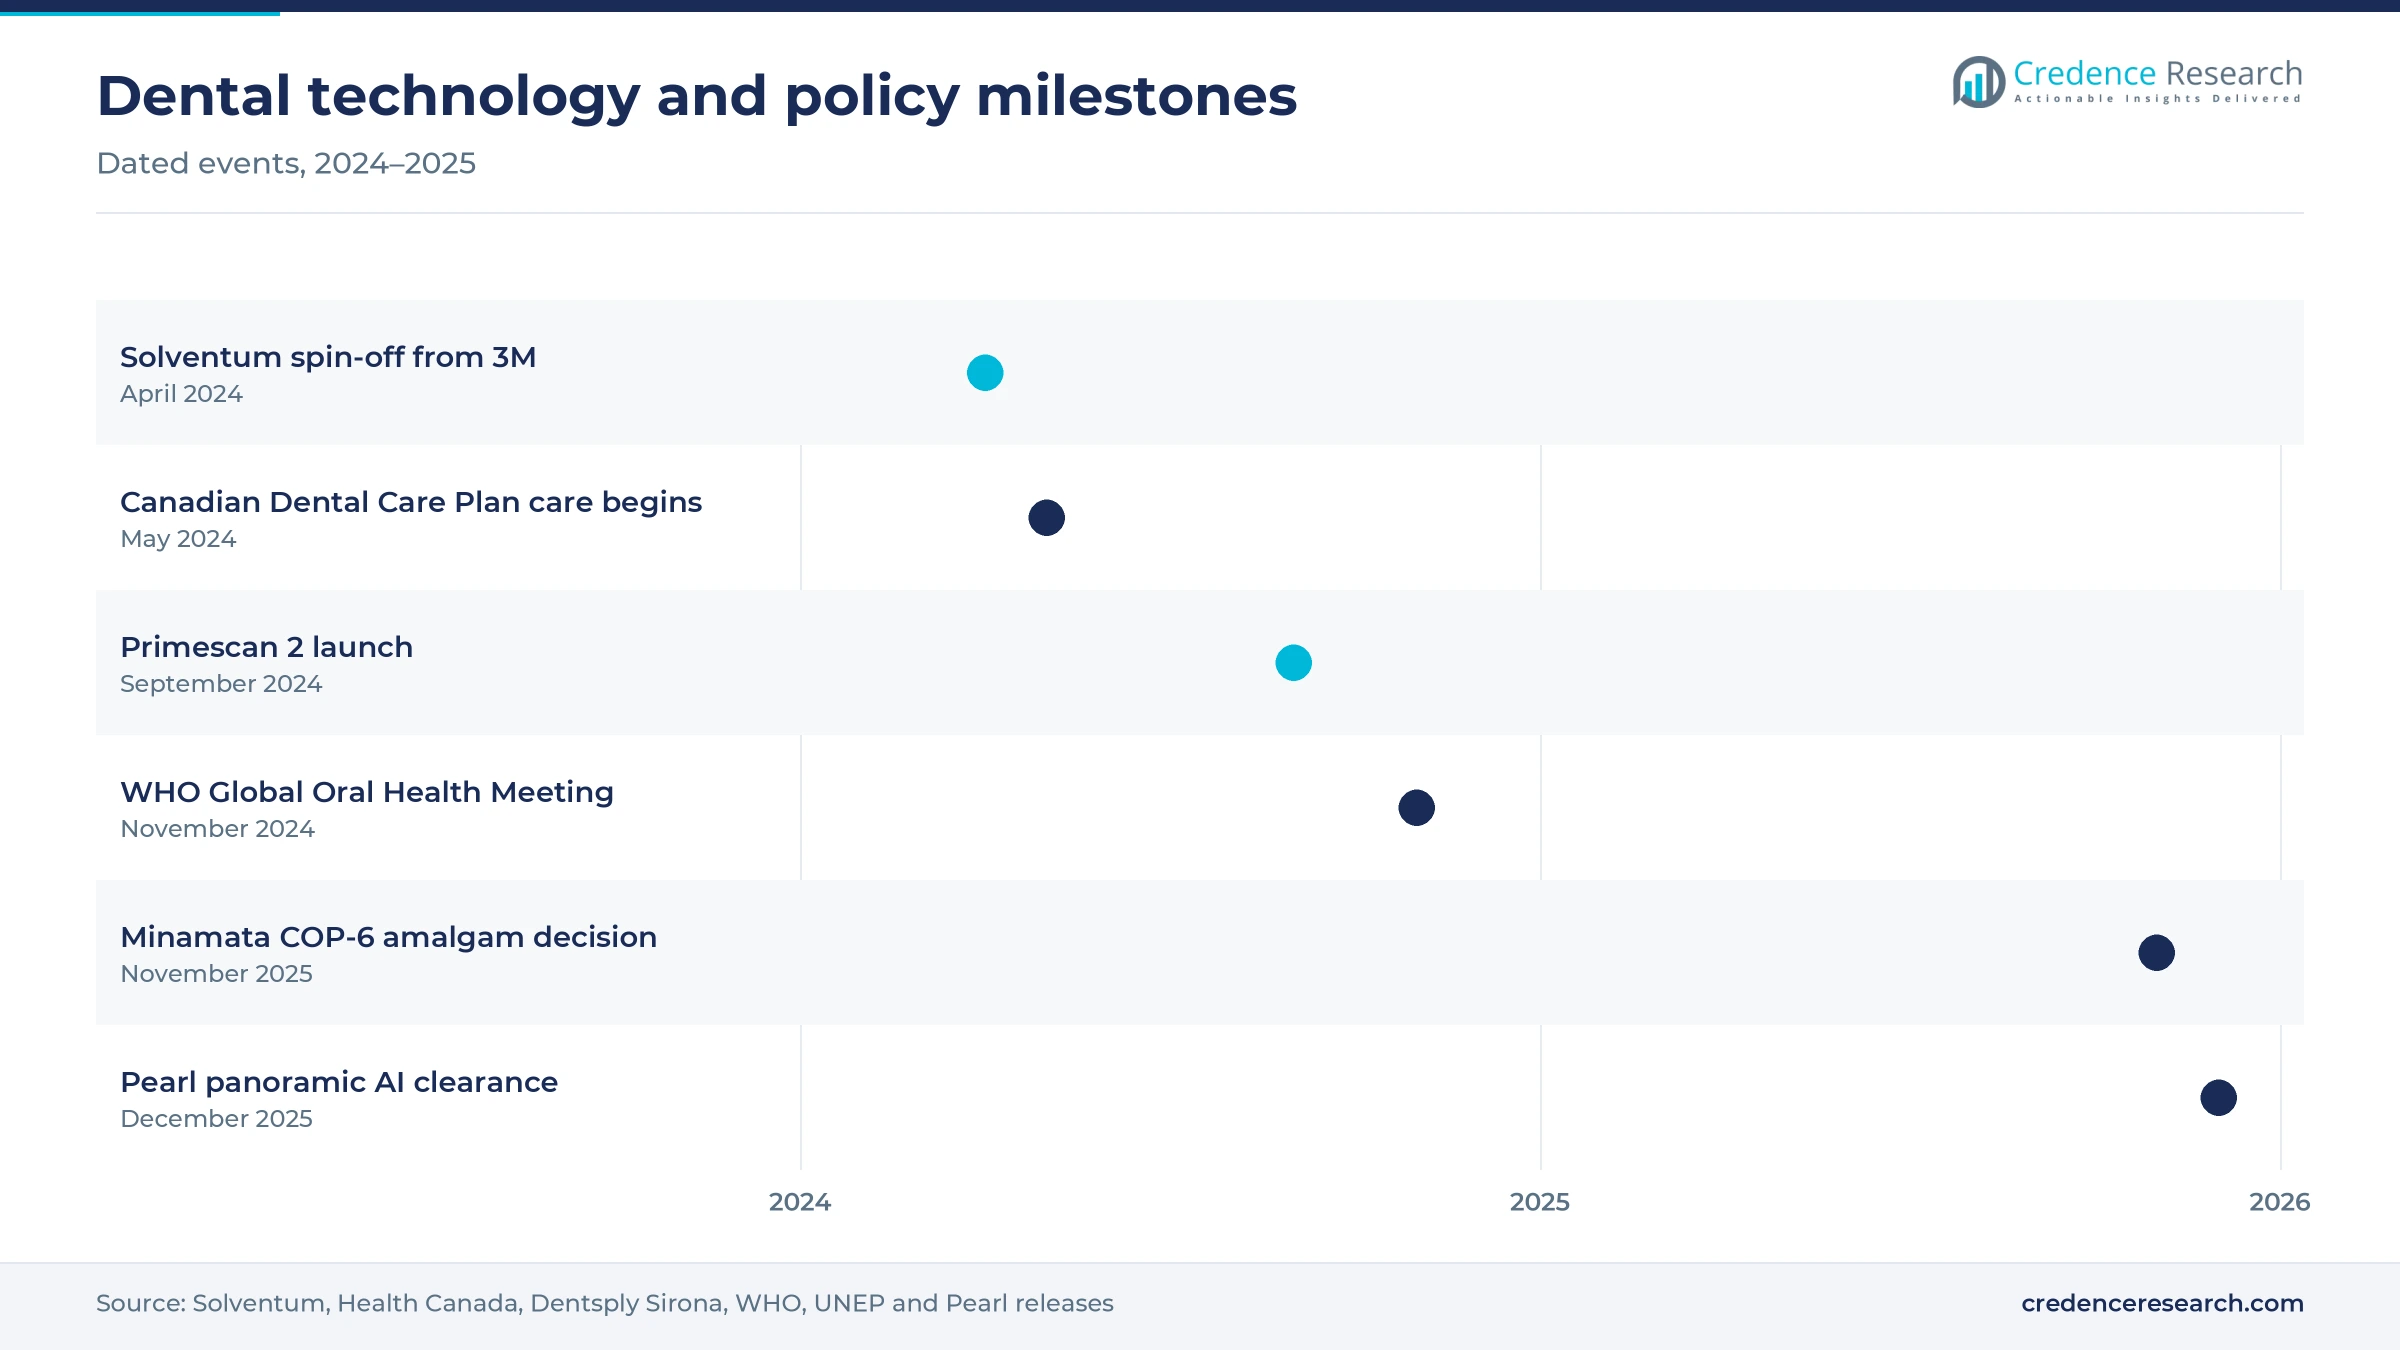
Public dental programs add new patients, because coverage brings people who previously avoided care into clinics. On May 1, 2024, about 1 million Canadian seniors became able to receive care under the Canadian Dental Care Plan, and more than 6,500 oral health providers had signed up by that date. Higher visit volumes require more chairs, handpieces and imaging units in participating practices. As a result, coverage expansions in Canada and elsewhere support equipment purchases over several years.
Why does the shift to digital dentistry lift spending?
The shift to digital dentistry lifts spending, because clinics replace film, plaster impressions and outside lab steps with connected systems. Digital intraoral scanners capture full-arch models in about a minute and send them directly to design software or partner labs. CAD/CAM units then mill crowns during a single visit to the clinic. In turn, practices that adopt one digital system often add imaging, milling and software from the same platform within 2 or three years.
Cloud scanning and AI imaging reshape clinic workflows
How is cloud-native scanning shifting clinic workflows?
Cloud-native scanning is shifting clinic workflows, because scans no longer need a dedicated computer next to the chair. In September 2024, Dentsply Sirona launched Primescan 2, a wireless intraoral scanner that works with any internet-connected device and stores data on its DS Core platform. A full-arch scan takes less than one minute, according to the company. As a result, clinics can share cases with labs and specialists without local servers or manual file transfers.
Why is AI image reading rising in dental practices?
Artificial intelligence image reading is rising, because software can flag decay and other findings on routine radiographs in seconds. In December 2025, Pearl received FDA clearance for panoramic X-ray detection with its Second Opinion software, which flags suspected caries, periapical radiolucencies and impacted third molars. Such tools raise the value of digital sensors and panoramic units already installed in clinics. In turn, imaging vendors increasingly bundle AI partners with new equipment.
Can the amalgam phase-out open a restorative opportunity?
The global amalgam phase-out opens a clear opening for restorative technology, because clinics must move to other filling methods. In November 2025, parties to the Minamata Convention agreed at COP-6 in Geneva to phase out dental amalgam by 2034. Composite and ceramic restorations need curing lights, isolation tools and often digital design for larger cases. As a result, equipment makers can sell CAD/CAM systems and curing devices to clinics that still rely on amalgam.
Where can makers win share in emerging markets?
Equipment makers have room to grow in Asia, Latin America and the Middle East, where many new private clinics are still furnishing their first operatories. Rising incomes and dental tourism bring more implant and cosmetic cases to these clinics. Companies that pair mid-priced chairs and imaging with financing and training can build loyalty early. As a result, value product lines and regional assembly have strong prospects in these markets over the next decade.
Equipment costs, staffing and rules slow clinic upgrades
Why do high system costs slow clinic upgrades?
High system costs slow upgrades, because cone beam CT units, CAD/CAM systems and laser platforms require large investments for small practices. Many solo dentists delay purchases until older units fail, especially when interest rates are high. Dealers and manufacturers therefore offer leasing and subscription models to spread payments. As a result, adoption of premium systems remains faster in group practices than in single-dentist clinics.
How do staffing gaps limit treatment capacity?
Shortages of dental hygienists, assistants and dentists in rural areas limit treatment capacity, because new chairs need trained staff to run them. Clinics that cannot hire enough team members leave operatories unused and postpone expansion. Training programs take years to expand even when demand is strong. In turn, equipment makers emphasize automation, simple interfaces and remote support to help smaller teams treat more patients.
Why do radiation and device rules add cost?
Radiation safety and device rules add cost, because imaging systems need registration, shielding checks and regular quality testing in most countries. Approval of new imaging or laser devices can take many months in each major market. Smaller makers must spread these costs across fewer units sold. As a result, regulatory work favors larger companies with established compliance teams and global service networks.
How do uneven insurance and out-of-pocket costs limit demand?
Uneven insurance coverage limits demand, because many adults pay for dental care out of pocket and delay treatment when budgets are tight. Public health systems often cover only basic dental services, which limits funding for advanced equipment in public clinics. Patients in low- and middle-income countries frequently skip restorative care. In turn, equipment demand depends heavily on private clinics in urban areas.
North America leads as Asia Pacific expands dental care
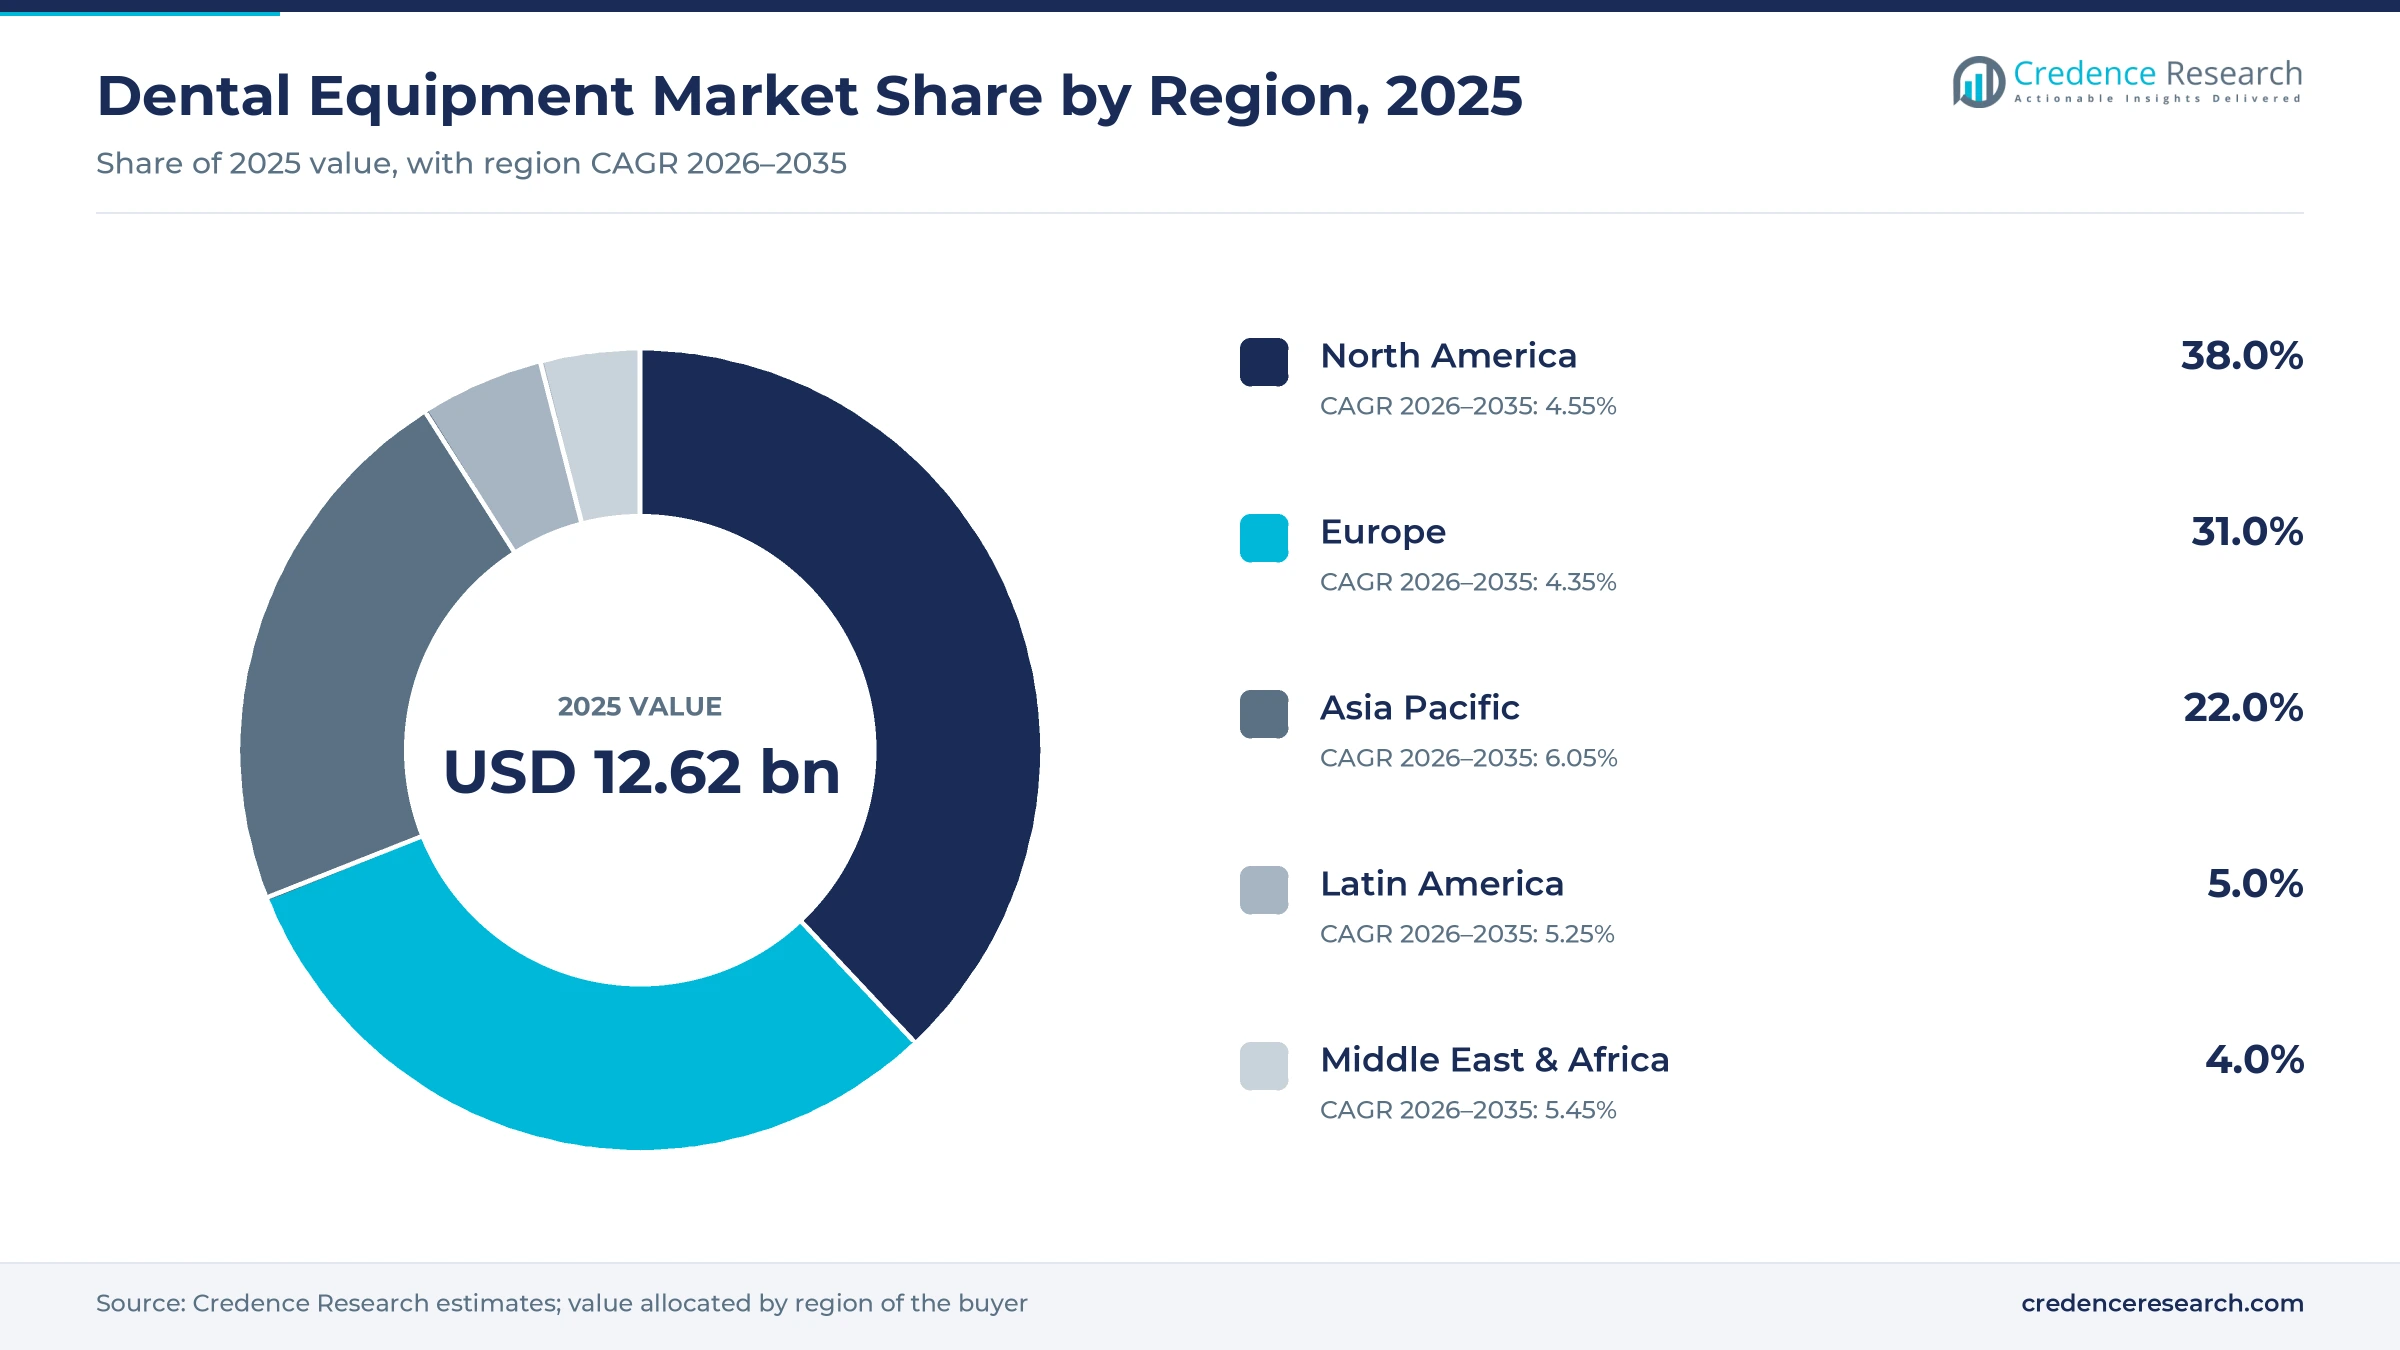
| Region | Value, 2025 (USD billion) | Share, 2025 | CAGR, 2026–2035 |
|---|---|---|---|
| North America | 4.79 | 38.0% | 4.55% |
| Europe | 3.91 | 31.0% | 4.35% |
| Asia Pacific | 2.78 | 22.0% | 6.05% |
| Latin America | 0.63 | 5.0% | 5.25% |
| Middle East & Africa | 0.50 | 4.0% | 5.45% |
Why does North America hold the largest regional share?
North America held a 38.0% share of 2025 value and grows at 4.55% a year through 2035. The United States drives this position, because group practices invest heavily in digital imaging, scanners and chairside milling. Canada adds new demand after the federal dental plan began serving seniors in May 2024. In addition, 17.9% of U.S. residents were 65 or older in 2024, according to World Bank data, which keeps restorative and implant demand strong across the region.
What shapes demand across Europe?
Europe held a 31.0% share of 2025 value and grows at 4.35% a year, the slowest pace of the five regions. Germany, France, Italy and the United Kingdom account for most spending, and Germany is home to several major chair, handpiece and imaging makers. People aged 65 and older made up 23.2% of Germany's population and 22.1% of France's in 2024. However, public reimbursement limits on advanced treatment keep price growth modest in several countries.
How fast is Asia Pacific adding dental capacity?
Asia Pacific held a 22.0% share of 2025 value and is the fastest-growing region at 6.05% a year. China and India are adding private clinic chains and implant centers, which bring digital imaging and CAD/CAM to new patients. South Korea hosts large implant makers such as Osstem, while Japan adds high-value demand from the oldest population among major economies. People aged 65 or older made up 14.7% of China's population in 2024, which points to rising restorative needs.
Where is Latin America adding demand?
Latin America held a 5.0% share of 2025 value and grows at 5.25% a year through 2035. Brazil and Mexico lead regional demand through large private clinic networks and dental tourism. Price-sensitive buyers favor mid-range chairs and imaging units with local service support.
What limits growth in the Middle East and Africa?
The Middle East and Africa held a 4.0% share of 2025 value and grows at 5.45% a year through 2035. Gulf states add higher-value demand from new private clinics and hospitals. Access in sub-Saharan Africa remains limited, because many countries have few dentists outside major cities.
Launches, clearances and policy moves since 2024
| Development | Status and market relevance |
|---|---|
| In May 2024, about 1 million Canadian seniors became able to receive care under the Canadian Dental Care Plan. | Live; more than 6,500 oral health providers had joined at launch |
| In September 2024, Dentsply Sirona launched Primescan 2, a cloud-native wireless intraoral scanner linked to DS Core. | Launched; full-arch scans take less than one minute |
| In March 2025, Dentsply Sirona presented Primescan 2 updates at IDS 2025 in Cologne, including integrated caries detection. | Presented in 2025; smart compression cuts bandwidth needs by up to 50% |
| In November 2025, parties to the Minamata Convention agreed at COP-6 to phase out dental amalgam by 2034. | Adopted; amended Annex A sets a global end date for amalgam use |
| In December 2025, Pearl received FDA clearance for its Second Opinion AI on panoramic X-rays. | Cleared; flags suspected caries, periapical radiolucencies and impacted third molars |
Imaging, scanning and software lead innovation
- Cone beam CT imaging gives dentists 3D views of bone and nerves, which supports safer implant placement and complex root canal work.
- Cloud-native intraoral scanning replaces plaster impressions with digital models that clinics share instantly with labs and specialists.
- Chairside CAD/CAM milling produces crowns and inlays during one visit, which reduces lab costs and repeat appointments for patients.
- AI radiograph analysis flags caries and other findings on routine images, which supports consistent diagnosis and patient communication.
- Dental lasers treat soft tissue with less bleeding, which supports periodontal care and minor surgery with faster healing.
Need a Custom Version of This Report?
Tailor the scope, geography, or segments to your exact requirements.
- Custom geography or segment scope
- Direct access to our analyst team
Digital platform makers compete on integrated workflows
Competition is led by companies that sell connected platforms linking imaging, scanning, design software and treatment units. Dentsply Sirona competes across chairs, imaging, scanners and CAD/CAM, and its DS Core cloud links these products. Envista Holdings and Danaher Corporation have long histories in imaging and treatment products, while Kavo Dental is known for handpieces and treatment units. Carestream Health supplies intraoral sensors and imaging software, and 3M dental products now sit within Solventum after the April 2024 spin-off. Canon, GE Healthcare, Philips Healthcare and Siemens Healthineers bring broad X-ray and CT expertise to dental and maxillofacial imaging. Osstem and BioHorizons focus on implant systems and related surgical tools, and DENTAURUM GmbH supplies orthodontic and laboratory products. As a result, buyers often favor suppliers that offer complete digital workflows, financing and local service under a single agreement.
Companies profiled and their roles in this market
| Company | Type | Role in the market |
|---|---|---|
| Dentsply Sirona | Diversified | Treatment centers, imaging, Primescan 2 scanners, CAD/CAM and DS Core software |
| Envista Holdings | Diversified | Imaging, implant and orthodontic product lines |
| Danaher Corporation | Diversified | Life science and diagnostics group with a history in dental imaging and products |
| Kavo Dental | Specialist | Handpieces and treatment units |
| Carestream Health | Imaging | Intraoral sensors, panoramic units and imaging software |
| 3M | Diversified | Dental materials and equipment, now within Solventum Dental Solutions |
| Canon | Imaging | X-ray and CT imaging technology |
| GE Healthcare | Imaging | X-ray and CT imaging systems |
| Philips Healthcare | Imaging | Diagnostic imaging and oral care technology |
| Siemens Healthineers | Imaging | X-ray and CT imaging systems |
| Osstem | Specialist | Implant systems, surgical kits and treatment units |
| BioHorizons | Specialist | Implant systems and regenerative products |
| DENTAURUM GmbH | Specialist | Orthodontic, implant and laboratory products |
Digital imaging and CAD/CAM set the growth pace
Credence Research's view is that digital imaging and CAD/CAM systems will set the pace of growth through 2035, because both reduce lab steps and repeat visits for patients. The overall market grows at 4.91% a year, supported by aging patients and new clinics in Asia Pacific. Chairs and handpieces keep a large replacement base, but price competition limits their value growth. Companies that combine hardware with cloud software, AI partners and financing will win the most new practices, while single-product suppliers face pressure from bundled platform deals.
How Credence Research sized dental clinic spending
The report uses 2025 as the base year and 2026 to 2035 as the forecast period. Market values come from the Credence Research model, which builds dental equipment spending by product, treatment, end user and region. Regional and segment splits are Credence Research estimates informed by World Health Organization and World Bank statistics, government and United Nations announcements, FDA clearances and company releases. No primary interviews or surveys were used in preparing this edition of the report.
Dental clinic technology outlook to 2035
By 2035, the dental equipment market is projected to reach USD 20.37 billion, with growth led by 3D imaging, digital scanning and chairside milling. Chairs will remain the largest product group, although replacement cycles keep their value growth moderate. North America keeps the highest spending per clinic, while Asia Pacific adds the most new practices and patients. The amalgam phase-out by 2034 will push more clinics toward digital restorative work. As a result, advantage will depend on software integration, financing options and service reach.
Frequently Asked Questions
How big is the global dental equipment market?
Which product leads the dental equipment market?
Which region leads dental equipment spending?
Which treatment area uses the most dental equipment?
How does the amalgam phase-out affect dental clinics?
What recent technology launches shaped the market?
Who are the leading dental equipment companies?
What restrains growth in dental equipment?
Table of Content
Chapter 1 Market Segmentation
- 1.1 Segmentation Framework
- 1.1.1 Product and Service Classification
- 1.1.2 Application and End-Use Classification
- 1.1.3 Technology and Solution Classification
- 1.1.4 Customer and Distribution Channel Classification
- 1.1.5 Geographic Segmentation
- 1.1.6 Market Segment Definitions and Boundaries
- 1.2 By Product
- 1.2.1 Digital X-ray Units
- 1.2.2 Dental Lasers
- 1.2.3 Cone Beam CT Systems
- 1.2.4 Cast Machine
- 1.2.5 Electrosurgical Equipment
- 1.2.6 CAD/CAM
- 1.2.7 Chairs
- 1.2.8 Hand Piece
- 1.2.9 Others
- 1.3 By Treatment
- 1.3.1 Orthodontic
- 1.3.2 Endodontic
- 1.3.3 Periodontic
- 1.3.4 Prosthodontic
- 1.4 By End User
- 1.4.1 Dental Hospitals and Clinics
- 1.4.2 Academic and Research Institutes
- 1.4.3 Others
Chapter 2 Introduction
- 2.1 Report Objectives and Scope
- 2.2 Product Definition and Industry Terminology
- 2.3 Market Inclusions and Exclusions
- 2.4 Research Process
- 2.4.1 Primary Research and Expert Interviews
- 2.4.2 Secondary Research and Source Review
- 2.4.3 Top-Down and Bottom-Up Estimation
- 2.4.4 Data Triangulation and Verification
- 2.5 Market Size Measurement Basis
- 2.5.1 2025: USD 12.62 billion → 2035: USD 20.37 billion
- 2.6 Historical and Forecast Reference Periods
- 2.6.1 Historical Period: 2018-2025
- 2.6.2 Base Year: 2025
- 2.6.3 Forecast Period: 2025-2035
- 2.7 Research Assumptions and Limitations
Chapter 3 Executive Summary
- 3.1 Market Snapshot and Key Findings
- 3.2 Base-Year Market Size, 2025
- 3.3 Forecast Market Size, 2035
- 3.4 Revenue and Volume Growth Outlook
- 3.5 Key Demand and Supply Indicators
- 3.6 Leading Market Segments
- 3.7 Fastest-Growing Market Opportunities
- 3.8 Regional Performance Highlights
- 3.9 Technology and Industry Transformation
- 3.10 Competitive Landscape Summary
- 3.11 Analyst View and Strategic Implications
Chapter 4 Global Dental Equipment Market Trends and Developments
- 4.1 Historical Industry Development, 2018-2025
- 4.2 Recent Market Trends and Developments
- 4.3 Demand and Customer Behavior Trends
- 4.4 Technology and Product Innovation
- 4.5 Artificial Intelligence, Automation and Digitalization
- 4.6 Local Manufacturing and Supply Chain Realignment
- 4.7 Industry Partnerships, Mergers and Acquisitions
- 4.8 Sustainability and Circular Economy Developments
- 4.9 Government and Private Sector Investment Trends
- 4.10 Emerging Business Models and Commercialization
- 4.11 Industry Developments and Announcements
Chapter 5 Global Dental Equipment Market Production, Supply and Demand Analysis
- 5.1 Demand Trend and Consumption Analysis, 2018-2025
- 5.2 Demand Forecast, 2025-2035
- 5.3 Production and Output Trend, 2018-2025
- 5.4 Production and Output Forecast, 2025-2035
- 5.5 Installed Capacity and Capacity Utilization
- 5.6 Company-Wise Production Plants and Statistics
- 5.6.1 Installed Production Capacity
- 5.6.2 Actual Production
- 5.6.3 Planned Capacity and Expansion Targets
- 5.7 Supply Chain Structure and Procurement Trends
- 5.8 Supply-Demand Gap and Bottlenecks
- 5.9 Import Dependence and Sourcing Structure
- 5.10 Contract Manufacturing and Outsourcing
- 5.11 Regional Supply and Demand Concentration
Chapter 6 Global Dental Equipment Market Pricing Analysis
- 6.1 Pricing Structure and Measurement
- 6.2 Historical Pricing Trends, 2018-2025
- 6.3 Pricing Outlook, 2025-2035
- 6.4 Average Selling Price and Unit Economics
- 6.5 Pricing by Product and Market Segment
- 6.6 Geographic Pricing Differences
- 6.7 Key Input, Energy, Labor and Logistics Costs
- 6.8 Contract Pricing and Purchasing Models
- 6.9 Pricing Sensitivity and Competitive Positioning
- 6.10 Price, Margin and Profitability Implications
Chapter 7 Global Dental Equipment Market Dynamics
- 7.1 Market Growth Drivers
- 7.1.1 Demand-Side Drivers
- 7.1.2 Technology and Innovation Drivers
- 7.1.3 Infrastructure and Investment Drivers
- 7.1.4 Regulatory and Policy Drivers
- 7.2 Market Restraints
- 7.2.1 Cost and Affordability Constraints
- 7.2.2 Technology and Adoption Barriers
- 7.2.3 Supply Chain and Operational Constraints
- 7.3 Market Challenges
- 7.3.1 Competitive Pressure and Margin Erosion
- 7.3.2 Skills, Infrastructure and Implementation Gaps
- 7.4 Emerging Market Opportunities
- 7.5 Market Dynamics Impact and Time-Horizon Assessment
Chapter 8 Global Dental Equipment Value Chain Analysis
- 8.1 Industry Value Chain Overview
- 8.2 Upstream Suppliers and Critical Inputs
- 8.3 Technology and Component Providers
- 8.4 Manufacturing or Service Delivery
- 8.5 Distribution, Channel Partners and Integrators
- 8.6 Downstream Applications and End Users
- 8.7 Value Addition and Profit Pools
- 8.8 Vertical Integration and Outsourcing
- 8.9 Supplier Concentration and Risk
- 8.10 Supply Chain Localization and Resilience
Chapter 9 Global Dental Equipment Market Regulations and Policies
- 9.1 Relevant Laws, Standards and Compliance Frameworks
- 9.2 Product, Service, Safety and Quality Requirements
- 9.3 Government Policies, Incentives and Subsidies
- 9.4 Imports, Exports and Trade Barriers
- 9.5 Public Procurement and Local Content Requirements
- 9.6 Environmental and Sustainability Compliance
- 9.7 Upcoming Policy Changes and Market Implications
Chapter 10 Global Dental Equipment Market Hotspots and Opportunities
- 10.1 Market Opportunity Mapping and Growth Hotspots
- 10.2 High-Growth Applications and Customer Groups
- 10.3 Underserved Markets and White-Space Opportunities
- 10.4 Emerging Technology and Product Opportunities
- 10.5 New Capacity and Investment Hotspots
- 10.6 Market Entry and Expansion Opportunities
- 10.7 Distribution and Partnership Opportunities
- 10.8 Near-Term and Long-Term Commercial Potential
- 10.9 Opportunity Attractiveness and Execution Risks
Chapter 11 Global Dental Equipment Market Outlook, 2025-2035
- 11.1 Market Size and Analysis
- 11.1.1 Revenue (Market Measurement: 2025: USD 12.62 billion → 2035: USD 20.37 billion)
- 11.1.2 Market Volume and Quantity Sold
- 11.1.3 Historical Market Size, 2018-2025
- 11.1.4 Base-Year Market Size, 2025
- 11.2 Market Forecast, 2025-2035
- 11.2.1 Revenue Forecast to 2035
- 11.2.2 Volume Forecast to 2035
- 11.2.3 CAGR and Year-on-Year Growth
- 11.2.4 Incremental Revenue Opportunity
- 11.3 Forecast Assumptions and Scenario Analysis
- 11.3.1 Base-Case Forecast
- 11.3.2 Optimistic and Conservative Scenarios
- 11.3.3 Technology, Pricing and Policy Sensitivities
- 11.4 Market Attractiveness and Growth Outlook
Chapter 12 Global Dental Equipment Market Segmentation and Outlook
- 12.1 Segmentation Summary and Market Shares, 2025
- 12.2 Largest and Fastest-Growing Segments
- 12.3 By Product - Market Size and Forecast, 2025-2035
- 12.3.1 Segment Definition and Scope
- 12.3.2 Historical Market Size, 2018-2025
- 12.3.3 Revenue Forecast, 2025-2035
- 12.3.4 Volume Forecast, 2025-2035
- 12.3.5 Base-Year Market Share, 2025
- 12.3.6 Segment CAGR and Growth Drivers
- 12.3.7 Subsegment Market Size and Forecast
- 12.3.7.1 Digital X-ray Units
- 12.3.7.2 Dental Lasers
- 12.3.7.3 Cone Beam CT Systems
- 12.3.7.4 Cast Machine
- 12.3.7.5 Electrosurgical Equipment
- 12.3.7.6 CAD/CAM
- 12.3.7.7 Chairs
- 12.3.7.8 Hand Piece
- 12.3.7.9 Others
- 12.3.8 Subsegment Pricing and Adoption Trends
- 12.3.9 Leading Suppliers and Competition
- 12.3.10 Regional Demand and Opportunities
- 12.4 By Treatment - Market Size and Forecast, 2025-2035
- 12.4.1 Segment Definition and Scope
- 12.4.2 Historical Market Size, 2018-2025
- 12.4.3 Revenue Forecast, 2025-2035
- 12.4.4 Volume Forecast, 2025-2035
- 12.4.5 Base-Year Market Share, 2025
- 12.4.6 Segment CAGR and Growth Drivers
- 12.4.7 Subsegment Market Size and Forecast
- 12.4.7.1 Orthodontic
- 12.4.7.2 Endodontic
- 12.4.7.3 Periodontic
- 12.4.7.4 Prosthodontic
- 12.4.8 Subsegment Pricing and Adoption Trends
- 12.4.9 Leading Suppliers and Competition
- 12.4.10 Regional Demand and Opportunities
- 12.5 By End User - Market Size and Forecast, 2025-2035
- 12.5.1 Segment Definition and Scope
- 12.5.2 Historical Market Size, 2018-2025
- 12.5.3 Revenue Forecast, 2025-2035
- 12.5.4 Volume Forecast, 2025-2035
- 12.5.5 Base-Year Market Share, 2025
- 12.5.6 Segment CAGR and Growth Drivers
- 12.5.7 Subsegment Market Size and Forecast
- 12.5.7.1 Dental Hospitals and Clinics
- 12.5.7.2 Academic and Research Institutes
- 12.5.7.3 Others
- 12.5.8 Subsegment Pricing and Adoption Trends
- 12.5.9 Leading Suppliers and Competition
- 12.5.10 Regional Demand and Opportunities
- 12.6 Segment Growth Comparison
- 12.7 Segment Attractiveness and Priority Matrix
Chapter 13 Global Dental Equipment End-Use and Application Market Outlook
- 13.1 End-Use Industry and Customer Demand Structure
- 13.2 Leading Applications and Customer Groups
- 13.3 End-Use Market Size, Share and Forecast
- 13.4 Major End-Use Industry Deep Dives
- 13.4.1 Customer Requirements and Use Cases
- 13.4.2 Demand and Replacement Cycles
- 13.4.3 Technical and Regulatory Considerations
- 13.4.4 Purchasing and Procurement Models
- 13.4.5 Leading Vendors and Distribution Channels
- 13.4.6 Forecast and Commercial Opportunities
- 13.5 Emerging Applications and Cross-Segment Demand
- 13.6 End-Use Industry Investment Priorities
Chapter 14 Global Dental Equipment Geographic Market Outlook, 2025-2035
- 14.1 Regional Market Size and Share, 2025
- 14.2 Regional Market Forecast, 2025-2035
- 14.3 Regional Pricing, Production and Demand Differences
- 14.4 North America
- 14.4.1 United States
- 14.4.2 Canada
- 14.4.3 Mexico
- 14.5 Europe
- 14.5.1 Germany
- 14.5.2 France
- 14.5.3 Italy
- 14.5.4 United Kingdom
- 14.5.5 Spain
- 14.5.6 Poland
- 14.5.7 Russia
- 14.5.8 Netherlands
- 14.5.9 Belgium
- 14.5.10 Sweden
- 14.5.11 Denmark
- 14.5.12 Norway
- 14.5.13 Rest of Europe
- 14.6 Asia Pacific
- 14.6.1 China
- 14.6.2 India
- 14.6.3 Japan
- 14.6.4 South Korea
- 14.6.5 Thailand
- 14.6.6 Indonesia
- 14.6.7 Vietnam
- 14.6.8 Malaysia
- 14.6.9 Australia
- 14.6.10 Rest of Asia Pacific
- 14.7 Latin America
- 14.7.1 Brazil
- 14.7.2 Argentina
- 14.7.3 Colombia
- 14.7.4 Chile
- 14.7.5 Rest of Latin America
- 14.8 Middle East
- 14.8.1 Saudi Arabia
- 14.8.2 United Arab Emirates
- 14.8.3 Turkey
- 14.8.4 Israel
- 14.8.5 Iran
- 14.8.6 Rest of the Middle East
- 14.9 Africa
- 14.9.1 South Africa
- 14.9.2 Egypt
- 14.9.3 Nigeria
- 14.9.4 Morocco
- 14.9.5 Rest of Africa
- 14.10 Regional Investment, Policy and Supply Chain Differences
- 14.11 Regional Competitive Landscape
- 14.12 Geographic Growth Hotspots
Chapter 15 Global Dental Equipment Technology, Innovation and Sustainability Outlook
- 15.1 Technology Landscape and Maturity
- 15.2 Product, Process and Service Innovation
- 15.3 AI, Automation and Digital Tools in the Industry
- 15.4 Technology Adoption and Performance Benchmarking
- 15.5 Innovation Pipeline and R&D Investment
- 15.6 Patent and Intellectual Property Trends
- 15.7 Energy Efficiency and Resource Management
- 15.8 Sustainability, Recycling and Circularity
- 15.9 Technology Roadmap, 2025-2035
- 15.10 Risks of Obsolescence and Technology Substitution
Chapter 16 Global Dental Equipment Market Key Strategic Imperatives
- 16.1 Growth and Market Entry Priorities
- 16.2 High-Return Products and Segments
- 16.3 Pricing, Profitability and Cost Optimization
- 16.4 Technology Investment and Product Differentiation
- 16.5 Supply Chain Localization and Resilience
- 16.6 Distribution and Customer Acquisition
- 16.7 Partnership, Acquisition and Capacity Strategy
- 16.8 Regional Expansion Priorities
- 16.9 Short-, Medium- and Long-Term Actions
Chapter 17 Competition Outlook
- 17.1 Industry Competition Characteristics
- 17.2 Market Structure and Concentration
- 17.3 Market Share and Competitive Positioning, 2025
- 17.4 Company-Wise Revenue and Product Benchmarking
- 17.5 Production and Service Capacity Benchmarking
- 17.6 Technology, Pricing and Differentiation
- 17.7 Regional Footprint and Distribution Strength
- 17.8 Mergers, Acquisitions and Strategic Alliances
- 17.9 New Entrants and Competitive Threats
- 17.10 Porter's Five Forces and Industry Attractiveness
- 17.11 Competitive Outlook, 2025-2035
Chapter 18 Company Profiles
- 18.1 Company Coverage and Selection Criteria
- 18.2 3M
- 18.2.1 Business Description
- 18.2.2 Company Ownership and Geographic Presence
- 18.2.3 Product and Service Portfolio
- 18.2.4 Manufacturing and Operating Footprint
- 18.2.5 Production Capacity and Expansion Plans
- 18.2.6 Financial Performance and Investment
- 18.2.7 Market Share and Competitive Position
- 18.2.8 Technology and Innovation Capabilities
- 18.2.9 Strategic Alliances or Partnerships
- 18.2.10 Recent Developments
- 18.2.11 Growth Strategy and Outlook
- 18.3 Canon
- 18.4 Carestream Health
- 18.5 GE Healthcare
- 18.6 Dentsply Sirona
- 18.7 Philips Healthcare
- 18.8 Danaher Corporation
- 18.9 Osstem
- 18.10 Siemens Healthineers
- 18.11 Kavo Dental
- 18.12 Envista Holdings
- 18.13 BioHorizons
- 18.14 DENTAURUM GmbH
- 18.15 Other Relevant Market Participants
Note: Every listed company is profiled on the structure shown under the first company. The company list is preliminary and may change based on research findings, market developments, data availability and client requirements.
Chapter 19 Disclaimer
- 19.1 Research and Forecast Disclaimer
- 19.2 Data Source and Estimation Limitations
Note: The depth of individual sections depends on data availability for this market. Volume, capacity, trade and other unit-based metrics are included where applicable.

