Market Overview
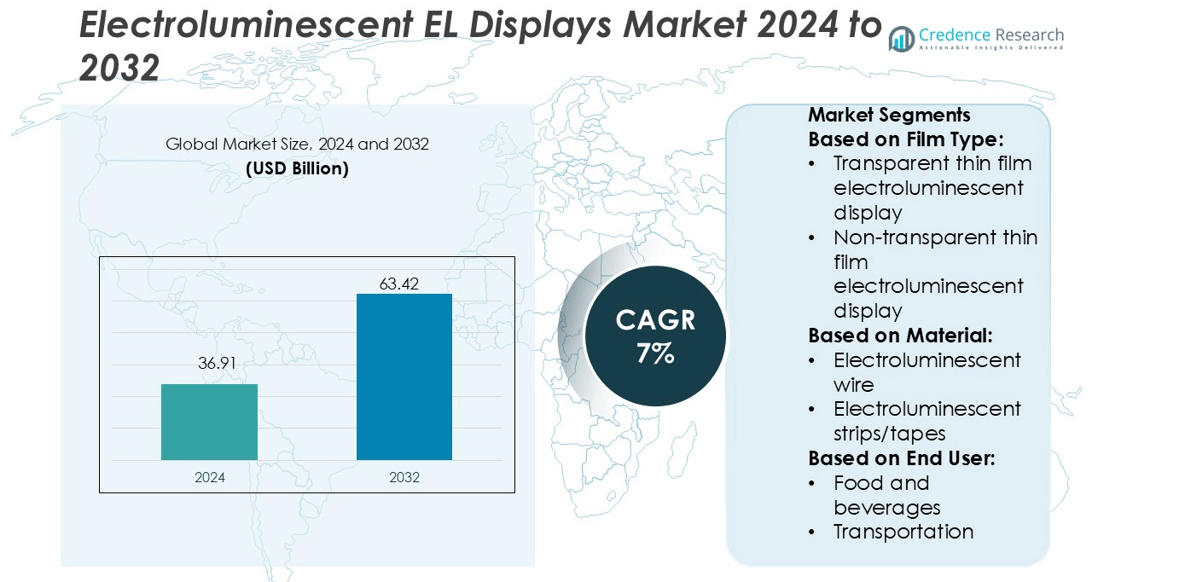
Electroluminescent EL Displays Market size was valued USD 36.91 billion in 2024 and is anticipated to reach USD 63.42 billion by 2032, at a CAGR of 7% during the forecast period.
| REPORT ATTRIBUTE |
DETAILS |
| Historical Period |
2020-2023 |
| Base Year |
2024 |
| Forecast Period |
2025-2032 |
| Electroluminescent (EL) Displays Market Size 2024 |
USD 36.91 billion |
| Electroluminescent (EL) Displays Market, CAGR |
7% |
| Electroluminescent (EL) Displays Market Size 2032 |
USD 63.42 billion |
The electroluminescent (EL) displays market currently include Lumineq, EL International Ltd., Shanghai Keyan Phosphor Technology Co., Ltd. (KPT), LumaMedia, intl, Orbit Electronics Group, Materiability Research Group, Nejilock Technology Pte Ltd, Technomark, Inc., Nixology.uk and Printed Electronics Ltd. These firms invest in advanced manufacturing, materials innovation and global expansion to gain competitive advantage. Regionally, the Asia Pacific region takes the largest share of the global market at 45%, driven by strong electronics production, rapid consumer adoption and supportive government policies.
Market Insights
- The electroluminescent (EL) displays market was valued at USD 36.91 billion in 2024 and is expected to reach USD 63.42 billion by 2032, growing at a CAGR of 7% during the forecast period.
- Growth is driven by demand for thin, flexible, and energy-efficient displays in automotive, consumer electronics, and industrial applications, as well as increasing adoption in wearable devices and smart packaging.
- Market trends include rising use of transparent and flexible EL films, integration with IoT and sensors, and expansion of EL displays into smart textiles, automotive dashboards, and augmented reality applications.
- The market is competitive with key players such as Lumineq, EL International Ltd., Shanghai Keyan Phosphor Technology Co., Ltd. (KPT), LumaMedia, intl, Orbit Electronics Group, Materiability Research Group, Nejilock Technology Pte Ltd, Technomark, Inc., Nixology.uk, and Printed Electronics Ltd investing in innovation, partnerships, and regional expansion.
- Asia-Pacific leads the regional market with 45% share, supported by strong electronics manufacturing, high consumer adoption, and government incentives, while automotive and consumer electronics segments hold the largest share globally.
Access crucial information at unmatched prices!
Request your sample report today & start making informed decisions powered by Credence Research Inc.!
Download Sample
Market Segmentation Analysis:
By Film Type
Transparent thin-film electroluminescent (EL) displays dominate the film-type segment, capturing around 55% of the market. They are increasingly adopted in applications such as smart windows, augmented-reality devices, and see-through dashboards where visibility and transparency are critical. Growth is fueled by rising demand for energy-efficient displays, flexible form factors, and advances in transparent electrode technologies. Non-transparent thin-film EL displays serve cost-sensitive applications and conventional instrumentation, offering durability and simpler manufacturing. While their adoption is slower, they remain relevant in markets that prioritize affordability over advanced features.
- For instance, Lumineq’s TASEL® transparent EL displays operate with an active viewing height (AVH) of up to 108 mm (e.g., in the ELT256.120.90 model) while maintaining a typical transparency level of between 73% and 80%. Brightness outputs vary by product and driving condition, generally ranging from 75 candela per square meter (cd/m²) in standard mode to over 1000 cd/m² in high-brightness configurations.
By Material
In the material-based segmentation, electroluminescent panels are the leading sub-segment with roughly 48% market share. They are widely used in large-format displays, architectural signage, and automotive instrument clusters due to improved brightness, uniformity, and energy efficiency. Roll-to-roll manufacturing techniques have reduced production costs, making panels more accessible for commercial and industrial applications. Electroluminescent wires and strips/tapes serve specialized applications such as wearable devices, decorative lighting, and flexible electronics. Although their market share is smaller, they continue to grow steadily as demand for compact, flexible EL solutions rises.
- For instance, Orbit Electronics Group’s Rugged EL displays operate from –40 °C to +71 °C without performance degradation, as documented in the company’s EL product brochure.
By End User
The automotive sector dominates the end-user segment, holding approximately 30% of the market. This growth is driven by increased adoption of digital dashboards, heads-up displays, ambient interior lighting, and advanced infotainment interfaces. OEMs are integrating EL technology to meet electrification, power efficiency, and aesthetic requirements. Other end-users, including food and beverages, transportation, defense, textile, and various industrial applications, adopt EL displays in lower volumes. These segments rely on EL solutions for advertising panels, safety indicators, and specialized equipment, contributing to gradual but steady market expansion.
Key Growth Drivers
Demand for Thin and Flexible Displays
The market for electroluminescent (EL) displays is being propelled by growing demand for thin and flexible display solutions. These displays are increasingly integrated into wearable electronics, curved dashboards, and smart packaging, where traditional rigid displays cannot fit. Advancements in flexible substrates and transparent electrode technologies allow roll-to-roll manufacturing, enabling high-quality, large-volume production. Consumers and manufacturers favor lightweight, compact designs that offer seamless integration with devices. This driver also encourages innovation in new form factors, supporting growth in both consumer and industrial applications.
- For instance, Nejilock lists on its website that its EL panes can reach a finished thickness of 0.25 mm and be bent into various shapes. They are described as ‘Paper Thin – typically between 0.25 mm and 0.5 mm thick.
Energy Efficiency and Sustainability
Energy efficiency is a key growth factor for EL displays, as they consume less power compared to LCD or OLED alternatives. This makes them ideal for battery-powered devices, automotive dashboards, portable instruments, and wearable electronics, where energy conservation is critical. Reduced power consumption not only lowers operating costs but also aligns with global sustainability trends. Manufacturers are increasingly adopting EL displays to meet environmental regulations and consumer preference for eco-friendly solutions, creating a strong incentive for broader deployment across multiple sectors.
- For instance, Nixology’s ‘Smart Socket’ driving modules are used in EL display projects to switch a 200-volt, 500-hertz AC supply to multiple EL segments. These modules typically use a microcontroller enabling control via 5-volt logic and a serial interface operating at 9600 baud, as detailed in the company’s general project write-ups.
Expansion Across Industry Verticals
EL displays are expanding beyond consumer electronics into automotive, defense, transportation, and textile industries. They are utilized in rugged instrument panels, heads-up displays, smart textiles, and decorative lighting, benefiting from their durability, ambient visibility, and design versatility. Adoption is further encouraged by automotive electrification, rising demand for interactive displays, and growing interest in innovative branding and packaging solutions. Cross-sector penetration broadens the market’s addressable base, creating opportunities for manufacturers to develop specialized EL solutions tailored to diverse industrial requirements.
Key Trends & Opportunities
Integration into Wearables and Smart Packaging
The wearable electronics and smart packaging markets offer significant opportunities for EL displays. Flexible EL films are embedded in clothing, wrist-wear, and interactive packaging surfaces where conventional displays cannot be applied. This integration enables interactive branding, enhanced consumer engagement, and novel product designs. Companies are leveraging this trend to differentiate products, drive sales, and explore niche markets in personal electronics, consumer goods, and luxury packaging. Rising consumer interest in connected devices further supports EL adoption in these emerging applications.
- For instance, DRR USA EV Safari 4×4 is an all-electric All-Terrain Vehicle (ATV). It is designed for off-road use, including trails, farms, and job sites, and is noted for its silent operation and zero emissions.
Transparent and See-Through Displays
Transparent EL displays are increasingly used in automotive windshields, augmented reality devices, and architectural installations. Their thin transparent electrodes allow see-through visuals, supporting augmented experiences, interactive dashboards, and premium designs. As production processes improve and costs decline, adoption is expanding in high-end consumer and industrial applications. Transparent EL displays provide a competitive advantage in design-focused industries, offering both functional and aesthetic value while opening opportunities in emerging AR and smart interface markets.
- For instance, Eco Charger’s Lithium POWER 4WD quad uses a bespoke 72 V lithium-ion battery pack and drives power through a selectable 4WD shaft-driven chassis with lockable front differential.
Growth in Emerging Markets
Emerging regions, particularly in Asia-Pacific, present substantial growth opportunities due to rising disposable incomes, increasing vehicle penetration, and expanding industrial automation. Countries in these regions are adopting EL displays for automotive dashboards, industrial signage, and consumer electronics at accelerating rates. Established markets, such as North America and Europe, continue steady adoption in automotive, defense, and aerospace segments. Market expansion in both emerging and mature regions supports manufacturers’ global growth strategies and encourages investments in production capacity and localized supply chains.
Key Challenges
High Production and Materials Costs
The cost of materials and advanced manufacturing processes for EL displays remains high, limiting adoption in price-sensitive segments. Components such as phosphors, transparent electrodes, and flexible substrates contribute significantly to production expenses. High costs also make competing technologies like LCD and OLED more attractive in certain applications. Manufacturers must optimize production efficiency and explore cost-effective materials to expand EL display adoption across a wider range of industries.
Limited Lifespan and Performance Degradation
EL displays face challenges related to durability and lifespan. Phosphors and thin films can degrade over time due to voltage, heat, and environmental exposure, resulting in reduced brightness and uniformity. This limits their suitability for long-life applications, harsh industrial environments, and outdoor installations. Improving the stability of phosphors and protective coatings remains critical to extending performance, meeting customer expectations, and sustaining growth in demanding industrial and consumer markets.
Regional Analysis
North America
The North American region commands an approximate 30 % market share in the global electroluminescent (EL) displays market. Strong automotive and defence sectors drive demand for EL technology in digital dashboards and rugged instrumentation. High consumer electronics adoption, coupled with extensive R&D infrastructure in the U.S. and Canada, supports innovation and rollout of thinner, energy‑efficient EL displays. Tightening power‑consumption regulations and growing infotainment systems further bolster regional growth. Manufacturers investing in this region benefit from favorable supply chains and deep end‑user markets for advanced display technologies.
Asia Pacific
Asia Pacific holds the largest regional share at around 45 % of the global EL displays market. Rapid growth in China, India, Japan and South Korea fuels demand for EL panels in automotive, consumer wearables, signage and smart textiles. Localised manufacturing hubs and supportive government policies speed up deployment of flexible and transparent EL display technologies. Rising disposable income and infrastructure investment help end‑users adopt advanced displays. Producers are capitalising on this region’s volume potential and innovation ecosystems to broaden market reach and lower production costs.
Europe
Europe accounts for roughly 15 % of the global EL displays market. The region benefits from strong automotive manufacturing centres, particularly in Germany, France and the U.K., which adopt EL displays for instrument clusters and heads‑up displays. Increased focus on sustainability and energy‑efficient hardware drives demand for low‑power EL solutions in industrial and commercial applications. European vendors face competition but leverage high‑quality engineering standards and regulatory frameworks to introduce advanced EL products for specialised markets including defence and smart infrastructure.
Latin America
Latin America contributes about 5 % to the global electroluminescent displays market. Growth remains modest but steady, driven by increasing automotive and signage applications in Brazil, Mexico and other regional countries. Emerging infrastructure developments and rising consumer electronic demand present incremental opportunities for EL display adoption. However, economic variability and import‑cost challenges restrict rapid scale‑up. Regional manufacturers and importers are exploring localised assembly and low‑cost variants to enhance market penetration.
Middle East & Africa (MEA)
The Middle East & Africa region also holds around 5 % of the market share in EL displays. Demand is gradually increasing thanks to infrastructure development, military and transportation investments, and new commercial signage projects in Gulf Cooperation Council (GCC) countries and Africa. Adoption follows projects that require durable, low‑power displays in harsh environments. Limited manufacturing base and supply‑chain constraints pose challenges, but strategic collaborations and project‑based deployment offer growth potential in the region.
Market Segmentations:
By Film Type:
- Transparent thin film electroluminescent display
- Non-transparent thin film electroluminescent display
By Material:
- Electroluminescent wire
- Electroluminescent strips/tapes
By End User:
- Food and beverages
- Transportation
By Geography
- North America
- Europe
- Germany
- France
- U.K.
- Italy
- Spain
- Rest of Europe
- Asia Pacific
- China
- Japan
- India
- South Korea
- South-east Asia
- Rest of Asia Pacific
- Latin America
- Brazil
- Argentina
- Rest of Latin America
- Middle East & Africa
- GCC Countries
- South Africa
- Rest of the Middle East and Africa
Competitive Landscape
The electroluminescent (EL) displays market players such as EL International Ltd, Lumineq, Shanghai Keyan Phosphor Technology Co., Ltd. (KPT), LumaMedia, intl, Orbit Electronics Group, Materiability Research Group, Nejilock Technology Pte Ltd, Technomark, Inc., Nixology.uk, and Printed Electronics Ltd. The electroluminescent (EL) displays market is highly competitive, driven by continuous technological innovation and increasing demand across automotive, consumer electronics, and industrial sectors. Companies focus on developing flexible, transparent, and energy-efficient display solutions to differentiate their products. Advancements in phosphor materials, thin-film technology, and roll-to-roll manufacturing have improved brightness, durability, and production efficiency. Strategic initiatives, including collaborations, mergers, and regional expansions, enable firms to strengthen market presence and capture emerging opportunities. Additionally, tailored solutions for niche applications such as wearable electronics, smart signage, and advanced instrument panels support adoption and enhance competitive positioning in this dynamic market.
Shape Your Report to Specific Countries or Regions & Enjoy 30% Off!
Key Player Analysis
Recent Developments
- In May 2024, Samsung Display unveiled an 18-inch QD-LED prototype at Display Week 2024, fabricated using inkjet printing, which uses quantum dots as the light-emitting source by applying electrical current directly to them.
- In February 2024, SHARP Electronics of Canada Ltd., a Sharp Corporation subsidiary, announced the launch of MultiSync PNME Series displays, developed in collaboration with NEC Corporation. The PNME Series prioritizes maintaining commercial reliability while integrating modernized features to address the evolving demands of customers within the digital signage market.
- In January 2024, Sony Professional Solutions Europe announced a partnership with the U.K.-based digital signage software provider Signagelive (Remote Media Group Limited) to enhance its BRAVIA 4K Professional Displays
Report Coverage
The research report offers an in-depth analysis based on Film Type, Material, End-User and Geography. It details leading market players, providing an overview of their business, product offerings, investments, revenue streams, and key applications. Additionally, the report includes insights into the competitive environment, SWOT analysis, current market trends, as well as the primary drivers and constraints. Furthermore, it discusses various factors that have driven market expansion in recent years. The report also explores market dynamics, regulatory scenarios, and technological advancements that are shaping the industry. It assesses the impact of external factors and global economic changes on market growth. Lastly, it provides strategic recommendations for new entrants and established companies to navigate the complexities of the market.
Future Outlook
- Manufacturers will increasingly adopt transparent and flexible EL films, enabling new form‑factors in automotive and wearable electronics.
- Growth will accelerate in the automotive sector as EL displays get deployed in digital dashboards, heads‑up displays and ambient lighting.
- Adoption across smart packaging and smart textile applications will rise, as low‑power EL solutions bring novel branding and design opportunities.
- Improvements in phosphor brightness and lifetime will enhance EL display performance, making them more competitive with OLED/LCD alternatives.
- Asia‑Pacific will continue to dominate regional growth, driven by strong manufacturing hubs, rising consumer demand and government support for electronics innovation.
- Roll‑to‑roll manufacturing and scaled‑up production will reduce per‑unit cost, unlocking EL display adoption in more cost‑sensitive segments.
- Integration of EL displays with other electronics—such as sensors, IoT modules and flexible batteries—will enable smart, interactive surfaces and devices.
- Sustainability and energy‑efficiency trends will favour EL technology, as low‑power, thin displays gain appeal in automotive, consumer and industrial markets.
- Niche applications in defence, aerospace and industrial instrumentation will expand, as EL displays offer ruggedness and ambient‑visibility advantages over rivals.
- Competitive pressure from alternative technologies (OLED, microLED) will intensify, pushing EL manufacturers to innovate around lifespan, colour gamut and manufacturing efficiency.


