Home » Semiconductor & Electronics » Electronic Cartography Market

Electronic Cartography Market By Type (Electronic Navigational Charts (ENC), Raster Navigational Charts (RNC), Vector Charts, Others); By Application (Marine and Shipping, Aviation, Defense and Military, Automotive and Transportation, Commercial) – Growth, Share, Opportunities & Competitive Analysis, 2024 – 2032

Report ID: 153351 | Report Format : Excel, PDF

Market Overview:

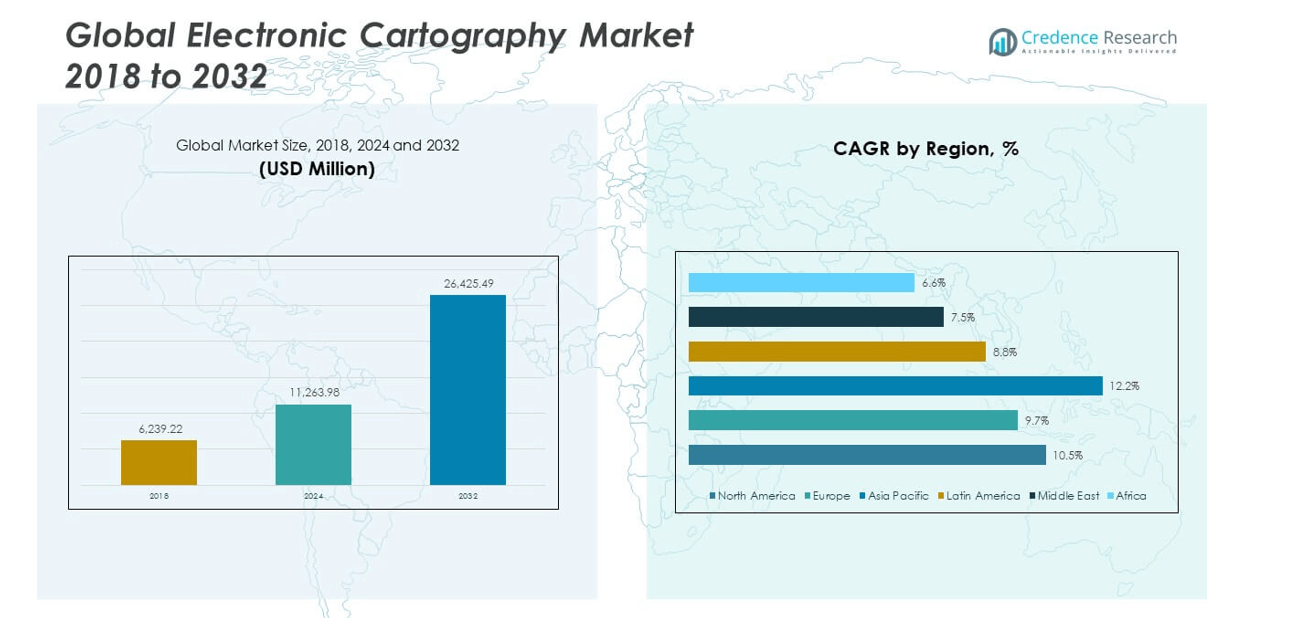
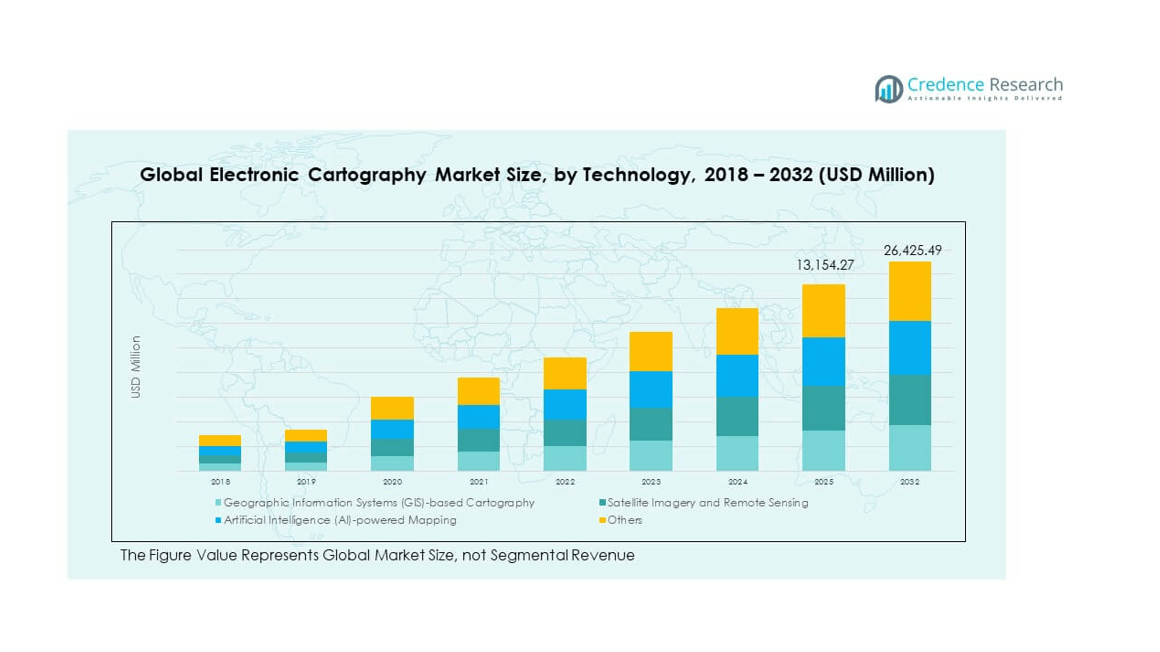
The Global Electronic Cartography Market size was valued at USD 6,239.22 million in 2018 to USD 11,263.98 million in 2024 and is anticipated to reach USD 26,425.49 million by 2032, at a CAGR of 10.48% during the forecast period.

REPORT ATTRIBUTE DETAILS
Historical Period 2020-2023
Base Year 2024
Forecast Period 2025-2032
Electronic Cartography Market Size 2024 USD 11,263.98 million
Electronic Cartography Market, CAGR 10.48%
Electronic Cartography Market Size 2032 USD 26,425.49 million


Growth in the market is driven by increasing demand for precise navigation systems, real-time mapping, and integration with digital platforms. Industries such as defense, aviation, and transportation are adopting advanced mapping technologies to improve safety, efficiency, and decision-making. Rising use of GPS-enabled devices and AI-powered geospatial solutions supports accurate data visualization, driving operational efficiency across sectors.

North America leads the market due to its advanced technology infrastructure and high adoption in defense and transportation. Europe follows, supported by strong maritime and aviation sectors. Asia Pacific is emerging rapidly, driven by urbanization, digital transformation, and smart city initiatives. Latin America, the Middle East, and Africa show gradual growth with increasing investments in digital mapping and navigation systems.

Electronic Cartography Market size

Market Insights:

  • The Global Electronic Cartography Market was valued at USD 6,239.22 million in 2018, reached USD 11,263.98 million in 2024, and is projected to hit USD 26,425.49 million by 2032, expanding at a CAGR of 10.48%.
  • North America holds the largest share at 42.4%, supported by strong defense, aviation, and mapping infrastructure; Europe follows with 26.9%, driven by regulatory support and maritime applications; Asia Pacific ranks third with 23.8%, led by smart city and mobility projects.
  • Asia Pacific is the fastest-growing region, supported by rapid urbanization, infrastructure expansion, and adoption of AI-powered cartography solutions.
  • Geographic Information Systems (GIS)-based cartography leads with around 45% of total market share, supported by its accuracy and real-time data integration across industries.
  • Satellite imagery and remote sensing account for roughly 30% share, fueled by expanding use in defense, disaster management, and environmental monitoring.

Access crucial information at unmatched prices!

Request your sample report today & start making informed decisions powered by Credence Research Inc.!

Download Sample

Market Drivers

Rising Demand for Real-Time Navigation and Location-Based Services

The growing use of real-time navigation solutions is fueling market expansion. Transportation, defense, logistics, and tourism rely heavily on accurate and updated mapping data. Integration of navigation software with connected devices improves operational planning. Rising smartphone penetration supports wider adoption of mapping technologies. Businesses deploy location-based services to enhance efficiency and safety. Advanced cartographic solutions support route optimization for fleets and logistics companies. The Global Electronic Cartography Market benefits from this surge in demand. It continues to evolve with intelligent and adaptive mapping platforms.

Expanding Applications in Defense and Aerospace Sectors

The defense and aerospace industries use electronic cartography to improve strategic planning. Military operations depend on accurate geospatial intelligence and real-time updates. Aviation companies adopt these tools to enhance flight route accuracy and safety. Integration with satellite-based systems enables precise terrain analysis and navigation. Governments invest in modern mapping infrastructure to strengthen defense capabilities. Increased funding for mission-critical navigation systems boosts adoption rates. The Global Electronic Cartography Market gains momentum from these strategic applications. It creates strong demand for high-resolution and secure mapping solutions.

Technological Advancements in Digital Mapping Infrastructure

Rapid technological progress is reshaping the mapping landscape. Artificial intelligence and machine learning enhance real-time geospatial analysis. Automation in data collection accelerates the generation of precise digital maps. Integration with IoT devices enables dynamic updates of terrain and routes. 5G connectivity improves speed and accuracy of geospatial transmission. Advanced software platforms simplify map visualization and customization. The Global Electronic Cartography Market grows stronger with such innovations. It achieves better scalability and operational efficiency for multiple sectors.

  • For instance, HERE Technologies, during CES 2025, announced collaboration with Amazon Web Services under a 10-year, $1 billion deal to enable global streaming of AI-driven live maps. More than 220 million vehicles now rely on HERE maps for ADAS, EV, and automated driving systems across 70 automotive brands.

Increasing Role of Autonomous and Connected Vehicles

The rise of autonomous and connected vehicles is driving demand for precision mapping. Vehicles require real-time navigation systems with centimeter-level accuracy. High-definition maps enhance safety, traffic management, and driving efficiency. Automotive companies collaborate with map developers to improve guidance systems. Smart transportation infrastructure supports smooth integration of these solutions. Governments push investments in mobility programs to promote connected vehicle ecosystems. The Global Electronic Cartography Market benefits from these strategic moves. It plays a critical role in enabling safer and smarter mobility solutions.

  • For instance, in September 2025, Space42 and Dynamic Map Platform (DMP) signed a verified MoU to deliver high-definition map data for General Motors’ Super Cruise ADAS in the UAE. The collaboration uses LiDAR point cloud data processed into HD maps covering over 960,000 kilometers of mapped roads, supporting advanced hands-free driving.

Market Trends

Growing Integration of AI and Predictive Analytics in Mapping

AI integration is transforming how digital maps are built and updated. Predictive analytics improves routing efficiency and reduces delays. Real-time analysis enables dynamic adjustments to routes and terrains. Governments and enterprises adopt AI-powered platforms for better insights. Automation reduces errors in cartographic data processing. Faster decision-making improves the value of geospatial solutions. The Global Electronic Cartography Market gains depth from this AI evolution. It enables a new wave of intelligent navigation services.

  • For instance, H2O.ai’s Driverless AI platform automates machine learning for predictive modeling across industries. It helps organizations analyze large datasets to improve decision-making and forecasting accuracy. This demonstrates AI’s role in enhancing data-driven mapping and analytics.

Rising Adoption of Cloud-Based Mapping Platforms

Cloud platforms are becoming essential for large-scale mapping operations. Centralized storage improves access to accurate and updated geospatial data. Businesses rely on cloud solutions for real-time collaboration across teams. Flexible scaling reduces costs for high-volume mapping projects. Developers integrate cloud systems to enhance mobility and connectivity. Secure and quick data sharing strengthens operational workflows. The Global Electronic Cartography Market grows with the rising cloud ecosystem. It creates strong infrastructure support for modern mapping needs.

  • For instance, Esri’s March 2025 collaboration with Google Maps Platform integrated high-resolution Photorealistic 3D Tiles into the ArcGIS ecosystem, allowing enterprises to develop cloud-hosted, immersive 3D basemaps for infrastructure and urban analytics applications.

Emergence of 3D and Immersive Mapping Technologies

3D mapping brings new depth to navigation and visualization. Immersive technologies support better route planning for complex terrains. Augmented reality enhances user experiences with layered geospatial details. Engineers and planners depend on these tools for urban development. High-resolution imagery improves monitoring and decision-making capabilities. Businesses invest in immersive tech to increase operational accuracy. The Global Electronic Cartography Market benefits from these immersive solutions. It enables industries to execute projects with greater precision.

Wider Integration with Smart Infrastructure Ecosystems

Smart cities depend on real-time geospatial data to function efficiently. Infrastructure planners adopt electronic cartography to optimize traffic flow. Utilities integrate mapping with connected devices for better resource management. Transportation systems become more synchronized with accurate navigation. Data-driven solutions improve emergency response and public safety. Integration with digital twins enhances infrastructure resilience. The Global Electronic Cartography Market fits well into this ecosystem. It strengthens the foundation of next-generation urban development.

Electronic Cartography Market shar3

Market Challenges Analysis

Data Privacy and Security Concerns in Geospatial Applications

The handling of sensitive mapping data raises security concerns. Geospatial datasets contain critical information on defense, transport, and infrastructure. Cyberattacks and unauthorized access threaten data integrity. Governments impose strict regulations to protect mapping information. Companies face compliance challenges across multiple jurisdictions. Balancing accessibility with security requires advanced encryption and monitoring. The Global Electronic Cartography Market faces rising pressure to meet these standards. It must maintain trust and reliability in sensitive operational environments.

High Infrastructure Costs and Integration Complexities

Building and maintaining advanced mapping infrastructure involves significant capital investment. Companies need continuous upgrades to stay ahead of technological changes. Integration with AI, IoT, and autonomous systems requires skilled expertise. Many regions lack the technical ecosystem to support such deployments. Cost barriers slow adoption in emerging economies. Interoperability between platforms remains a persistent technical challenge. The Global Electronic Cartography Market must address these issues to sustain growth. It requires scalable and cost-effective solutions for wider market reach.

Market Opportunities

Expansion Potential in Smart Mobility and Urban Development Projects

Smart mobility programs create new opportunities for digital mapping solutions. Urban planners adopt geospatial tools to design efficient transport networks. Connected infrastructure requires precise mapping to manage real-time operations. Startups and technology firms invest in advanced navigation platforms. Governments support such programs to modernize urban systems. The Global Electronic Cartography Market benefits from these policy initiatives. It positions itself as a core enabler of smart city growth.

Rising Demand from Maritime, Aviation, and Energy Sectors

Maritime and aviation industries are expanding their reliance on real-time mapping. Accurate cartography supports safer and more efficient route planning. Energy companies use these solutions for resource exploration and infrastructure monitoring. Strategic investments enhance adoption in offshore and remote locations. Cross-sector partnerships accelerate innovation in mapping technologies. The Global Electronic Cartography Market gains new revenue streams from these verticals. It strengthens its presence in critical industrial sectors worldwide.

Market Segmentation Analysis:

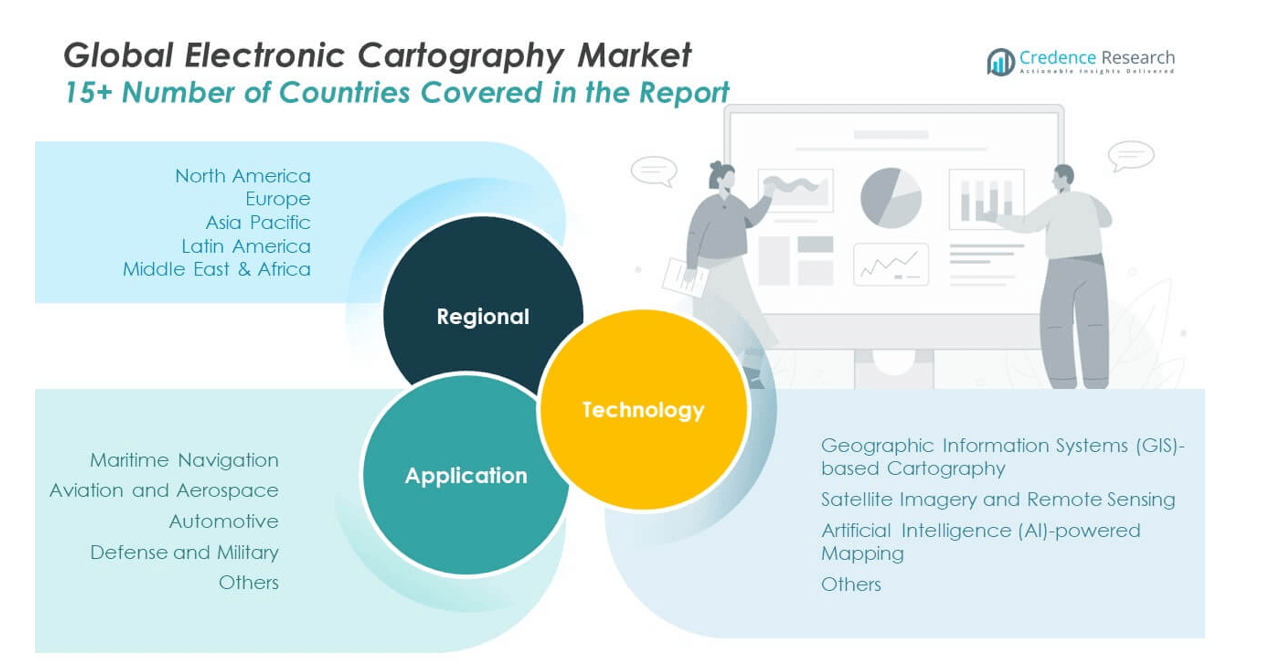
The Global Electronic Cartography Market is segmented by type, application, and region, reflecting its broad range of end uses.

By type, Electronic Navigational Charts (ENC) hold the dominant share due to their precision, real-time update capabilities, and compliance with international maritime and aviation standards. Raster Navigational Charts (RNC) remain essential for backup and legacy systems, while vector charts support advanced visualization and integration with navigation platforms. The “Others” segment covers specialized mapping formats used in niche applications. It continues to evolve with technological advancements and greater interoperability between mapping formats.

  • For example, NOAA’s Office of Coast Survey published 2,163 new gridded electronic navigational chart cells by January 2025. The agency aims to complete the transition to the S‑101 standard suite by 2026. This highlights advancements in digital mapping standards and cartography updates.

By application, marine and shipping lead the market, supported by strict regulatory standards and the need for accurate navigation. Aviation and defense follow closely, driven by operational safety and strategic surveillance requirements. Automotive and transportation benefit from expanding connected mobility solutions, while the commercial segment grows through location-based services and logistics. Regionally, North America leads due to strong infrastructure and adoption, followed by Europe and Asia Pacific, with Latin America, the Middle East, and Africa showing steady growth.

  • For instance, Northrop Grumman’s Beacon program uses the Model 437 Vanguard as a testbed for autonomous flight technologies. Its Prism software manages core flight functions and integrates modular tools for adaptive mission planning. This demonstrates advanced AI-driven navigation applications in aerospace.

Electronic Cartography Market segmentation

Segmentation:

By Type

  • Electronic Navigational Charts (ENC)
  • Raster Navigational Charts (RNC)
  • Vector Charts
  • Others

By Application

  • Marine and Shipping
  • Aviation
  • Defense and Military
  • Automotive and Transportation
  • Commercial

By Region

  • North America
    • U.S.
    • Canada
  • Europe
    • Germany
    • France
    • Italy
    • U.K.
    • Russia
    • Rest of Europe
  • Asia-Pacific
    • India
    • China
    • Japan
    • Rest of Asia-Pacific
  • Latin America
    • Brazil
    • Mexico
    • Rest of Latin America
  • Middle East and Africa
    • GCC Countries
    • South Africa
    • Rest of Middle East and Africa

Regional Analysis:

North America

The North America Global Electronic Cartography Market size was valued at USD 2,666.30 million in 2018 to USD 4,762.52 million in 2024 and is anticipated to reach USD 11,204.67 million by 2032, at a CAGR of 10.5% during the forecast period. North America holds a 42.4% market share. The region benefits from strong technological infrastructure and rapid adoption of advanced geospatial solutions. Defense, aviation, and logistics industries lead demand for electronic navigation systems. Governments support modernization programs to enhance national security and transportation safety. Leading players invest in AI-driven mapping platforms and real-time analytics. High penetration of autonomous and connected vehicle technologies further accelerates growth. The Global Electronic Cartography Market gains strong momentum here through robust investments and innovation. It remains a critical hub for developing next-generation mapping solutions.

Europe

The Europe Global Electronic Cartography Market size was valued at USD 1,848.96 million in 2018 to USD 3,222.82 million in 2024 and is anticipated to reach USD 7,137.99 million by 2032, at a CAGR of 9.7% during the forecast period. Europe holds a 26.9% market share. The region has a well-established aviation and maritime sector, driving demand for precision mapping. Defense agencies and civil aviation authorities are major users of digital navigation solutions. Strong regulatory frameworks support the adoption of secure and interoperable mapping systems. Companies expand capabilities through strategic collaborations and cloud-based solutions. Growing use of mapping in smart infrastructure planning also fuels demand. The Global Electronic Cartography Market benefits from Europe’s focus on safety and operational efficiency. It continues to grow through technology integration and modernization programs.

Asia Pacific

The Asia Pacific Global Electronic Cartography Market size was valued at USD 1,211.87 million in 2018 to USD 2,369.59 million in 2024 and is anticipated to reach USD 6,289.50 million by 2032, at a CAGR of 12.2% during the forecast period. Asia Pacific holds a 23.8% market share. The region experiences rapid urbanization and infrastructure expansion, creating strong demand for real-time mapping solutions. Aviation and maritime industries invest in navigation upgrades to enhance operational safety. Governments focus on building digital ecosystems for transportation and logistics. Local companies partner with global firms to strengthen geospatial capabilities. Smart city initiatives across China, Japan, and India boost adoption. The Global Electronic Cartography Market sees major growth from Asia Pacific’s evolving digital economy. It positions the region as a key growth engine for future developments.

Latin America

The Latin America Global Electronic Cartography Market size was valued at USD 288.46 million in 2018 to USD 514.16 million in 2024 and is anticipated to reach USD 1,064.60 million by 2032, at a CAGR of 8.8% during the forecast period. Latin America holds a 4.0% market share. The region is witnessing increasing investment in maritime and aviation infrastructure. Governments focus on enhancing navigation and safety across critical transportation routes. Adoption remains gradual but is supported by modernization efforts in logistics and defense. Companies explore partnerships to expand their operational capabilities. Growing e-commerce activities are driving demand for better mapping systems. The Global Electronic Cartography Market gains traction through expanding infrastructure and technology adoption. It shows strong long-term potential with ongoing investment in modernization.

Middle East

The Middle East Global Electronic Cartography Market size was valued at USD 144.27 million in 2018 to USD 233.35 million in 2024 and is anticipated to reach USD 441.75 million by 2032, at a CAGR of 7.5% during the forecast period. The Middle East holds a 1.6% market share. The region focuses on adopting electronic mapping in aviation, defense, and maritime sectors. Governments invest in navigation infrastructure to improve security and logistics efficiency. High-value port and airport modernization projects drive market demand. Strategic partnerships with international companies enhance technological capabilities. Smart city programs in Gulf countries create opportunities for mapping solutions. The Global Electronic Cartography Market expands steadily with these strategic developments. It benefits from rising investments in infrastructure resilience and modernization.

Africa

The Africa Global Electronic Cartography Market size was valued at USD 79.35 million in 2018 to USD 161.52 million in 2024 and is anticipated to reach USD 286.97 million by 2032, at a CAGR of 6.6% during the forecast period. Africa holds a 1.3% market share. The region is gradually expanding its digital infrastructure and navigation capabilities. Governments prioritize investments in aviation, maritime safety, and logistics. Adoption remains at an early stage but shows positive momentum. International collaborations help improve mapping capabilities in key markets. Modernization of ports and airports boosts demand for electronic navigation systems. The Global Electronic Cartography Market finds growth opportunities in Africa’s emerging economies. It continues to build a stronger presence through targeted infrastructure projects.

Shape Your Report to Specific Countries or Regions & Enjoy 30% Off!

Key Player Analysis:

  • Garmin Ltd.
    • Raytheon Technologies Corporation
    • Furuno Electric Co., Ltd.
    • Navionics S.p.A.
    • Northrop Grumman Corporation
    • Thales Group
    • Maxar Technologies Inc.
    • Navico Holding AS
    • Jeppesen (Boeing Company)
    • IIC Technologies

Competitive Analysis:

The Global Electronic Cartography Market is characterized by strong competition among established technology providers and specialized navigation solution developers. Leading companies such as Garmin Ltd., Raytheon Technologies Corporation, Furuno Electric Co., Ltd., Navionics S.p.A., Northrop Grumman Corporation, Thales Group, Maxar Technologies Inc., Navico Holding AS, Jeppesen (Boeing Company), and IIC Technologies drive innovation through product launches and strategic collaborations. It focuses on expanding high-accuracy mapping capabilities, enhancing real-time data processing, and improving system integration across applications. Companies invest in advanced GPS, AI-based navigation, and 3D mapping platforms to strengthen market presence. Strategic partnerships with defense, aviation, and maritime sectors support large-scale deployments. Competitive differentiation centers on technological innovation, global reach, and reliability of mapping infrastructure.

Recent Developments:

  • In October 2025, Garmin Ltd. launched its new eTrex Touch handheld GPS navigator, designed for outdoor enthusiasts and adventurers. The high-resolution color touchscreen device features multi-band GPS accuracy, preloaded TopoActive maps, and up to 130 hours of battery life. This launch underscores Garmin’s commitment to expanding its portfolio of rugged, premium navigation devices for outdoor and field professionals.
  • In May 2025, Honeywell launched its latest innovation, the HGuide o480 inertial navigation system (INS), marking a major development in the electronic cartography and navigation technology space. The newly launched product integrates high-performance localization and attitude data capabilities in a compact, single-card format. It is specifically engineered for applications across unmanned aerial vehicles, autonomous ground systems, underwater vehicles, and terrestrial mapping operations used in the geodetics industry.

Report Coverage:

The research report offers an in-depth analysis based on Technology and Application.  It details leading market players, providing an overview of their business, product offerings, investments, revenue streams, and key applications. Additionally, the report includes insights into the competitive environment, SWOT analysis, current market trends, as well as the primary drivers and constraints. Furthermore, it discusses various factors that have driven market expansion in recent years. The report also explores market dynamics, regulatory scenarios, and technological advancements that are shaping the industry. It assesses the impact of external factors and global economic changes on market growth. Lastly, it provides strategic recommendations for new entrants and established companies to navigate the complexities of the market.

Future Outlook:

  • Advancements in AI and machine learning will enhance mapping accuracy and speed.
  • Integration with autonomous vehicles will expand demand for high-definition mapping solutions.
  • Cloud-based platforms will become the backbone of large-scale mapping deployments.
  • Strategic collaborations between defense agencies and private firms will drive innovation.
  • 3D and immersive mapping will gain wider use in aviation, maritime, and urban development.
  • Real-time geospatial analytics will support predictive decision-making across industries.
  • Expansion of smart city projects will create new opportunities for mapping providers.
  • Integration with IoT ecosystems will boost demand for dynamic route optimization.
  • Cybersecurity measures will strengthen to protect sensitive mapping infrastructures.
  • Global standardization of mapping systems will improve interoperability across regions.

CHAPTER NO. 1: GENESIS OF THE MARKET     

1.1 Market Prelude – Introduction & Scope

1.2 The Big Picture – Objectives & Vision

1.3 Strategic Edge – Unique Value Proposition

1.4 Stakeholder Compass – Key Beneficiaries

CHAPTER NO. 2: EXECUTIVE LENS

2.1 Pulse of the Industry – Market Snapshot

2.2 Growth Arc – Revenue Projections (USD Million)

2.3. Premium Insights – Based on Primary Interviews

CHAPTER NO. 3: ELECTRONIC CARTOGRAPHY FORCES & INDUSTRY PULSE

3.1 Foundations of Change – Market Overview
3.2 Catalysts of Expansion – Key Market Drivers
3.2.1 Momentum Boosters – Growth Triggers
3.2.2 Innovation Fuel – Disruptive Technologies
3.3 Headwinds & Crosswinds – Market Restraints
3.3.1 Regulatory Tides – Compliance Challenges
3.3.2 Economic Frictions – Inflationary Pressures
3.4 Untapped Horizons – Growth Potential & Opportunities
3.5 Strategic Navigation – Industry Frameworks
3.5.1 Market Equilibrium – Porter’s Five Forces
3.5.2 Ecosystem Dynamics – Value Chain Analysis
3.5.3 Macro Forces – PESTEL Breakdown

3.6 Price Trend Analysis

    3.6.1 Regional Price Trend
3.6.2 Price Trend by Technology

CHAPTER NO. 4: KEY INVESTMENT EPICENTER         

4.1 Regional Goldmines – High-Growth Geographies

4.2 Product Frontiers – Lucrative Product Categories

4.3 Application Sweet Spots – Emerging Demand Segments

CHAPTER NO. 5: REVENUE TRAJECTORY & WEALTH MAPPING

5.1 Momentum Metrics – Forecast & Growth Curves

5.2 Regional Revenue Footprint – Market Share Insights

5.3 Segmental Wealth Flow – Technology & Application Revenue

CHAPTER NO. 6 : TRADE & COMMERCE ANALYSIS    

6.1.      Import Analysis by Region

6.1.1.    Global Electronic Cartography Market Import Revenue By Region

6.2.      Export Analysis by Region

6.2.1.    Global Electronic Cartography Market Export Revenue By Region

CHAPTER NO. 7: COMPETITION ANALYSIS       

7.1.      Company Market Share Analysis

7.1.1.    Global Electronic Cartography Market: Company Market Share

7.2.      Global Electronic Cartography Market Company Revenue Market Share

7.3.      Strategic Developments

7.3.1.    Acquisitions & Mergers

7.3.2.    New Product Launch

7.3.3.    Regional Expansion

7.4.      Competitive Dashboard

7.5.    Company Assessment Metrics, 2024

CHAPTER NO. 8: ELECTRONIC CARTOGRAPHY – BY TECHNOLOGY SEGMENT ANALYSIS

8.1.      Electronic Cartography Market Overview by Technology Segment

8.1.1.    Electronic Cartography Market Revenue Share By Technology

8.2.      Geographic Information Systems (GIS)-based Cartography

8.3.      Satellite Imagery and Remote Sensing

8.4.      Artificial Intelligence (AI)-powered Mapping

8.5.      Others

CHAPTER NO. 9: ELECTRONIC CARTOGRAPHY – BY APPLICATION SEGMENT ANALYSIS

9.1.      Electronic Cartography Market Overview by Application Segment

9.1.1.    Electronic Cartography Market Revenue Share By Application

9.2.      Maritime Navigation

9.3.      Aviation and Aerospace

9.4.      Automotive

9.5.      Defense and Military

9.6.      Others

CHAPTER NO. 10: ELECTRONIC CARTOGRAPHY – REGIONAL ANALYSIS  

10.1.     Electronic Cartography Market Overview by Region Segment

10.1.1.  Global Electronic Cartography Market Revenue Share By Region

10.1.2.  Region

10.1.3.  Technology

10.1.4.  Global Electronic Cartography Market Revenue By Technology

10.1.5.  Application

10.1.6.  Global Electronic Cartography Market Revenue By Application

CHAPTER NO. 11: NORTH AMERICA ELECTRONIC CARTOGRAPHY – COUNTRY ANALYSIS

11.1.     North America Electronic Cartography Market Overview by Country Segment

11.1.1.  North America Electronic Cartography Market Revenue Share By Region

11.2.     North America

11.2.1.  North America Electronic Cartography Market Revenue By Country

11.2.2.  Technology

11.2.3.  North America Electronic Cartography Market Revenue By Technology

11.2.4.  Application

11.2.5.  North America Electronic Cartography Market Revenue By Application

11.3.     U.S.

11.4.     Canada

11.5.     Mexico

CHAPTER NO. 12: EUROPE ELECTRONIC CARTOGRAPHY – COUNTRY ANALYSIS

12.1.     Europe Electronic Cartography Market Overview by Country Segment

12.1.1.  Europe Electronic Cartography Market Revenue Share By Region

12.2.     Europe

12.2.1.  Europe Electronic Cartography Market Revenue By Country

12.2.2.  Technology

12.2.3.  Europe Electronic Cartography Market Revenue By Technology

12.2.4.  Application

12.2.5.  Europe Electronic Cartography Market Revenue By Application

12.3.     UK

12.4.     France

12.5.     Germany

12.6.     Italy

12.7.     Spain

12.8.     Russia

12.9.   Rest of Europe

CHAPTER NO. 13: ASIA PACIFIC ELECTRONIC CARTOGRAPHY – COUNTRY ANALYSIS

13.1.     Asia Pacific Electronic Cartography Market Overview by Country Segment

13.1.1.  Asia Pacific Electronic Cartography Market Revenue Share By Region

13.2.     Asia Pacific

13.2.1.  Asia Pacific Electronic Cartography Market Revenue By Country

13.2.2.  Technology

13.2.3.  Asia Pacific Electronic Cartography Market Revenue By Technology

13.2.4.  Application

13.2.5.  Asia Pacific Electronic Cartography Market Revenue By Application

13.3.     China

13.4.     Japan

13.5.     South Korea

13.6.     India

13.7.     Australia

13.8.     Southeast Asia

13.9.     Rest of Asia Pacific

CHAPTER NO. 14: LATIN AMERICA ELECTRONIC CARTOGRAPHY – COUNTRY ANALYSIS

14.1.     Latin America Electronic Cartography Market Overview by Country Segment

14.1.1.  Latin America Electronic Cartography Market Revenue Share By Region

14.2.     Latin America

14.2.1.  Latin America Electronic Cartography Market Revenue By Country

14.2.2.  Technology

14.2.3.  Latin America Electronic Cartography Market Revenue By Technology

14.2.4.  Application

14.2.5.  Latin America Electronic Cartography Market Revenue By Application

14.3.     Brazil

14.4.     Argentina

14.5.     Rest of Latin America

CHAPTER NO. 15: MIDDLE EAST ELECTRONIC CARTOGRAPHY – COUNTRY ANALYSIS

15.1.     Middle East Electronic Cartography Market Overview by Country Segment

15.1.1.  Middle East Electronic Cartography Market Revenue Share By Region

15.2.     Middle East

15.2.1.  Middle East Electronic Cartography Market Revenue By Country

15.2.2.  Technology

15.2.3.  Middle East Electronic Cartography Market Revenue By Technology

15.2.4.  Application

15.2.5.  Middle East Electronic Cartography Market Revenue By Application

15.3.     GCC Countries

15.4.     Israel

15.5.     Turkey

15.6.     Rest of Middle East

CHAPTER NO. 16: AFRICA ELECTRONIC CARTOGRAPHY – COUNTRY ANALYSIS

16.1.     Africa Electronic Cartography Market Overview by Country Segment

16.1.1.  Africa Electronic Cartography Market Revenue Share By Region

16.2.     Africa

16.2.1.  Africa Electronic Cartography Market Revenue By Country

16.2.2.  Technology

16.2.3.  Africa Electronic Cartography Market Revenue By Technology

16.2.4.  Application

16.2.5.  Africa Electronic Cartography Market Revenue By Application

16.3.     South Africa

16.4.     Egypt

16.5.     Rest of Africa

CHAPTER NO. 17: COMPANY PROFILES 

17.1.     Garmin Ltd.

17.1.1.  Company Overview

17.1.2.  Product Portfolio

17.1.3.  Financial Overview

17.1.4.  Recent Developments

17.1.5.  Growth Strategy

17.1.6.  SWOT Analysis

17.2.     Navionics

17.3.     C-MAP (Navico Group)

17.4.     Maxar Technologies

17.5.     Jeppesen (Boeing)

17.6.     Universal Avionics

17.7.     Rockwell Collins

17.8.     Honeywell International

17.9.     Northrop Grumman

17.10.   Transas Marine

Request Free Sample

We prioritize the confidentiality and security of your data. Our promise: your information remains private.

Ready to Transform Data into Decisions?

Request Your Sample Report and Start Your Journey of Informed Choices


Providing the strategic compass for industry titans.

cr-clients-logos

Frequently Asked Questions

What is the current market size for the Global Electronic Cartography Market, and what is its projected size in 2032?

The Global Electronic Cartography Market was valued at USD 11,263.98 million in 2024 and is projected to reach USD 26,425.49 million by 2032, reflecting strong growth potential across multiple industries.

At what Compound Annual Growth Rate is the Global Electronic Cartography Market projected to grow between 2024 and 2032?

The Global Electronic Cartography Market is expected to grow at a CAGR of 10.48% during the forecast period, driven by increasing adoption of advanced mapping technologies.

Which Global Electronic Cartography Market segment held the largest share in 2024?

In 2024, the Electronic Navigational Charts (ENC) segment held the largest share of the Global Electronic Cartography Market due to its strong adoption in maritime, aviation, and defense applications.

What are the primary factors fueling the growth of the Global Electronic Cartography Market?

The Global Electronic Cartography Market is fueled by rising demand for real-time navigation, technological advancements in mapping infrastructure, increased use in defense and transportation, and rapid growth of smart mobility solutions.

Who are the leading companies in the Global Electronic Cartography Market?

Key companies in the Global Electronic Cartography Market include Garmin Ltd., Raytheon Technologies Corporation, Furuno Electric Co., Ltd., Navionics S.p.A., Northrop Grumman Corporation, Thales Group, Maxar Technologies Inc., Navico Holding AS, Jeppesen (Boeing Company), and IIC Technologies..

Which region commanded the largest share of the Global Electronic Cartography Market in 2024?

North America held the largest share of the Global Electronic Cartography Market in 2024, supported by advanced technological infrastructure, defense investments, and strong adoption of navigation systems.

About Author

Sushant Phapale

Sushant Phapale

ICT & Automation Expert

Sushant is an expert in ICT, automation, and electronics with a passion for innovation and market trends.

View Profile

Related Reports

Cordless Power Tools Market

Cordless Power Tools Market size was valued USD 24.79 billion in 2024 and is anticipated to reach USD 50.12 billion by 2032, at a CAGR of 9.2% during the forecast period.

Entertainment Lighting Market

The Global Entertainment Lighting Market size was valued at USD 2,629.14 million in 2018 to USD 3,952.77 million in 2024 and is anticipated to reach USD 6,317.55 million by 2032, at a CAGR of 5.62% during the forecast period.

Engine Flush Market

The Global Engine Flush Market size was valued at USD 1,299.82 million in 2018 to USD 1,732.46 million in 2024 and is anticipated to reach USD 2,573.12 million by 2032, at a CAGR of 4.72% during the forecast period.

Emergency Warning Light Market

The Global Emergency Warning Light Market size was valued at USD 493.82 million in 2018 to USD 763.98 million in 2024 and is anticipated to reach USD 1,312.29 million by 2032, at a CAGR of 6.51% during the forecast period.

Electronic Prototyping Market

The Global Electronic Prototyping Market size was valued at USD 2,669.10 million in 2018 to USD 4,626.02 million in 2024 and is anticipated to reach USD 10,042.39 million by 2032, at a CAGR of 9.48% during the forecast period.

Electronic Display Market

The Global Electronic Display Market size was valued at USD 111.64 billion in 2018 to USD 174.36 billion in 2024 and is anticipated to reach USD 317.00 billion by 2032, at a CAGR of 7.23% during the forecast period.

Electronic Bike Shifter Market

The Global Electronic Bike Shifter Market size was valued at USD 1,369.46 million in 2018 and grew to USD 2,565.31 million in 2024. It is anticipated to reach USD 6,493.97 million by 2032, at a CAGR of 11.47% during the forecast period.

Drone Analytics Market

The drone analytics market was valued at USD 3.82 billion in 2024 and is projected to reach USD 26.03 billion by 2032, growing at a CAGR of 27.11% during the forecast period.

Ultrasonic Non-Destructive Testing (NDT) Market

Ultrasonic Non-Destructive Testing Market size was valued at USD 3.6 billion in 2024 and is projected to reach USD 6.3 billion by 2032, growing at a CAGR of 7.3% during the forecast period.

Rotary Limit Switches Market

The Rotary Limit Switches market was valued at USD 1.19 billion in 2024 and is projected to reach USD 1.61 billion by 2032, growing at a CAGR of 3.9% during the forecast period.

RF Tunable Filter Market

The RF Tunable Filter market was valued at USD 1.79 billion in 2024 and is projected to reach USD 2.72 billion by 2032, expanding at a CAGR of 5.4% during the forecast period.

Germany Heat Pump Market

The Germany Heat Pump Market was valued at USD 1.21 billion in 2024 and is projected to reach USD 2.61 billion by 2032, growing at a CAGR of 10.1% during the forecast period.

Licence Option

The report comes as a view-only PDF document, optimized for individual clients. This version is recommended for personal digital use and does not allow printing. Use restricted to one purchaser only.
$4999

To meet the needs of modern corporate teams, our report comes in two formats: a printable PDF and a data-rich Excel sheet. This package is optimized for internal analysis. Unlimited users allowed within one corporate location (e.g., regional office).
$6999

The report will be delivered in printable PDF format along with the report’s data Excel sheet. This license offers 100 Free Analyst hours where the client can utilize Credence Research Inc. research team. Permitted for unlimited global use by all users within the purchasing corporation, such as all employees of a single company.
$12999

Report delivery within 24 to 48 hours

Credence Staff 3

WILLIAM, North America

Support Staff at Credence Research

KEITH PHILLIPS, Europe

Lee - CR Sales Staff

LEE VALLANCE, Asia Pacific

Kieran Jameson

KIERAN JAMESON, Australia

Smallform of Sample request
User Review

Thank you for the data! The numbers are exactly what we asked for and what we need to build our business case.

Materials Scientist
(privacy requested)

User Review

The report was an excellent overview of the Industrial Burners market. This report does a great job of breaking everything down into manageable chunks.

Imre Hof
Management Assistant, Bekaert

cr-clients-logos

Request Sample