Market Overview:
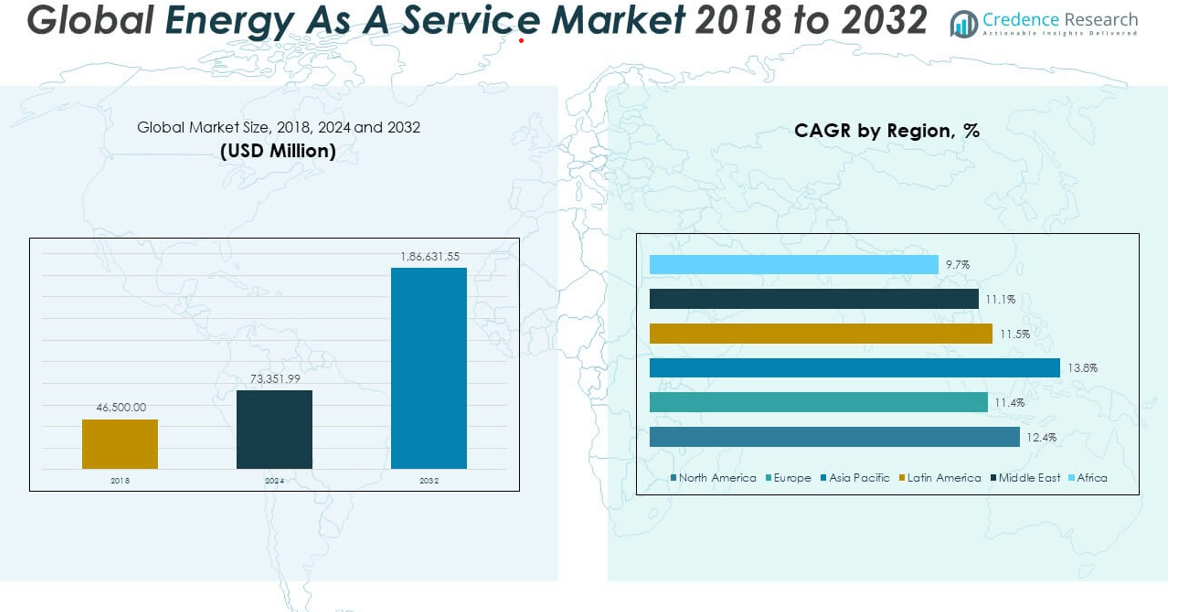
The Global Energy As A Service Market size was valued at USD 46,500.00 million in 2018 to USD 73,351.99 million in 2024 and is anticipated to reach USD 1,86,631.55 million by 2032, at a CAGR of 12.44% during the forecast period.
| REPORT ATTRIBUTE |
DETAILS |
| Historical Period |
2020-2023 |
| Base Year |
2024 |
| Forecast Period |
2025-2032 |
| Energy As A Service Market Size 2024 |
USD 73,351.99 million |
| Energy As A Service Market, CAGR |
12.44% |
| Energy As A Service Market Size 2032 |
USD 1,86,631.55 million |
Multiple factors are propelling the growth of the EaaS market globally. Rising energy costs, heightened pressure to reduce carbon emissions, and growing demand for energy efficiency are key drivers. Governments across regions are introducing stricter regulations on emissions and energy usage, compelling organizations to adopt sustainable solutions. The EaaS model provides integrated energy management that includes generation, storage, demand response, and optimization services, allowing consumers to achieve regulatory compliance and financial savings simultaneously. Advancements in digital technologies such as IoT, AI, and blockchain have further enabled real-time monitoring and predictive analytics, enhancing system reliability and efficiency. The rapid growth of distributed energy resources, including solar panels, wind turbines, and battery storage, supports the decentralization of energy infrastructure, allowing EaaS providers to deliver customized and localized energy solutions. The business model appeals particularly to companies aiming to outsource non-core functions while achieving energy performance targets.
Regionally, North America dominates the global EaaS market and accounted for the largest share in 2024, driven by advanced grid infrastructure, favorable regulatory frameworks, and early adoption by commercial and industrial players. The United States continues to lead in implementation, supported by strong incentives for energy efficiency and renewable energy deployment. Europe follows closely, fueled by aggressive decarbonization goals under the EU Green Deal and national initiatives in countries like Germany, the UK, and France, which are promoting EaaS to support grid flexibility and sustainable urban development. The Asia-Pacific region is emerging as the fastest-growing market due to rapid industrialization, expanding urban infrastructure, and rising energy demand in countries such as China, India, and Japan. Government investments in smart grids and renewable integration further accelerate EaaS adoption in the region. Latin America and the Middle East & Africa, though at earlier stages of development, are witnessing increasing interest in EaaS models, particularly in commercial and industrial segments, as they seek to modernize infrastructure and improve energy access. Across all regions, the convergence of policy support, digital innovation, and the shift toward sustainable energy practices continues to shape the future of the Energy as a Service market.
Market Insights:
- The market grew from USD 46,500 million in 2018 to USD 73,351.99 million in 2024 and is expected to reach USD 186,631.55 million by 2032, registering a CAGR of 12.44%.
- Businesses are adopting service-based energy models to convert high capital costs into predictable operational expenses and gain flexibility amid rising energy prices.
- National emission reduction mandates and carbon neutrality goals are pushing organizations to choose EaaS for achieving compliance and reducing environmental impact.
- Real-time monitoring, AI analytics, and blockchain integration in energy platforms are enhancing service transparency, efficiency, and scalability.
- Solar, wind, and battery storage integration is fueling decentralized energy services, enabling localized energy delivery and reduced grid dependence.
- Variations in grid access rules and the complexity of performance-based contracts slow adoption, especially for small and mid-sized enterprises.
- North America dominates the market with robust regulatory support and grid infrastructure, while Asia-Pacific is the fastest-growing region due to urbanization and smart grid investments.
Access crucial information at unmatched prices!
Request your sample report today & start making informed decisions powered by Credence Research Inc.!
Download Sample
Market Drivers:
Growing Demand for Cost-Effective and Flexible Energy Models Boosts Market Adoption:
Rising energy costs and financial constraints are prompting businesses and institutions to shift from capital-intensive utility models to service-based energy solutions. The Global Energy As A Service Market benefits from this shift, as it allows consumers to convert high capital expenditures into manageable operational expenses. EaaS models offer predictable energy pricing, helping organizations avoid market volatility and budgeting challenges. Service providers deliver comprehensive energy solutions—including generation, storage, and optimization—under performance contracts, minimizing client risk. Companies with limited technical expertise or capital investment capabilities find EaaS attractive due to its turnkey nature. It enables users to focus on core operations while maintaining reliable and efficient energy systems.
For instance, ENGIE North America’s EaaS partnership with The Ohio State University delivered a 25% reduction in campus energy consumption within the first three years, managing over 485 buildings and integrating advanced energy analytics to optimize performance.
Regulatory Pressure and Decarbonization Targets Accelerate Service-Based Solutions:
Government mandates on energy efficiency and emissions reduction continue to drive the Global Energy As A Service Market forward. Regulatory frameworks such as the EU Green Deal, U.S. federal efficiency standards, and national net-zero targets compel public and private organizations to adopt sustainable energy practices. EaaS providers offer integrated services that help clients comply with such regulations while maintaining performance and cost control. Services typically include energy audits, load management, and renewable integration, aligning with compliance requirements. It supports decarbonization strategies through the inclusion of clean technologies without requiring capital ownership from the customer. Policy-driven incentives and penalties further reinforce demand for outsourced energy solutions.
- For instance, Schneider Electric’s sustainability program has enabled clients to save and avoid 679 million tonnes of CO2 since 2018, with its Zero Carbon Project achieving a 36% reduction in supplier operational CO2 emissions by the end of 2024.
Technological Advancements in Smart Energy Infrastructure Enable Scalable Service Models:
The deployment of smart meters, IoT-enabled devices, and AI-powered analytics has transformed energy management into a data-driven service. The Global Energy As A Service Market capitalizes on this transformation by offering real-time monitoring, predictive maintenance, and dynamic load control. These capabilities allow for continuous energy optimization, improving efficiency and reducing waste. Technology platforms also enhance transparency, enabling clients to verify performance outcomes and contractual metrics. The integration of virtual power plants and blockchain-based settlement systems further increases market credibility and operational reliability. It enables energy service providers to scale offerings across multiple facilities and geographic regions.
Rising Distributed Energy Resources and Electrification Trends Expand Market Scope:
The rapid growth of distributed energy resources—including solar, wind, and battery storage—supports the decentralization of power systems. The Global Energy As A Service Market leverages this shift by bundling DERs with monitoring and financing solutions. Organizations looking to adopt clean energy systems can do so without owning or operating the assets directly. EaaS contracts simplify deployment and operational oversight, improving energy resilience and reducing dependency on centralized grids. At the same time, the electrification of transportation and industrial operations increases electricity demand, requiring smarter and more responsive energy services. It allows providers to meet evolving needs through modular, flexible infrastructure.
Market Trends:
Emergence of Subscription-Based Energy Offerings Reshapes Commercial Energy Procurement:
Subscription-based pricing models are becoming a core trend in the Global Energy As A Service Market, replacing traditional pay-per-use or fixed-rate utility models. Businesses increasingly prefer predictable monthly payments tied to performance metrics, which reduce budgeting uncertainty and align costs with energy outcomes. These contracts often include bundled services—such as maintenance, analytics, and system upgrades—under a single fee structure. It simplifies vendor relationships and supports long-term planning. The trend appeals to small and mid-sized enterprises that require energy expertise without hiring internal teams. Service providers are tailoring flexible contract durations and usage tiers to match customer-specific energy profiles.
- For instance, Siemens Smart Infrastructure implemented a comprehensive energy modernization program at Southern Methodist University in Texas, resulting in $2 million in annual energy savings and over $5.2 million in projected energy savings over two decades.
Integration of Energy-as-a-Service in Smart City Infrastructure Gains Momentum:
The shift toward smart cities has created demand for service-based energy models that support integrated urban systems. Municipalities are embedding energy management services into smart lighting, public EV charging, and traffic management infrastructure. The Global Energy As A Service Market addresses these needs by offering scalable, digitally controlled solutions that enhance urban efficiency and resilience. It enables real-time control of distributed assets, supports data analytics for city planning, and improves citizen services through uninterrupted energy availability. Public-private partnerships are emerging to fund and operate such systems, ensuring performance guarantees while limiting public-sector capital exposure. EaaS models are becoming central to smart city design strategies globally.
- For instance, Enel X’s smart city EaaS deployment in Barcelona manages more than 12,000 smart streetlights and 500 EV charging stations, reducing municipal energy use by 30% and supporting real-time city operations through a unified digital platform.
Growing Demand for Resilience and Microgrid-as-a-Service Solutions:
Frequent weather disruptions and grid instability have increased interest in resilience-focused service models, especially Microgrid-as-a-Service (MaaS). The Global Energy As A Service Market is seeing a shift toward turnkey microgrid solutions that combine solar, storage, and backup generation under a service contract. These systems operate both in grid-connected and islanded modes, ensuring energy continuity during outages. It supports critical facilities such as hospitals, data centers, and industrial plants that cannot afford downtime. Service providers handle design, installation, operations, and maintenance, offering guaranteed uptime through service-level agreements. The ability to localize control and mitigate grid dependence drives growing preference for this trend.
Expansion of Integrated Facility Energy Services through Strategic Outsourcing:
Organizations are expanding their use of outsourced facility management to include energy services as a core component. The Global Energy As A Service Market supports this shift by enabling facility operators to bundle lighting, HVAC optimization, energy storage, and demand response into unified service agreements. It streamlines vendor engagement and enhances operational efficiency by centralizing energy decision-making. Integrated services improve facility-level sustainability metrics, reduce operating costs, and align with environmental, social, and governance (ESG) goals. Multisite operations especially benefit from centralized dashboards and remote monitoring capabilities. Energy becomes a managed asset class rather than a utility expense line.
Market Challenges Analysis:
High Complexity of Contract Structures and Performance Measurement Slows Adoption:
Many organizations hesitate to adopt the Global Energy As A Service Market due to the complexity of contract structures and performance metrics. Long-term service agreements often include variable pricing models, shared savings mechanisms, and technical service-level guarantees that require in-depth legal and financial understanding. It creates a barrier for small and mid-sized businesses lacking internal energy or procurement expertise. Verifying energy savings and calculating return on investment can be difficult, particularly when usage patterns fluctuate or when multiple technologies are bundled in one contract. Some customers remain skeptical of vendor accountability and long-term value delivery, delaying procurement decisions. The market must continue to evolve toward simpler, transparent, and standardized agreement frameworks.
Interconnection Issues and Regulatory Fragmentation Disrupt Market Scalability:
The decentralized nature of energy systems introduces interconnection challenges that limit the deployment of distributed energy services under EaaS models. The Global Energy As A Service Market faces inconsistent utility rules, permitting processes, and grid access protocols across regions and countries. It restricts service providers from scaling standardized solutions across multiple geographies. Regulatory fragmentation also leads to uneven incentives, compliance requirements, and grid integration capabilities, adding cost and complexity to service delivery. In emerging markets, outdated infrastructure further complicates implementation timelines. EaaS providers must navigate diverse technical standards and policy environments to maintain operational efficiency and regulatory compliance. Overcoming these challenges requires stronger coordination between energy service firms, grid operators, and policymakers.
Market Opportunities:
Expansion into Emerging Markets with Infrastructure Modernization Needs Creates Growth Pathways:
Rapid urbanization and industrialization in regions such as Asia-Pacific, Latin America, and parts of Africa present strong growth potential for the Global Energy As A Service Market. Many countries in these regions seek to modernize aging energy infrastructure and improve grid reliability. It offers service providers an opportunity to deliver distributed energy, storage, and efficiency solutions without requiring major public capital investment. Governments are supporting energy access and clean power initiatives, creating favorable conditions for EaaS models. Demand for energy reliability in commercial and manufacturing sectors strengthens the case for long-term service agreements. EaaS firms can establish early mover advantages in markets where conventional utilities fall short.
Digital Integration and Smart Infrastructure Adoption Unlock Scalable Business Models:
The growing adoption of IoT, edge computing, and AI in energy systems opens new avenues for service innovation in the Global Energy As A Service Market. It enables real-time energy management, predictive maintenance, and automated load optimization across facilities. As smart buildings and smart city projects expand globally, demand rises for integrated service platforms. EaaS providers can embed advanced analytics and control systems to deliver measurable performance outcomes. The ability to aggregate and manage distributed assets under a single digital interface enhances service value. This shift allows providers to offer scalable, modular solutions tailored to complex customer needs.
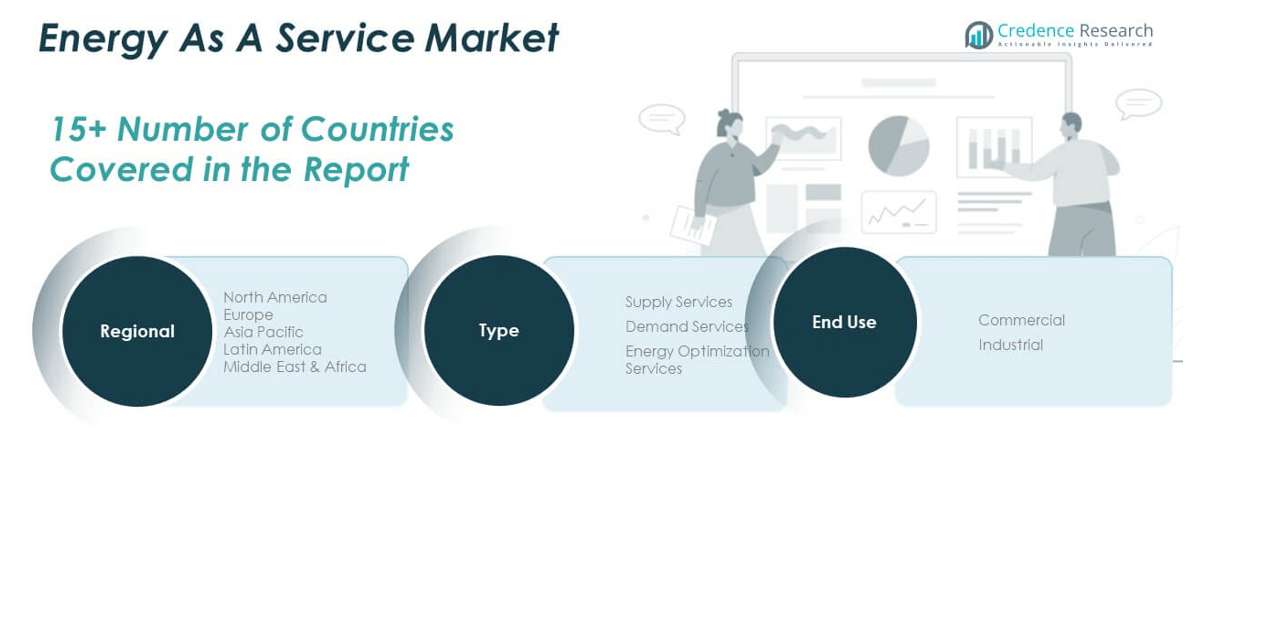
Market Segmentation Analysis:
By Type
The Global Energy As A Service Market is segmented into Supply Services, Demand Services, and Energy Optimization Services. Supply Services hold the leading position, driven by increasing demand for reliable power supply through third-party energy providers. Businesses opt for service-based models to reduce capital expenditure and ensure uninterrupted energy availability. Demand Services are expanding as organizations seek better control over energy consumption through load shifting, demand response, and usage analytics. Energy Optimization Services are gaining traction, supported by the integration of smart technologies and real-time data that enhance system efficiency and support emission reduction goals.
- For instance, Johnson Controls’ EaaS projects have delivered over 1,000 MW of supply and demand services globally, with their optimization platforms achieving up to 18% energy savings in large-scale commercial deployments.
By End Use
By end use, the commercial sector dominates the market. High energy requirements in commercial buildings, hospitals, data centers, and retail facilities contribute to strong demand for service-based energy models that improve cost management and operational reliability. The industrial sector is also showing robust growth. Manufacturers and heavy industries adopt energy-as-a-service solutions to manage high energy intensity, meet regulatory standards, and achieve decarbonization objectives. The need to streamline operations and minimize energy waste continues to drive adoption in both segments.
- For instance, Veolia’s energy management projects in healthcare, such as at the Royal Berkshire Hospital, have achieved a 25% carbon footprint reduction by 2015 and annual energy savings of 3.8 GWh of gas and 850 tonnes of carbon through the installation of hydrogen-ready boilers and advanced control systems.
Segmentation:
By Type
- Supply Services
- Demand Services
- Energy Optimization Services
By End Use
By Region
- North America
- Europe
- UK
- France
- Germany
- Italy
- Spain
- Russia
- Rest of Europe
- Asia Pacific
- China
- Japan
- South Korea
- India
- Australia
- Southeast Asia
- Rest of Asia Pacific
- Latin America
- Brazil
- Argentina
- Rest of Latin America
- Middle East
- GCC Countries
- Israel
- Turkey
- Rest of Middle East
- Africa
- South Africa
- Egypt
- Rest of Africa
Regional Analysis:
North America
The North America Energy As A Service Market size was valued at USD 19,855.50 million in 2018 to USD 30,998.11 million in 2024 and is anticipated to reach USD 78,777.51 million by 2032, at a CAGR of 12.4% during the forecast period. North America holds the largest share of the Global Energy As A Service Market, accounting for approximately 39.5% of the total revenue in 2024. The region benefits from a mature energy infrastructure, strong digital adoption, and widespread deployment of distributed energy resources. Commercial and industrial enterprises in the U.S. and Canada are increasingly outsourcing energy management to reduce costs and meet sustainability mandates. Government incentives and state-level energy efficiency programs continue to drive demand for supply, demand, and optimization services. It also supports innovation through advanced technologies such as AI-driven energy analytics and real-time load balancing platforms.
Europe
The Europe Energy As A Service Market size was valued at USD 9,169.80 million in 2018 to USD 13,714.82 million in 2024 and is anticipated to reach USD 32,278.42 million by 2032, at a CAGR of 11.4% during the forecast period. Europe contributes approximately 17.5% of the Global Energy As A Service Market in 2024. Regulatory pressure related to carbon neutrality and energy performance in buildings accelerates the transition toward service-based models. Countries like Germany, France, and the UK are witnessing rapid adoption of decentralized and renewable energy solutions. It is also driven by high electricity prices, which encourage enterprises to pursue efficiency-focused energy contracts. Strategic partnerships between utilities and energy service companies support the development of integrated solutions across multiple sectors.
Asia Pacific
The Asia Pacific Energy As A Service Market size was valued at USD 11,392.50 million in 2018 to USD 18,766.80 million in 2024 and is anticipated to reach USD 52,686.24 million by 2032, at a CAGR of 13.8% during the forecast period. Asia Pacific holds around 23.9% of the Global Energy As A Service Market in 2024. Rapid urbanization, rising energy demand, and a strong push for clean energy drive market growth in countries such as China, India, Japan, and South Korea. Industrial consumers in the region seek flexible service models to manage energy volatility and support production continuity. Government policies that encourage energy efficiency and renewable integration further enhance adoption. It continues to attract global energy service providers investing in scalable, tech-enabled platforms.
Latin America
The Latin America Energy As A Service Market size was valued at USD 3,352.65 million in 2018 to USD 5,243.93 million in 2024 and is anticipated to reach USD 12,498.71 million by 2032, at a CAGR of 11.5% during the forecast period. Latin America accounts for roughly 6.7% of the Global Energy As A Service Market in 2024. Growth is supported by rising electricity costs, aging infrastructure, and a growing emphasis on distributed energy deployment. Brazil and Mexico are leading in service-based energy procurement, especially within commercial and industrial sectors. Energy service companies are partnering with local utilities to offer cost-effective, low-risk solutions tailored to regional energy dynamics. It is becoming a key enabler for expanding renewable power access across grid-constrained areas.
Middle East
The Middle East Energy As A Service Market size was valued at USD 1,808.85 million in 2018 to USD 2,676.87 million in 2024 and is anticipated to reach USD 6,159.87 million by 2032, at a CAGR of 11.1% during the forecast period. The region represents about 3.4% of the Global Energy As A Service Market in 2024. Efforts to diversify energy sources and reduce reliance on fossil fuels are pushing Gulf countries to adopt service-based energy models. Commercial developments in Saudi Arabia, the UAE, and Qatar increasingly utilize energy-as-a-service contracts to meet sustainability targets. Government initiatives aligned with national energy transition goals support new investments. It shows growing demand for solar-based supply services and performance-focused optimization solutions.
Africa
The Africa Energy As A Service Market size was valued at USD 920.70 million in 2018 to USD 1,951.46 million in 2024 and is anticipated to reach USD 4,230.80 million by 2032, at a CAGR of 9.7% during the forecast period. Africa contributes about 2.5% of the Global Energy As A Service Market in 2024. Limited grid access and high dependency on diesel generators create strong demand for decentralized, service-based energy systems. Countries like South Africa, Kenya, and Nigeria are adopting renewable-driven supply and optimization services for both urban and rural areas. Energy-as-a-service models offer cost-effective alternatives for underserved populations and businesses. It presents a long-term opportunity for market expansion as infrastructure investment accelerates across the continent.
Shape Your Report to Specific Countries or Regions & Enjoy 30% Off!
Key Player Analysis:
- Schneider Electric
- Siemens
- Engie
- Honeywell International Inc.
- Veolia
- EDF
- Johnson Controls
- Bernhard
- General Electric
- Entegrity
- Enel SpA
- Ørsted A/S
- NORESCO, LLC
- Centrica plc
- Wendel
Competitive Analysis:
The Global Energy As A Service Market is highly competitive, driven by increasing demand for flexible, cost-effective energy solutions. Key players include Schneider Electric, Siemens AG, ENGIE, Johnson Controls, Veolia, and Honeywell. These companies offer integrated services covering energy supply, demand management, and optimization through digital platforms and performance-based contracts. Strategic partnerships, acquisitions, and investments in smart grid technologies strengthen their market position. Regional players and emerging energy service companies are also expanding their portfolios to address local energy challenges. It fosters innovation through the integration of AI, IoT, and predictive analytics, allowing providers to deliver tailored energy solutions. Companies focus on delivering measurable outcomes such as reduced energy consumption, lower operational costs, and improved sustainability metrics. The market favors players with strong technical expertise, global presence, and the ability to deliver scalable, turnkey solutions across commercial and industrial sectors. Competitive intensity is expected to rise with growing service adoption.
Recent Developments:
- In June 2025, Veolia announced the launch of Drop®, a new patented technology in Europe capable of achieving up to 99.9999% destruction of targeted PFAS contaminants. This technological breakthrough addresses critical environmental challenges and demonstrates Veolia’s leadership in advanced water treatment solutions.
- In June 2025, Johnson Controls introduced the Hygood® Inert Gas System 300 (IGS-300), strengthening its fire suppression product line. The company also launched an innovative capacity reservation system for data center clients, enabling large-scale clients to secure manufacturing slots and supporting the expansion of integrated solutions for thermal management and intelligent building automation in the data center sector.
- In May 2025, EDF Renewables North America and EDF International Division Americas merged to form EDF Power Solutions North America. This strategic integration pools expertise across renewables, storage, transmission, and microgrids, enabling EDF to offer a comprehensive portfolio of low-carbon energy solutions and support decarbonization efforts throughout North America.
Additionally, EDF’s Nuward subsidiary relaunched the development of its small modular reactor (SMR) in January 2025, with a focus on finalizing the conceptual design by mid-2026 and targeting the 2030s for market entry.
- In April 2025, Honeywell launched Protonium™, an advanced AI-enabled suite of technologies aimed at optimizing green hydrogen production. Protonium™ enhances electrolysis efficiency and plant operations through predictive control algorithms and digital twins. The technology will first be deployed by Aternium at the Mid-Atlantic Clean Hydrogen Hub, supporting the scaling of clean hydrogen production in the United States.
- In January 2025, Siemens introduced breakthrough industrial AI and digital twin technologies at CES 2025. The new Siemens Industrial Copilot for Operations brings AI capabilities directly to the shop floor, enabling rapid, real-time decision-making for operators and maintenance engineers. Siemens also expanded its Industrial Edge ecosystem, integrating advanced AI for deploying and managing models in production environments.
Market Concentration & Characteristics:
The Global Energy As A Service Market is moderately concentrated, with a mix of global conglomerates and specialized service providers competing for market share. It is characterized by a high degree of service integration, contract-based revenue models, and performance-driven delivery. Large players such as Schneider Electric, Siemens, and ENGIE maintain strong positions through end-to-end solutions and long-term energy performance contracts. The market exhibits strong demand from commercial and industrial sectors seeking operational efficiency and sustainability. Technological innovation, regulatory alignment, and energy transition goals shape service offerings and market strategies. It continues to evolve with growing emphasis on digital platforms, decentralized energy assets, and outcome-based models that deliver cost savings and carbon reduction.
Report Coverage:
The research report offers an in-depth analysis based on type and end use. It details leading market players, providing an overview of their business, product offerings, investments, revenue streams, and key applications. Additionally, the report includes insights into the competitive environment, SWOT analysis, current market trends, as well as the primary drivers and constraints. Furthermore, it discusses various factors that have driven market expansion in recent years. The report also explores market dynamics, regulatory scenarios, and technological advancements that are shaping the industry. It assesses the impact of external factors and global economic changes on market growth. Lastly, it provides strategic recommendations for new entrants and established companies to navigate the complexities of the market.
Future Outlook:
- Rising energy costs will accelerate demand for outsourced energy management solutions across commercial and industrial sectors.
- Decentralized energy generation will drive adoption of service-based models for power supply and reliability.
- Digitalization and IoT integration will enhance real-time monitoring, automation, and performance optimization.
- Regulatory mandates focused on energy efficiency and emissions will expand the market for compliance-driven services.
- Demand for renewable energy will strengthen partnerships between energy service providers and clean energy developers.
- Emerging markets in Asia Pacific and Africa will offer new growth opportunities through grid-independent service models.
- Corporates will prioritize sustainability-linked contracts to meet environmental, social, and governance (ESG) targets.
- Growth in microgrids and storage solutions will complement energy-as-a-service frameworks for resilience.
- Innovative pricing models, including subscription and outcome-based agreements, will gain traction.
- Advancements in AI and predictive analytics will support proactive energy planning and cost optimization.


