Market Overview
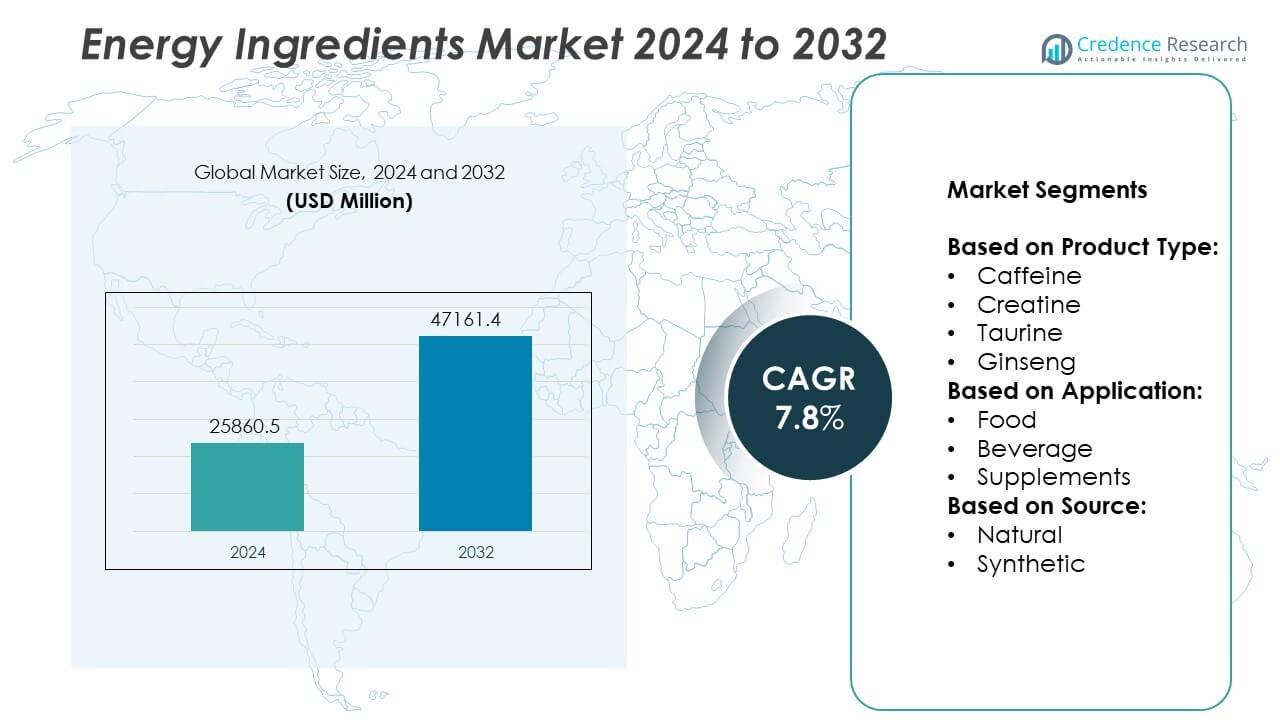
The Energy Ingredients market size was valued at USD 25,860.5 million in 2024 and is anticipated to reach USD 47,161.4 million by 2032, growing at a CAGR of 7.8% during the forecast period.
| REPORT ATTRIBUTE |
DETAILS |
| Historical Period |
2020-2024 |
| Base Year |
2024 |
| Forecast Period |
2025-2032 |
| Energy Ingredients Market Size 2024 |
USD 25,860.5Million |
| Energy Ingredients Market, CAGR |
7.8% |
| Energy Ingredients Market Size 2032 |
USD 47,161.4 Million |
The Energy Ingredient market experiences robust growth driven by rising consumer focus on health, wellness, and demand for convenient energy-boosting products. Increased adoption of natural and plant-based ingredients, alongside innovations in personalized nutrition, fuels market expansion. Growing applications across food, beverage, and supplement sectors enhance product diversity and accessibility. Trends emphasize clean-label formulations, transparency, and technological advancements such as improved ingredient delivery and bioavailability. These factors collectively encourage manufacturers to innovate while meeting evolving regulatory standards and consumer preferences, positioning the market for sustained growth and broader global adoption.
The Energy Ingredient market shows dynamic growth across regions, with North America and Europe leading due to high consumer awareness and advanced regulatory frameworks. Asia Pacific demonstrates rapid expansion driven by urbanization and rising disposable incomes. Key players such as BASF SE, Korea Ginseng Corporation, Spectrum Chemical Mfg. Corp., and RFI Ingredients drive innovation and market penetration through diverse product portfolios and strong distribution networks. These companies focus on developing natural, sustainable ingredients and investing in research to meet evolving consumer demands globally, reinforcing their competitive positions in this expanding market.
Access crucial information at unmatched prices!
Request your sample report today & start making informed decisions powered by Credence Research Inc.!
Download Sample
Market Insights
- The Energy Ingredient market was valued at USD 25,860.5 million in 2024 and is expected to reach USD 47,161.4 million by 2032, growing at a CAGR of 7.8% during the forecast period.
- Rising consumer awareness about health and wellness significantly drives demand for energy ingredients that improve physical and mental performance.
- Increasing preference for natural and plant-based ingredients fuels innovation, while personalized nutrition and clean-label trends shape product development.
- The market witnesses strong competition among key players such as BASF SE, Korea Ginseng Corporation, and Spectrum Chemical Mfg. Corp., who invest heavily in R&D and sustainable sourcing.
- Regulatory challenges, including stringent safety standards and complex compliance requirements, act as restraints, increasing time and costs for product approvals.
- North America and Europe dominate the market due to advanced infrastructure and health-conscious consumers, while Asia Pacific shows the fastest growth driven by urbanization and rising disposable incomes.
- Expanding applications across food, beverages, and supplements create diverse opportunities for manufacturers to capture new customer segments and geographic regions.
Market Drivers
Significant Growth in Health and Wellness Awareness Boosts Demand for Energy Ingredients
The rising global focus on health and wellness plays a pivotal role in driving the Energy Ingredient market. Consumers increasingly seek products that enhance physical performance, mental alertness, and overall vitality. This shift encourages manufacturers to develop innovative formulations that include natural and functional energy ingredients. Ingredients such as caffeine, taurine, and ginseng gain popularity for their proven efficacy. Growing awareness about the benefits of clean-label and organic products further expands the consumer base. It also pushes companies to prioritize transparency and ingredient quality to meet evolving expectations.
- For instance, Korea Ginseng Corporation reported producing over 5 million standardized ginseng extract units annually to meet rising global demand for natural health supplements.
Expanding Application Across Diverse Food and Beverage Categories Spurs Market Expansion
The Energy Ingredient market experiences steady growth due to its wide adoption across multiple food and beverage sectors. Energy drinks, nutritional bars, and dietary supplements prominently incorporate these ingredients to meet consumer demand for convenient energy sources. Functional beverages and fortified snacks also increasingly use energy components to enhance product appeal. Manufacturers capitalize on this trend by introducing diverse product lines that cater to various lifestyle needs. The ability to blend energy ingredients seamlessly into different formulations strengthens market penetration. It encourages continuous innovation and product diversification.
- For instance, BASF SE launched a line of customized energy ingredient blends, supplying over 3,000 tons annually to beverage manufacturers worldwide.
Technological Advancements Facilitate Enhanced Ingredient Efficiency and Safety
Ongoing research and development efforts improve the effectiveness and safety profiles of energy ingredients, supporting market growth. Enhanced extraction techniques and formulation technologies ensure higher purity and stability of active compounds. Scientific validation of ingredient benefits builds consumer trust and regulatory approval processes. Companies invest in bioavailability studies to optimize absorption and maximize the impact of these components. It enables the development of next-generation energy products that meet stringent safety standards. These innovations help maintain competitive advantage and attract a broader customer base.
Rising Urbanization and Increasing Disposable Income Drive Consumption Patterns
Urban populations with busy lifestyles create strong demand for quick and reliable energy sources, benefiting the Energy Ingredient market. Increasing disposable income allows consumers to spend more on premium and functional products that support active living. Busy professionals, students, and athletes represent key target groups seeking enhanced energy solutions. The growth of modern retail channels improves product accessibility and variety. It supports the market by enabling faster adoption of new energy ingredient-based products. Expanding consumer awareness about energy management further fuels sustained demand.
Market Trends
Growing Demand for Natural and Plant-Based Energy Ingredients Shapes Market Dynamics
The Energy Ingredient market witnesses a notable shift toward natural and plant-based alternatives. Consumers prefer ingredients derived from botanical sources such as guarana, green tea extract, and yerba mate due to perceived health benefits and clean-label preferences. Manufacturers respond by incorporating these ingredients into product formulations that emphasize organic and sustainable sourcing. This trend aligns with the broader movement toward wellness and environmentally conscious consumption. It drives innovation in ingredient extraction and product development to meet consumer expectations. The focus on transparency and ethical sourcing enhances brand reputation and loyalty.
- For instance, Archer Daniels Midland (ADM) processes approximately 1.7 million kilograms of green tea extract annually, supplying major beverage and supplement brands with standardized catechin-rich formulations.
Increasing Incorporation of Personalized Nutrition Trends in Energy Products
Personalized nutrition gains traction within the Energy Ingredient market as consumers seek tailored energy solutions. Advances in digital health tools and genetic testing enable customized recommendations based on individual needs and lifestyles. Companies develop formulations that address specific energy requirements, such as sustained focus or rapid recovery. It encourages collaboration between ingredient suppliers, manufacturers, and technology providers to create targeted offerings. This trend promotes higher consumer engagement and repeat purchases by meeting unique preferences. It also stimulates investment in research to better understand ingredient interactions and efficacy in personalized applications.
- For instance, Naturalin Bio-Resources Co., Ltd. reported an annual production capacity exceeding 1,000 tons of plant-based extracts, including green tea and guarana, meeting international organic certification standards to supply major global food and beverage manufacturers.
Rising Popularity of Clean-Label and Transparent Product Offerings Drives Innovation
Consumers demand clean-label products with simple, recognizable ingredients, which impacts the Energy Ingredient market significantly. Manufacturers reformulate products to eliminate artificial additives and focus on natural preservatives and sweeteners. Transparency in labeling and clear communication about ingredient sources become essential for building consumer trust. It encourages brands to highlight functional benefits supported by scientific evidence. This trend leads to increased investment in sustainable packaging and ethical marketing practices. It reinforces consumer confidence and influences purchase decisions positively.
Technological Integration in Product Development Enhances Market Competitiveness
The Energy Ingredient market benefits from technological advances that optimize ingredient performance and product stability. Techniques such as microencapsulation improve ingredient delivery, taste masking, and shelf life. Digital tools assist in formulation design, enabling faster product launches with precise ingredient combinations. It supports manufacturers in meeting regulatory requirements and quality standards efficiently. Collaboration with research institutions accelerates innovation in bioactive compounds and synergistic blends. This trend contributes to differentiation in a crowded market and meets evolving consumer demands for effective energy solutions.
Market Challenges Analysis
Stringent Regulatory Landscape and Compliance Requirements Pose Challenges to Market Growth
The Energy Ingredient market faces considerable challenges due to strict regulatory frameworks governing ingredient safety and labeling. Different countries enforce varied standards, creating complexity for manufacturers seeking global distribution. Compliance with these regulations demands extensive testing and documentation, increasing time and costs. It requires continuous monitoring of policy changes and adherence to quality controls to avoid penalties or product recalls. Regulatory uncertainty surrounding novel ingredients further complicates product development. Companies must invest in robust compliance strategies to navigate these hurdles while maintaining product innovation.
Concerns over Health Risks and Consumer Skepticism Impact Market Acceptance
Health concerns related to excessive consumption of certain energy ingredients create barriers for the Energy Ingredient market. Negative publicity around stimulant effects or potential side effects leads to cautious consumer behavior. It forces manufacturers to limit ingredient concentrations and provide clear usage guidance to build trust. The presence of counterfeit or low-quality products in the market undermines consumer confidence and brand credibility. Companies need to emphasize transparency, scientific validation, and responsible marketing to address skepticism. These challenges slow market penetration and require concerted efforts to educate consumers about safe and effective usage
Market Opportunities
Expansion into Emerging Markets with Growing Health-Conscious Consumer Bases Presents Significant Opportunities
The Energy Ingredient market holds strong potential in emerging economies where rising disposable incomes and urbanization fuel demand for functional products. Increasing health awareness in these regions encourages consumers to seek energy-boosting ingredients that support active lifestyles. It enables manufacturers to introduce tailored product lines that cater to local preferences and dietary habits. Expanding retail infrastructure and e-commerce channels improve accessibility and market reach. Companies can capitalize on these trends by establishing strategic partnerships and investing in localized marketing efforts. This approach drives market penetration and long-term growth in underexplored areas.
Development of Innovative Formulations and Integration with Digital Health Technologies Opens New Revenue Streams
Innovation in ingredient combinations and delivery formats creates opportunities for differentiation within the Energy Ingredient market. Formulations targeting specific benefits such as cognitive enhancement, endurance, or stress relief attract diverse consumer segments. It supports the rise of personalized nutrition solutions that align with individual health goals. Collaboration with digital health platforms enables real-time monitoring and customization, enhancing user engagement and product effectiveness. Advances in biotechnology and sustainable sourcing further contribute to product innovation. These factors collectively broaden the market scope and encourage sustained investment in research and development.
Market Segmentation Analysis:
By Product Type:
Caffeine dominates due to its widespread use in energy drinks and supplements, offering quick and effective stimulation. Creatine holds significant demand within sports nutrition for enhancing muscle performance and recovery. Taurine finds applications primarily in energy beverages, valued for its potential to improve endurance and cognitive function. Ginseng attracts consumers seeking natural adaptogens with holistic health benefits. Each product type addresses distinct consumer needs, driving innovation and targeted marketing efforts.
- For instance, Orkla supplies energy ingredients to more than 1,200 food manufacturers worldwide, focusing on functional snack bars and fortified food products.
By Application:
The market spans food, beverage, and supplements sectors. The beverage segment remains the largest, driven by the popularity of energy drinks and functional beverages that provide convenient energy boosts. The food segment incorporates energy ingredients into snacks, bars, and fortified products that appeal to active consumers requiring on-the-go nutrition. Supplements offer concentrated doses tailored to fitness enthusiasts and individuals focused on wellness. It benefits from increasing health awareness and the desire for personalized nutrition solutions. The diversity of applications allows manufacturers to cater to various consumption occasions and preferences.
- For instance, Naturalin Bio-Resources Co., Ltd. produces over 1,200 tons of certified organic botanical extracts annually, supplying global manufacturers focused on natural energy solutions.
By Source:
The market divides into natural and synthetic ingredients. Natural sources gain traction due to rising consumer demand for clean-label and organic products. Ingredients derived from plants and herbs, such as ginseng and green tea extracts, resonate well with health-conscious buyers. Synthetic ingredients, including lab-produced caffeine and creatine, offer consistency, cost efficiency, and scalability, making them suitable for large-scale production. It requires manufacturers to balance consumer preferences with supply chain and regulatory considerations. Both sources play complementary roles, enabling product innovation and expanded market reach.
Segments:
Based on Product Type:
- Caffeine
- Creatine
- Taurine
- Ginseng
Based on Application:
- Food
- Beverage
- Supplements
Based on Source:
Based on the Geography:
- North America
- Europe
- UK
- France
- Germany
- Italy
- Spain
- Russia
- Belgium
- Netherlands
- Austria
- Sweden
- Poland
- Denmark
- Switzerland
- Rest of Europe
- Asia Pacific
- China
- Japan
- South Korea
- India
- Australia
- Thailand
- Indonesia
- Vietnam
- Malaysia
- Philippines
- Taiwan
- Rest of Asia Pacific
- Latin America
- Brazil
- Argentina
- Peru
- Chile
- Colombia
- Rest of Latin America
- Middle East
- UAE
- KSA
- Israel
- Turkey
- Iran
- Rest of Middle East
- Africa
- Egypt
- Nigeria
- Algeria
- Morocco
- Rest of Africa
Regional Analysis
North America
North America holds a significant portion of the Energy Ingredient market, accounting for around 35% of the global share. The region benefits from high consumer awareness regarding health and wellness, combined with strong demand for energy-boosting products across various age groups. The United States, as the largest economy, drives market growth through widespread consumption of energy drinks, dietary supplements, and functional foods. Strict regulatory standards ensure product safety and quality, encouraging manufacturers to invest heavily in research and innovation. Technological advancements and well-established distribution networks also contribute to robust market penetration. The increasing popularity of clean-label and natural energy ingredients further strengthens the region’s market position. It continues to attract new entrants and encourages product diversification to meet evolving consumer preferences.
Europe
Europe accounts for about 28% of the global Energy Ingredient market, driven by strong demand from both Western and emerging European countries. Rising health consciousness and an aging population support steady growth in energy ingredient consumption, especially in functional beverages and supplements. Countries like Germany, the UK, and France lead due to high purchasing power and advanced retail infrastructure. Regulatory frameworks emphasize ingredient safety and transparency, influencing product development and marketing strategies. The region also shows increasing interest in natural and plant-based ingredients, supporting sustainability trends. It supports innovation in personalized nutrition and clean-label products, attracting investment from both local and multinational companies. Europe’s focus on scientific validation and clinical research further enhances consumer confidence and market stability.
Asia Pacific
Asia Pacific represents approximately 25% of the Energy Ingredient market and exhibits the fastest growth among all regions. Rapid urbanization, rising disposable incomes, and growing health awareness fuel demand for energy-enhancing products. Key markets such as China, India, Japan, and South Korea drive this expansion through increased adoption of energy drinks, fortified foods, and dietary supplements. Younger demographics and busy lifestyles support the consumption of convenient energy solutions. It benefits from expanding retail channels, including e-commerce platforms, which improve product accessibility. The region also shows a strong preference for natural and herbal ingredients, aligning with traditional wellness practices. Manufacturers invest heavily in localized product development to cater to diverse consumer needs and regulatory environments. This growth trajectory positions Asia Pacific as a critical market for future opportunities.
Latin America
Latin America holds around 7% of the Energy Ingredient market share, supported by rising urbanization and increasing health awareness. Brazil and Mexico serve as the primary contributors, with growing middle-class populations seeking functional and energy-boosting products. The expansion of modern retail infrastructure and digital sales channels facilitates greater product availability. It faces challenges related to economic volatility and regulatory complexity, but increasing consumer demand encourages ongoing market development. Regional manufacturers focus on affordability and localized flavors to attract consumers. The market also explores natural ingredient incorporation to appeal to emerging clean-label trends. These factors collectively support steady growth and gradual market penetration.
Middle East and Africa
The Middle East and Africa account for about 5% of the Energy Ingredient market, characterized by emerging demand driven by urbanization and lifestyle changes. The region experiences growing interest in energy drinks and supplements among younger populations and working professionals. Economic diversification and investments in healthcare infrastructure support market expansion. It faces regulatory challenges and supply chain limitations that require strategic management by manufacturers. The increasing popularity of natural ingredients aligns well with regional preferences for traditional and herbal remedies. Companies focus on product innovation and educational marketing to overcome consumer skepticism and promote adoption. This region offers long-term growth potential through targeted strategies and enhanced distribution networks.
Shape Your Report to Specific Countries or Regions & Enjoy 30% Off!
Key Player Analysis
- Korea Ginseng Corporation
- Applied Food Sciences, Inc.
- BASF SE
- Orkla
- Changsha Huir Biological-Tech Co., Ltd.
- Spectrum Chemical Mfg. Corp.
- Sinochem Pharmaceutical Co., Ltd.
- ILHWA CO., LTD.
- RFI Ingredients
- Naturalin Bio-Resources Co., Ltd.
- KOEI KOGYO CO., LTD.
- Aarti Industries Ltd.
Competitive Analysis
Key players in the Energy Ingredient market include BASF SE, Korea Ginseng Corporation, Spectrum Chemical Mfg. Corp., RFI Ingredients, Orkla, and Applied Food Sciences, Inc. These companies maintain competitive advantages through continuous investment in research and development, focusing on innovative and sustainable ingredient solutions. They emphasize product quality, regulatory compliance, and strategic partnerships to expand their global reach. Many leading firms prioritize natural and plant-based ingredients to meet rising consumer demand for clean-label products. Advanced manufacturing capabilities and efficient supply chains enable timely delivery and cost optimization. Companies also leverage digital technologies for personalized nutrition offerings and improved product formulations. Strong branding and extensive distribution networks support market penetration across diverse regions. These factors collectively help maintain market leadership and drive ongoing growth in the evolving Energy Ingredient sector.
Recent Developments
- In August 2023, Sinochem also expanded para-aramid capacity, launching a 2,500 tons/year expansion project.
- In 2023, Orkla formed a collaboration with Rhône, a private equity group. Rhône investment funds acquired a 25% stake in Orkla Food Ingredients AS, a deal valuing NOK 15.5 billion, signaling strategic growth and capital investment.
- In 2022, Fuerst Day Lawson Ltd., a UK-based food company acquired Quest Ingredients Ltd. for an undisclosed amount. With this acquisition, Fuerst Day Lawson Ltd aims to expand its portfolio of ingredients and formulated solutions in Europe and the United States. Quest Ingredients Ltd. is a UK-based company involved in manufacturing energy ingredients such as active botanical extracts, and herbal ingredients.
Market Concentration & Characteristics
The Energy Ingredient market exhibits a moderately concentrated competitive landscape, with several established players holding significant market shares alongside numerous smaller companies. It is characterized by ongoing innovation and diversification, driven by evolving consumer preferences toward natural, clean-label, and functional products. Leading companies leverage advanced research capabilities and extensive distribution networks to maintain strong positions, while emerging firms focus on niche segments and novel ingredient development. The market demands strict compliance with regulatory standards, which creates barriers to entry and encourages collaboration between ingredient suppliers and manufacturers. It also features rapid product development cycles to respond to shifting trends in health, wellness, and personalized nutrition. Sustainable sourcing and technological advancements play crucial roles in shaping competitive dynamics. Overall, the market combines the strengths of global corporations with the agility of specialized providers, fostering a dynamic environment that supports continuous growth and innovation.
Report Coverage
The research report offers an in-depth analysis based on Product Type, Application, Source and Geography. It details leading market players, providing an overview of their business, product offerings, investments, revenue streams, and key applications. Additionally, the report includes insights into the competitive environment, SWOT analysis, current market trends, as well as the primary drivers and constraints. Furthermore, it discusses various factors that have driven market expansion in recent years. The report also explores market dynamics, regulatory scenarios, and technological advancements that are shaping the industry. It assesses the impact of external factors and global economic changes on market growth. Lastly, it provides strategic recommendations for new entrants and established companies to navigate the complexities of the market.
Future Outlook
- The Energy Ingredient market will continue expanding due to increasing consumer demand for health and wellness products.
- Innovation in natural and plant-based ingredients will drive product development and market differentiation.
- Personalized nutrition will gain importance, leading to more targeted energy ingredient formulations.
- Clean-label and transparency trends will influence ingredient sourcing and marketing strategies.
- Regulatory frameworks will become more stringent, requiring greater compliance and quality assurance.
- Emerging markets will offer significant growth opportunities due to rising disposable incomes and urbanization.
- Technological advancements will improve ingredient bioavailability and delivery systems.
- Collaboration between ingredient suppliers and manufacturers will enhance product innovation and speed to market.
- Sustainable and ethical sourcing practices will become key factors in consumer purchasing decisions.
- Digital health integration will support customized energy solutions and boost consumer engagement.


