Market Overview:
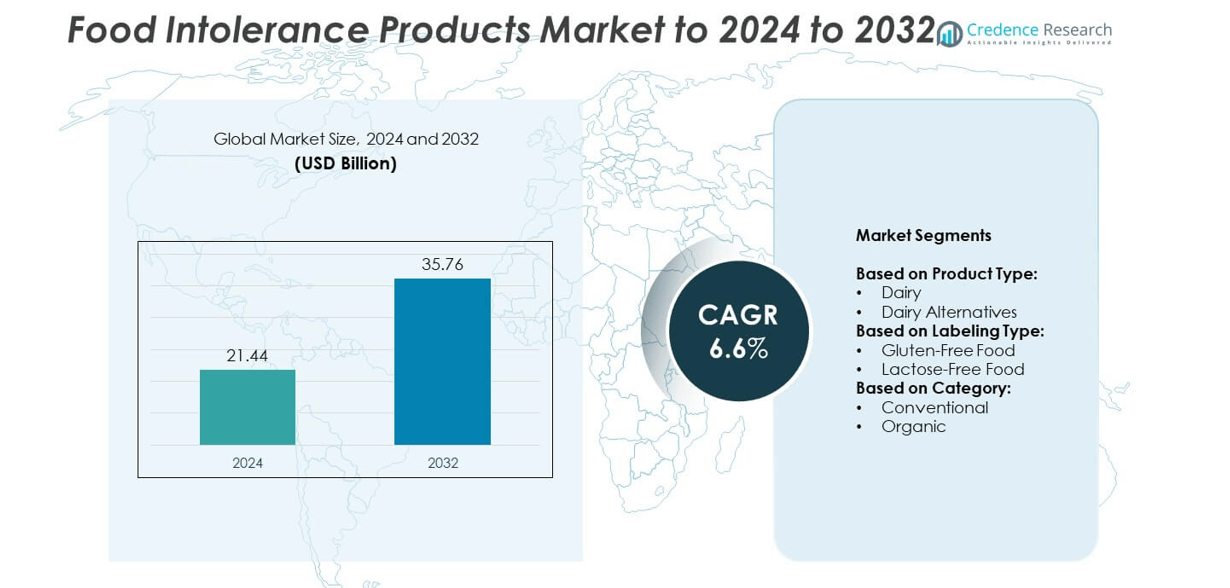
The Food Intolerance Products Market size was valued at USD 21.44 Billion in 2024 and is anticipated to reach USD 35.76 Billion by 2032, at a CAGR of 6.6% during the forecast period.
| REPORT ATTRIBUTE |
DETAILS |
| Historical Period |
2020-2023 |
| Base Year |
2024 |
| Forecast Period |
2025-2032 |
| Food Intolerance Products Market Size 2024 |
USD 21.44 Billion |
| Food Intolerance Products Market, CAGR |
6.6% |
| Food Intolerance Products Market Size 2032 |
USD 35.76 Billion |
The food intolerance products market is highly competitive, with key players including Danone SA, General Mills Inc., Conagra Brands Inc., Chobani LLC, Hain Celestial Group Inc., Amys Kitchen Inc., Doves Farm Foods Ltd, Monde Nissin, Dr. Schar, Ecotone (Mrs. Crimbles Ltd), and Arla Foods Amba. These companies focus on expanding gluten-free, lactose-free, and plant-based product portfolios to meet rising consumer demand. In 2024, North America led the market with 34% share, supported by strong retail presence and advanced labeling regulations, while Europe followed closely with 31%, driven by innovation in organic and clean-label offerings.
Market Insights
- The food intolerance products market was valued at USD 21.44 Billion in 2024 and is expected to reach USD 35.76 Billion by 2032, growing at a CAGR of 6.6%.
- Rising prevalence of lactose intolerance and gluten sensitivity, along with growing health-conscious consumer behavior, is driving strong demand for dairy alternatives and gluten-free foods.
- Key trends include the rapid expansion of organic intolerance products, increasing adoption of plant-based diets, and wider accessibility through e-commerce channels.
- The market is competitive, with global players focusing on product innovation, clean-label claims, and strategic partnerships to strengthen their presence.
- North America held the largest share at 34% in 2024, followed by Europe with 31%, while Asia Pacific accounted for 24% and emerged as the fastest-growing region; dairy alternatives dominated product type with more than 58% share in the same year.
Access crucial information at unmatched prices!
Request your sample report today & start making informed decisions powered by Credence Research Inc.!
Download Sample
Market Segmentation Analysis:
By Product Type
The dairy alternatives segment held the dominant share in the food intolerance products market in 2024, accounting for over 58% of revenue. Rising lactose intolerance cases and the growing adoption of plant-based nutrition drive this leadership. Consumers increasingly prefer soy, almond, oat, and coconut-based alternatives, supported by product innovation and improved taste profiles. Major players are expanding fortified dairy-free offerings to address nutritional gaps, which further boosts adoption. Meanwhile, traditional dairy products retain steady demand due to advancements in lactose-reduced formulations catering to sensitive consumers.
- For instance, Valio launched its lactose-free product line in Finland and has since expanded globally as a market leader in lactose-free dairy products. The company reported receiving a total milk volume of 1,664 million liters in 2023 for its entire portfolio.
By Labeling Type
Gluten-free food dominated the labeling segment with a market share exceeding 62% in 2024. The prevalence of celiac disease and gluten sensitivity, along with rising consumer health awareness, fuels this dominance. Strong retail penetration and continuous expansion of gluten-free bakery, snacks, and packaged meals support wider availability. Manufacturers highlight clean-label, allergen-free claims to attract health-conscious buyers, while regulatory approvals enhance consumer trust. In contrast, lactose-free food continues to grow steadily, driven by digestive health concerns and demand for dairy alternatives across both developed and emerging markets.
- For instance, Schär, a specialist in gluten-free products, delivered over 200 products to more than 100 markets worldwide in 2024.
By Category
The conventional category commanded the largest market share, accounting for nearly 72% in 2024. Its dominance stems from widespread affordability, extensive retail presence, and the availability of mass-market gluten-free and lactose-free products. Consumers in middle-income groups favor conventional variants due to price competitiveness and easy accessibility in supermarkets. However, the organic category is registering faster growth, driven by premium positioning, cleaner ingredient sourcing, and heightened consumer focus on natural health solutions. Rising disposable incomes and expanding organic-certified product portfolios are expected to strengthen its future market presence.
Key Growth Drivers
Rising Prevalence of Food Intolerances
The increasing incidence of lactose intolerance, gluten sensitivity, and celiac disease remains the primary driver of the food intolerance products market. In 2024, over 70% of the global population was estimated to have some degree of lactose malabsorption, fueling demand for dairy alternatives and lactose-free options. Similarly, growing gluten-related disorders have encouraged consumers to adopt gluten-free diets. The surge in awareness of food-related digestive issues has shifted purchasing behavior, leading to higher consumption of specialized food products addressing intolerance concerns.
- For instance, fairlife is constructing an ultra-filtered milk facility in Webster, New York, with a size officially cited as 745,000 square feet during the groundbreaking in April 2024.
Expansion of Plant-Based and Dairy-Free Alternatives
The growing popularity of plant-based diets significantly accelerates the demand for dairy-free alternatives. Soy, almond, oat, and coconut-based products are increasingly mainstream due to their nutritional value and taste improvements. Companies are investing in fortified offerings to address protein and calcium gaps, making them strong substitutes for traditional dairy. The rapid innovation in dairy alternatives aligns with consumer demand for healthier, sustainable, and ethical food choices. This factor contributes directly to segment leadership and positions plant-based solutions as a central growth pillar.
- For instance, In the fourth quarter of 2023, Oatly’s production volume was 136 million liters, a period that followed the company’s sale of two production facilities in the U.S. to co-packer Ya YA Foods in January 2023. The sale was part of a strategic shift toward a hybrid manufacturing model, intended to improve operational and financial efficiency.
Clean-Label and Health-Oriented Purchasing Patterns
Health-conscious consumers prefer food intolerance products that emphasize clean-label attributes, allergen-free claims, and natural ingredient sourcing. The rise in digestive health awareness has reinforced demand for products perceived as safe, transparent, and beneficial for overall wellness. Manufacturers are focusing on shorter ingredient lists, non-GMO certifications, and organic claims to build trust. Regulatory standards also ensure product authenticity, further encouraging adoption. The synergy between health-driven preferences and availability of certified gluten-free and lactose-free foods strengthens this factor as a major driver in the market.
Key Trends & Opportunities
Growth of Organic Food Intolerance Products
Organic intolerance products present a growing opportunity due to heightened consumer interest in natural and chemical-free options. Although conventional products hold the largest share, organic variants are expanding at a faster pace. Rising disposable incomes and premium positioning attract health-conscious buyers seeking clean and sustainable food solutions. Retailers are increasingly stocking organic-certified gluten-free and lactose-free foods, while e-commerce platforms improve accessibility. This trend reflects consumer willingness to pay more for high-quality options, creating long-term growth opportunities for organic-focused manufacturers.
- For instance, Amy’s Kitchen’s 2023 “Recipe for Impact” report states the company actively promotes ~30,000 acres of organic agriculture, producing over 100 million pounds of organic crops annually.
E-commerce Expansion and Digital Marketing
The rapid growth of e-commerce platforms has transformed distribution in the food intolerance products market. Online channels provide convenient access to specialized gluten-free and lactose-free products, especially for consumers in urban and semi-urban regions. Digital marketing campaigns and influencer endorsements increase awareness and trust in product quality. Subscription-based models and direct-to-consumer sales further enhance customer loyalty. With increasing internet penetration and smartphone use, e-commerce is expected to remain a key opportunity, enabling brands to reach a broader base with personalized offerings.
- For instance, Kroger’s digital (e-commerce) sales rose by 16% year over year in Q2 2025, underlining online growth in grocery retail.
Key Challenges
High Production and Product Pricing
Food intolerance products, particularly dairy alternatives and gluten-free foods, often involve high production costs due to specialized raw materials and processing methods. This factor results in premium pricing compared to conventional food products, limiting adoption in price-sensitive regions. Small and mid-scale manufacturers struggle to maintain affordability while ensuring nutritional quality. Consumers in developing economies face restricted access due to higher costs, creating a barrier to market penetration. Balancing affordability with quality remains a major challenge for companies seeking mass adoption.
Risk of Cross-Contamination and Label Authenticity
Ensuring product safety is a persistent challenge, especially in gluten-free and lactose-free manufacturing. Even minimal cross-contamination can cause severe health issues for sensitive consumers, leading to concerns about credibility. Mislabeling or lack of strict adherence to certification standards may undermine trust in brands. Regulatory compliance requires substantial investment in testing and monitoring, creating operational burdens for companies. Failure to guarantee label authenticity and safety standards can damage consumer confidence, slowing adoption and affecting overall growth of the market.
Regional Analysis
North America
North America held the largest share of the food intolerance products market in 2024, accounting for 34%. The region benefits from high consumer awareness, strong prevalence of lactose intolerance, and rising demand for gluten-free and dairy-free options. The U.S. leads due to advanced retail distribution, product innovation, and strong regulatory support for allergen labeling. Canada also shows steady adoption, supported by growing plant-based consumption trends. Increasing health-conscious purchasing patterns and higher disposable incomes continue to drive market expansion in North America, reinforcing its leadership position in the global landscape.
Europe
Europe accounted for 31% of the food intolerance products market in 2024, supported by strong regulatory frameworks and consumer awareness of dietary sensitivities. Countries such as Germany, the U.K., and France drive adoption with advanced gluten-free and lactose-free product ranges. Widespread availability in supermarkets and online platforms further supports growth. The European market also benefits from increasing demand for organic and clean-label products, as consumers prioritize natural and allergen-free foods. Innovation in bakery and dairy alternatives remains strong, positioning Europe as a key region with steady growth opportunities.
Asia Pacific
Asia Pacific captured 24% of the food intolerance products market in 2024, reflecting rapid growth potential. Rising urbanization, higher disposable incomes, and increased diagnosis of lactose intolerance significantly contribute to demand. China, Japan, and India are the primary markets, driven by expanding middle-class populations and shifting dietary preferences toward dairy alternatives. The growing e-commerce presence supports wider product accessibility across the region. Manufacturers are investing in plant-based and gluten-free launches to cater to evolving preferences. Asia Pacific’s young demographic and rising health awareness continue to accelerate its expansion within the global market.
Latin America
Latin America held a 6% share of the food intolerance products market in 2024, driven by increasing awareness of lactose intolerance and celiac disease. Brazil and Mexico lead adoption, supported by rising availability of dairy alternatives and gluten-free packaged foods. Growing urbanization and health-conscious consumer trends boost demand, although affordability remains a barrier in lower-income groups. Retail and e-commerce expansion improve product accessibility across the region. Manufacturers are gradually introducing organic and clean-label offerings, creating opportunities for growth despite economic challenges. Latin America shows steady momentum in food intolerance product adoption.
Middle East and Africa
The Middle East and Africa accounted for 5% of the food intolerance products market in 2024, representing the smallest share globally. Growth is driven by increasing urban populations, rising health awareness, and growing demand for specialty food products among affluent groups. Countries like the UAE and South Africa are key markets due to higher purchasing power and expanding modern retail infrastructure. Limited awareness in rural areas and higher product costs restrict wider adoption. However, increasing imports of gluten-free and lactose-free foods, along with premium positioning, support steady growth in this emerging region.
Market Segmentations:
By Product Type:
By Labeling Type:
- Gluten-Free Food
- Lactose-Free Food
By Category:
By Geography:
- North America
- Europe
- UK
- France
- Germany
- Italy
- Spain
- Russia
- Belgium
- Netherlands
- Austria
- Sweden
- Poland
- Denmark
- Switzerland
- Rest of Europe
- Asia Pacific
- China
- Japan
- South Korea
- India
- Australia
- Thailand
- Indonesia
- Vietnam
- Malaysia
- Philippines
- Taiwan
- Rest of Asia Pacific
- Latin America
- Brazil
- Argentina
- Peru
- Chile
- Colombia
- Rest of Latin America
- Middle East
- UAE
- KSA
- Israel
- Turkey
- Iran
- Rest of Middle East
- Africa
- Egypt
- Nigeria
- Algeria
- Morocco
- Rest of Africa
Competitive Landscape
The food intolerance products market is characterized by the presence of leading players such as Danone SA, Ecotone (Mrs. Crimbles Ltd), Chobani LLC, Monde Nissin, General Mills Inc., Dr. Schar, Arla Foods Amba, Amys Kitchen Inc., Doves Farm Foods Ltd, Conagra Brands Inc., and Hain Celestial Group Inc. Competition is driven by continuous product innovation, expanding portfolios of gluten-free and lactose-free offerings, and growing investments in plant-based and organic product lines. Companies emphasize clean-label positioning, allergen-free claims, and nutritional fortification to meet consumer expectations. Strategic initiatives such as mergers, acquisitions, and partnerships support global market penetration, while e-commerce channels enhance accessibility to broader consumer bases. Regional expansion into emerging markets further strengthens competitive positions, supported by rising health awareness and increased disposable incomes. Intense competition encourages differentiation through sustainable packaging, regulatory compliance, and advanced distribution networks, making the market highly dynamic and innovation-driven during the forecast period.
Shape Your Report to Specific Countries or Regions & Enjoy 30% Off!
Key Player Analysis
- Danone SA
- Ecotone (Mrs. Crimbles Ltd)
- Chobani LLC
- Monde Nissin
- General Mills Inc.
- Schar
- Arla Foods Amba
- Amys Kitchen Inc.
- Doves Farm Foods Ltd
- Conagra Brands Inc.
- Hain Celestial Group Inc.
Recent Developments
- In 2025, Conagra Brands Inc. Continued to market its established gluten-free brands, such as Udi’s and Glutino, as part of a broad portfolio addressing diverse consumer dietary needs.
- In 2024, Hain Celestial Group Inc.: Introduced new gluten-free tortilla chips under its Garden Veggie brand, with a focus on healthy and nutritious snacking.
- In 2023, Dr. Schär Launched an innovative, high-fiber gluten-free flatbread in the UK to fill a gap in the market for versatile bread alternatives.
Report Coverage
The research report offers an in-depth analysis based on Product Type, Labeling Type, Category and Geography. It details leading market players, providing an overview of their business, product offerings, investments, revenue streams, and key applications. Additionally, the report includes insights into the competitive environment, SWOT analysis, current market trends, as well as the primary drivers and constraints. Furthermore, it discusses various factors that have driven market expansion in recent years. The report also explores market dynamics, regulatory scenarios, and technological advancements that are shaping the industry. It assesses the impact of external factors and global economic changes on market growth. Lastly, it provides strategic recommendations for new entrants and established companies to navigate the complexities of the market.
Future Outlook
- Rising prevalence of lactose and gluten intolerance will continue to drive strong product demand.
- Dairy alternatives will strengthen leadership as plant-based diets gain wider acceptance globally.
- Organic food intolerance products will grow faster due to consumer focus on clean ingredients.
- E-commerce platforms will expand accessibility of gluten-free and lactose-free foods across regions.
- Innovation in fortified dairy-free and gluten-free offerings will address nutritional gaps effectively.
- North America and Europe will maintain dominance, supported by advanced retail and regulatory frameworks.
- Asia Pacific will emerge as the fastest-growing region due to urbanization and rising health awareness.
- Manufacturers will invest in sustainable packaging and transparent labeling to build consumer trust.
- Price reduction strategies will improve adoption in cost-sensitive markets across Latin America and Africa.
- Strategic partnerships and product diversification will shape the competitive landscape of the market.


