Virtual Fitting Room Market By Component (Hardware, Software: On-premise, Cloud, Services: Installation, Support & Maintenance, Consulting); By Application (Apparel, Beauty and Cosmetics, Eyewear, Footwear, Others); By End-Use (Physical Stores, Virtual Stores) – Growth, Share, Opportunities & Competitive Analysis, 2024 – 2032

Report ID: 11350 | Report Format : Excel, PDF

Market Overview:

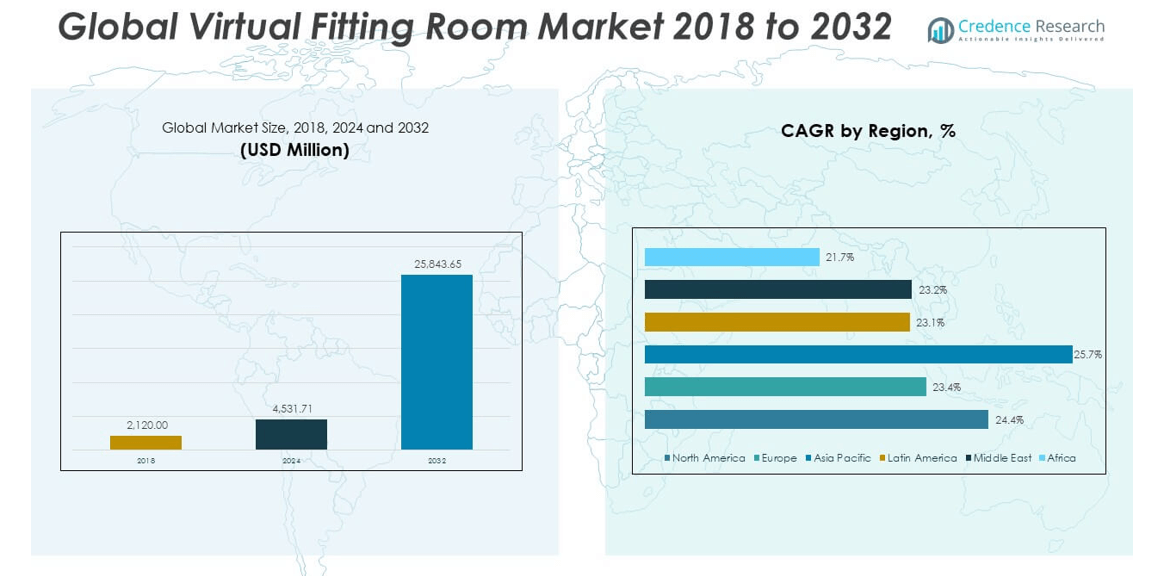
The Virtual Fitting Room Market size was valued at USD 2,120.00 million in 2018 to USD 4,531.71 million in 2024 and is anticipated to reach USD 25,843.65 million by 2032, at a CAGR of 24.37% during the forecast period.

REPORT ATTRIBUTE DETAILS
Historical Period 2020-2023
Base Year 2024
Forecast Period 2025-2032
Virtual Fitting Room Market Size 2024 USD 4,531.71 million
Virtual Fitting Room Market, CAGR 24.37%
Virtual Fitting Room Market Size 2032 USD 25,843.65 million


The growth of the virtual fitting room market is driven by increasing consumer preference for online shopping and the growing demand for personalized retail experiences. Retailers are adopting virtual try-on solutions to reduce return rates, enhance customer satisfaction, and improve operational efficiency. Advancements in augmented reality (AR), artificial intelligence (AI), and 3D visualization technologies have significantly improved the accuracy and realism of virtual fitting tools, making them more attractive for both fashion brands and consumers seeking interactive, convenient, and engaging shopping journeys.

North America leads the virtual fitting room market, fueled by a high concentration of tech-savvy consumers, major e-commerce players, and early adoption of immersive technologies. Europe follows closely due to strong fashion retail presence and investments in digital transformation. The Asia Pacific region is emerging rapidly, driven by expanding internet access, growing smartphone penetration, and the surge in online apparel shopping in countries such as China, Japan, and India. Retailers in these markets are increasingly leveraging virtual fitting technologies to capture younger demographics and stay competitive in a fast-evolving digital retail landscape.

Virtual Fitting Room Market size

Market Insights:

  • The Virtual Fitting Room Market was valued at USD 2,120.00 million in 2018, reached USD 4,531.71 million in 2024, and is projected to hit USD 25,843.65 million by 2032, growing at a CAGR of 24.37%.
  • Rising demand for personalized online shopping experiences is driving rapid adoption of virtual try-on technologies across fashion and lifestyle sectors.
  • Increasing integration of augmented reality (AR) and artificial intelligence (AI) enhances fit accuracy and boosts user engagement, fueling market growth.
  • High initial setup costs and technical integration challenges act as major barriers for small to mid-sized retailers.
  • Concerns over data privacy and simulation accuracy continue to affect consumer trust and market penetration.
  • North America leads the market due to strong e-commerce infrastructure and early technology adoption, while Asia Pacific is witnessing the fastest growth.
  • Europe follows closely with demand from fashion-forward consumers and a high concentration of premium retail brands investing in digital innovation.

Access crucial information at unmatched prices!

Request your sample report today & start making informed decisions powered by Credence Research Inc.!

Download Sample

Market Drivers:

Widespread Shift Toward E-Commerce and Growing Online Apparel Sales

The ongoing expansion of e-commerce has redefined the retail experience, prompting retailers to integrate advanced digital tools. Consumers increasingly prefer shopping online for convenience and access to a broader product range. The Virtual Fitting Room Market gains traction by offering solutions that mimic in-store try-on experiences. It enables customers to visualize apparel fit and style in real-time, which reduces hesitation and enhances purchase confidence. Retailers adopting these tools observe reduced return rates and improved conversion rates. Fashion brands are under pressure to provide engaging and seamless virtual experiences. The shift in consumer behavior directly supports the growth of virtual fitting room technology. This adoption trend strengthens digital transformation across fashion retail.

Increasing Demand for Personalization in Consumer Shopping Experiences

Consumers seek highly personalized experiences that reflect their style, size, and preferences. The Virtual Fitting Room Market responds to this demand by offering customizable virtual try-on features. It uses user-specific data and AI to deliver tailored suggestions and sizing accuracy. Personalization drives user engagement and increases customer loyalty across fashion and lifestyle segments. Retailers benefit from higher retention rates and deeper insights into consumer behavior. Shoppers trust brands more when offered accurate, interactive tools that reflect individual fit. This aligns with the broader trend toward consumer-centric strategies. It empowers brands to differentiate themselves in a competitive digital landscape.

  • For example, Zozotown, powered by ZOZO’sproprietary ZOZOSUIT technology, scans users’ body dimensions with over 1,500 measurement points and tailors apparel suggestions with 98% sizing accuracy.

Technological Advancements in Augmented Reality and Artificial Intelligence

Innovations in AR and AI have significantly advanced the capabilities of virtual fitting technologies. AR provides a realistic simulation of clothing fit, while AI enhances predictive accuracy and data interpretation. The Virtual Fitting Room Market benefits from seamless integration of these technologies into mobile apps and retail platforms. It delivers precise sizing recommendations, improves rendering speed, and increases responsiveness. Brands invest in these technologies to remain competitive and meet rising consumer expectations. AI also enables real-time body scanning and fit prediction based on past purchase data. Such intelligent systems enhance user trust in virtual try-ons. It strengthens the role of technology in fashion e-commerce innovation.

  • For example, Snap Inc. has publicly quantified the impact of its AR-powered virtual try-on technology for fashion: in 2024, over 250 million usersengaged with AR try-on lenses, and partner brands such as Gucci and Prada experienced a 4x higher conversion rate compared to traditional mobile commerce.

Retailers’ Focus on Reducing Return Rates and Operational Costs

Return management remains a costly challenge for online apparel retailers. High return volumes impact profit margins and strain logistics networks. The Virtual Fitting Room Market addresses this issue by minimizing size-related mismatches. It supports better pre-purchase decisions by letting consumers assess garment fit and appearance. Retailers see cost savings through lower return rates and reduced need for customer service interventions. It also improves inventory planning and supply chain accuracy. Businesses recognize the cost-efficiency benefits of deploying virtual try-on features. This driver accelerates investment in digital fitting tools among online and omnichannel retailers.

Market Trends:

Integration of Virtual Fitting Rooms with Mobile Shopping Applications

Mobile commerce continues to grow rapidly, driving retailers to integrate advanced features directly into smartphone apps. The Virtual Fitting Room Market reflects this trend by embedding try-on tools into mobile interfaces. It enables consumers to interact with garments instantly through their camera or uploaded images. Retail apps increasingly feature AR-based overlays to simulate fitting in real-time. This trend supports consumer demand for fast, on-the-go decision-making. It also aligns with increased mobile device usage during online shopping sessions. Retailers benefit from higher mobile conversion rates and deeper user engagement. It positions mobile platforms as central to the future of virtual try-on experiences.

  • For example, Walmart acquired Fit Analytics and fully integrated its Fit Finder solution into its platform. According to case studies, the tool now serves millions of recommendations globally, significantly enhancing retail performance. In A/B trials across diverse brands, Fit Finder drove up to 9% increase in conversion rates and reduced returns by 2–13% in specific implementation.

Adoption of Virtual Fitting Rooms in Luxury and High-End Fashion Retail

Luxury fashion retailers seek to preserve exclusivity while embracing digital transformation. The Virtual Fitting Room Market is expanding into premium segments where brand experience matters. High-end brands use virtual try-ons to deliver immersive and personalized shopping. It ensures that the exclusivity of designer collections is retained in digital spaces. Luxury retailers also leverage it to offer white-glove service online. This trend enhances consumer trust in buying expensive garments without physical trials. It reflects the industry’s efforts to digitize while maintaining elite brand perception. It also opens new customer acquisition channels for luxury brands.

Development of Virtual Avatars and Body Scanning for Realistic Fit Simulation

Creating realistic virtual avatars has become a major focus in enhancing the try-on experience. The Virtual Fitting Room Market sees growth in AI-based body scanning and digital twin technology. It allows users to create accurate, 3D representations of their body using cameras or measurements. These avatars serve as dynamic models for assessing fit and garment drape. Retailers and tech providers collaborate to improve realism and interactivity. Consumers prefer accurate visualizations that reflect how clothes behave in real-world movement. It pushes the boundaries of what virtual try-on tools can offer. This trend is redefining fit accuracy in the online apparel industry.

Incorporation of Social Media and Influencer Try-On Features in E-Retail

Social platforms increasingly shape consumer buying behavior, especially in fashion. The Virtual Fitting Room Market aligns with this trend through tools that let users share virtual try-on images. Retailers integrate try-on features with Instagram, Snapchat, and TikTok for direct engagement. It empowers users to seek peer feedback before purchase decisions. Influencers also adopt virtual try-on tools to showcase branded collections to followers. It creates a bridge between social content and e-commerce transactions. The social commerce model gains momentum with immersive and shareable features. It reflects how virtual try-ons enhance both engagement and product visibility online.

  • For example, American Eagle partnered with Snapchat to launch AR try-ons for jeans and apparel, driving significant engagement and sales. The company highlights increased interaction and intent among shoppers.

Market Challenges Analysis:

Technical Complexity and High Implementation Costs for Retailers

Deploying advanced virtual fitting solutions requires high initial investment and continuous technological upgrades. Many small and mid-size retailers lack the budget or expertise to implement robust systems. The Virtual Fitting Room Market faces barriers in adoption due to integration challenges with legacy e-commerce platforms. It demands strong back-end infrastructure, high-quality imaging, and AI capabilities. Retailers often need third-party partnerships or custom development to support these features. Technical complexity increases with multi-platform compatibility and real-time rendering needs. It also requires strong cybersecurity and data protection protocols. These issues delay deployment and limit accessibility for lower-tier fashion sellers.

Consumer Data Privacy and Accuracy Concerns in Virtual Try-On Systems

Virtual fitting tools often rely on body measurements, photos, and behavioral data for accurate simulation. Consumers remain cautious about sharing personal data due to privacy risks. The Virtual Fitting Room Market must address growing regulatory concerns and ensure compliance with global data protection laws. It faces challenges in balancing personalization with privacy. Inaccurate simulations due to poor lighting, camera quality, or algorithm errors can also damage brand trust. Users may abandon platforms if the experience feels inconsistent or intrusive. These concerns create friction in user adoption. Maintaining transparency and data integrity becomes a crucial challenge for market players.

Market Opportunities:

Expansion into Emerging Fashion Markets with Mobile-First Consumers

Emerging economies with growing smartphone usage and expanding e-commerce penetration offer strong growth potential. The Virtual Fitting Room Market can tap into these regions by offering lightweight, mobile-compatible solutions. It supports digital retail growth in Southeast Asia, Latin America, and the Middle East. Retailers in these markets can enhance consumer engagement with AR-based try-ons. It enables them to compete with global brands while offering localized experiences. High mobile usage and youthful demographics favor tech-driven shopping interfaces. This opportunity allows virtual try-on providers to scale affordably and build new consumer bases.

Strategic Partnerships with Apparel Brands and Technology Innovators

Collaborations between fashion retailers and tech companies create fertile ground for product innovation. The Virtual Fitting Room Market can benefit from partnerships that merge style expertise with advanced visualization tools. It allows faster market entry and better adaptation to brand identity. Joint ventures drive feature development tailored to specific product lines or consumer needs. Retailers also gain access to AI, AR, and cloud infrastructure without building from scratch. It promotes seamless integration into digital storefronts. These collaborations strengthen the competitive position of both partners in the evolving fashion-tech landscape.

Market Segmentation Analysis:

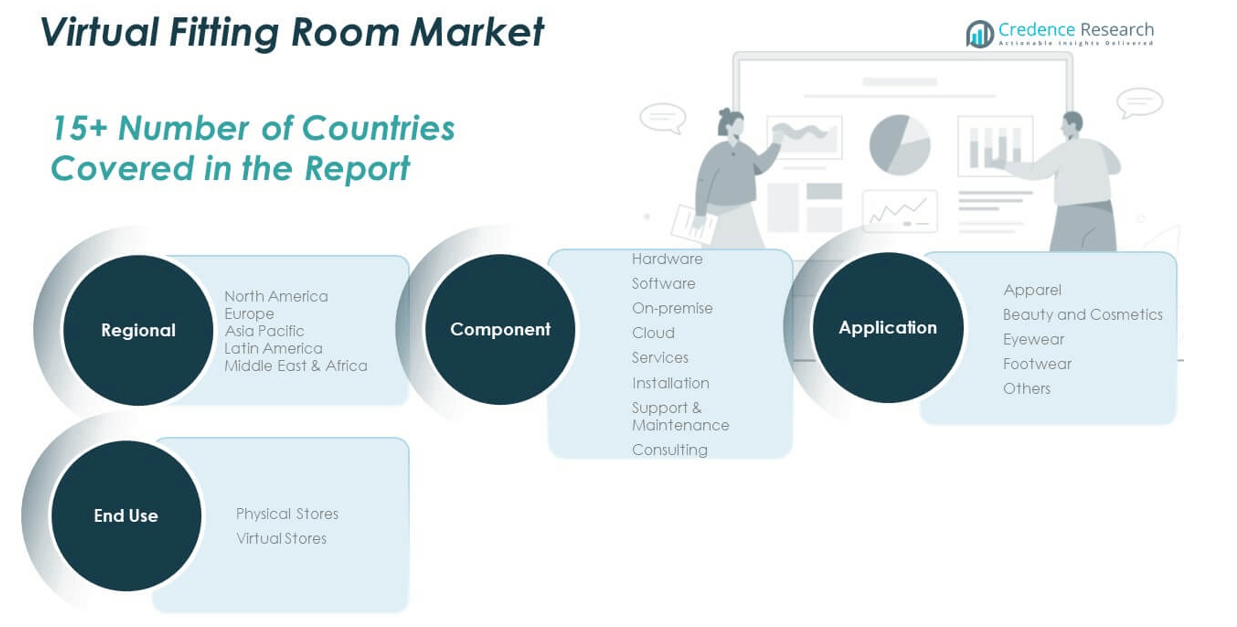
The Virtual Fitting Room Market is segmented by component, application, and end use, reflecting its diverse integration across the retail ecosystem.

By component, software holds the dominant share due to the growing demand for immersive, AR-enabled solutions. Cloud-based deployment is expanding rapidly, offering scalability and seamless access across devices, while on-premise solutions cater to retailers requiring tighter control over data and infrastructure. Hardware supports device compatibility, sensors, and 3D cameras that enhance try-on realism. Services including installation, support & maintenance, and consulting play a vital role in system implementation and optimization.

  • For example, Balmain’s partnership with Bods brings highly realistic digital avatars to shoppers for virtual try-on of signature fashion pieces, with detailed 3D rendering of fabrics and embellishments.

By application, apparel leads due to the high return rates in online clothing purchases and the consumer need for accurate sizing. Beauty and cosmetics follow, driven by virtual makeup try-on features, while eyewear and footwear segments adopt fitting rooms for personalized style matching and fit simulation. The “others” category includes accessories and sportswear where customization and appearance also matter.

  • For example, Charlotte Tilbury:Installs AR mirrors in stores for virtual makeup try-on; shoppers interact with 10 curated looks and receive product lists, which led to increased in-store cosmetic purchases.

By end use, virtual stores dominate adoption due to the rapid rise of e-commerce and mobile shopping. It allows digital-first retailers to differentiate their platforms with interactive tools. Physical stores increasingly integrate virtual fitting rooms to bridge the gap between in-store and online experiences. It enhances customer engagement, supports contactless retail, and drives footfall through tech-enabled convenience. The segmentation highlights how the market adapts to various retail environments and consumer behavior patterns.

Virtual Fitting Room Market segmentation

Segmentation:

By Component:

  • Hardware
  • Software
    • On-premise
    • Cloud
  • Services
    • Installation
    • Support & Maintenance
    • Consulting

By Application:

  • Apparel
  • Beauty and Cosmetics
  • Eyewear
  • Footwear
  • Others

By End Use:

  • Physical Stores
  • Virtual Stores

By Region:

  • North America
    • U.S.
    • Canada
    • Mexico
  • Europe
    • Germany
    • France
    • U.K.
    • Italy
    • Spain
    • Rest of Europe
  • Asia Pacific
    • China
    • Japan
    • India
    • South Korea
    • South-east Asia
    • Rest of Asia Pacific
  • Latin America
    • Brazil
    • Argentina
    • Rest of Latin America
  • Middle East & Africa
    • GCC Countries
    • South Africa
    • Rest of the Middle East and Africa

Regional Analysis:

North America

The North America Virtual Fitting Room Market size was valued at USD 731.40 million in 2018 to USD 1,543.47 million in 2024 and is anticipated to reach USD 8,789.47 million by 2032, at a CAGR of 24.4% during the forecast period. North America accounts for 34.02% of the global market share in 2024. The region leads due to its advanced retail infrastructure and early adoption of emerging technologies. High internet penetration and a tech-savvy consumer base support the expansion of AR-based virtual try-on solutions. Major e-commerce platforms and fashion retailers are actively integrating fitting room technologies to enhance user experiences. The U.S. remains the primary contributor, followed by Canada, with both markets emphasizing personalization and customer engagement. Investment in AI and AR startups also fuels innovation in this domain.

Europe

The Europe Virtual Fitting Room Market size was valued at USD 502.02 million in 2018 to USD 1,026.76 million in 2024 and is anticipated to reach USD 5,493.14 million by 2032, at a CAGR of 23.4% during the forecast period. Europe holds 22.66% of the global market share in 2024. The region is driven by fashion-forward consumers and a high concentration of established apparel brands. Countries like the UK, Germany, France, and Italy are embracing virtual try-on tools to reduce return rates and boost online conversions. Retailers are integrating AR features to differentiate their digital offerings and personalize customer journeys. It thrives in Europe due to regulatory support for data security and a consumer focus on innovation. Sustainable shopping trends further support virtual try-on adoption by minimizing environmental impact from product returns.

Asia Pacific

The Asia Pacific Virtual Fitting Room Market size was valued at USD 609.08 million in 2018 to USD 1,351.11 million in 2024 and is anticipated to reach USD 8,388.87 million by 2032, at a CAGR of 25.7% during the forecast period. Asia Pacific represents 29.81% of the global market share in 2024. Rapid e-commerce expansion, mobile-first consumer behavior, and a growing middle class fuel the adoption of virtual fitting rooms. Countries such as China, Japan, South Korea, and India are key contributors to regional growth. Local and international retailers leverage virtual try-on features to attract young, digital-native shoppers. It benefits from technological advancements and increasing investments in AR/VR by regional tech giants.

Latin America

The Latin America Virtual Fitting Room Market size was valued at USD 124.87 million in 2018 to USD 264.15 million in 2024 and is anticipated to reach USD 1,389.61 million by 2032, at a CAGR of 23.1% during the forecast period. Latin America accounts for 5.83% of the global market share in 2024. The region shows growing interest in digital fashion retail, supported by rising internet access and smartphone adoption. Countries like Brazil, Mexico, and Colombia are witnessing increased e-commerce activity, pushing retailers to innovate. Virtual fitting tools are gaining popularity among younger shoppers seeking convenience and interactivity. It is gaining momentum in urban markets where digital infrastructure is rapidly evolving.

Middle East

The Middle East Virtual Fitting Room Market size was valued at USD 103.24 million in 2018 to USD 209.79 million in 2024 and is anticipated to reach USD 1,106.25 million by 2032, at a CAGR of 23.2% during the forecast period. The region holds 4.63% of the global market share in 2024. The Middle East market benefits from rising digital transformation in retail and strong luxury fashion demand. Countries like the UAE and Saudi Arabia are at the forefront of adopting virtual shopping tools. It is growing steadily with investments in smart retail and consumer engagement platforms. High disposable income and fashion-conscious consumers drive the need for immersive online shopping. Fashion retailers integrate AR-powered try-on features to align with premium customer expectations. Government support for innovation and digitization bolsters infrastructure for virtual solutions.

Africa

The Africa Virtual Fitting Room Market size was valued at USD 49.40 million in 2018 to USD 136.42 million in 2024 and is anticipated to reach USD 676.31 million by 2032, at a CAGR of 21.7% during the forecast period. Africa holds 3.01% of the global market share in 2024. The market remains nascent but exhibits notable potential in digitally connected urban centers. South Africa, Nigeria, and Kenya are key countries seeing the early adoption of virtual retail tools. Increasing internet access and mobile commerce help drive interest in digital shopping experiences. It sees growing experimentation among local e-retailers targeting tech-savvy younger consumers. Challenges in infrastructure and affordability still limit broad deployment. However, low-cost mobile solutions and cloud-based platforms enable gradual market penetration.

Shape Your Report to Specific Countries or Regions & Enjoy 30% Off!

Key Player Analysis:

  • AstraFit
  • ELSE Corp Srl
  • FXGear Inc.
  • Metail
  • Fit Analytics
  • Zugara Inc.
  • SIZEBAY
  • Magic Mirror
  • Memomi Labs Inc.
  • SenseMi
  • triMirror
  • Virtusize
  • Visualook
  • Reactive Reality GmbH

Competitive Analysis:

The Virtual Fitting Room Market features a moderately consolidated landscape, dominated by a mix of established technology providers and innovative startups. Leading players focus on integrating augmented reality (AR), artificial intelligence (AI), and machine learning to enhance user experience and fit accuracy. It attracts investments from both retail and tech sectors aiming to capture the growing demand for immersive online shopping solutions. Companies such as Zeekit (acquired by Walmart), Vue.ai, and Fits.Me continue to drive innovation. Competitive strategies include strategic partnerships, AI model enhancements, and expanding mobile compatibility. Startups are targeting niche apparel segments, while larger firms pursue omnichannel deployment. The race to reduce return rates and personalize shopping is shaping the intensity of competition. Firms prioritize product scalability, 3D rendering quality, and ease of integration. Market players compete on technological differentiation, cost efficiency, and brand collaborations.

Recent Developments

  • In May 2025, SIZEBAY launched “Fashion Hub,” an AI-powered platform for size recommendations and style suggestions. The announcement is confirmed by credible financial and industry sites
  • In January 2024, NuraLogix unveiled Anura MagicMirror at CES, which analyzes facial blood flow for health monitoring and smart retail uses. The authenticity is supported by press releases and CES award listings.
  • In March 2022, Walmart launched its upgraded “Choose My Model” virtual fitting room feature powered by Zeekit, enabling users to view apparel on models with body types, skin tones, and hair colors similar to their own.

Market Concentration & Characteristics

The Virtual Fitting Room Market exhibits moderate-to-high concentration, with key players shaping innovation and influencing adoption rates. It is characterized by rapid technological evolution, strong integration with fashion retail, and emphasis on AI-AR fusion. Companies prioritize scalability and user experience, often competing on solution accuracy and customization. The market favors those offering seamless integration with existing e-commerce infrastructure. It supports agile deployment across both desktop and mobile platforms. Consumer demand for personalization continues to shape feature development. The competitive field includes both multinational tech firms and regional innovators addressing specific apparel categories.

Report Coverage:

The research report offers an in-depth analysis based on component, application, and end use. It details leading market players, providing an overview of their business, product offerings, investments, revenue streams, and key applications. Additionally, the report includes insights into the competitive environment, SWOT analysis, current market trends, as well as the primary drivers and constraints. Furthermore, it discusses various factors that have driven market expansion in recent years. The report also explores market dynamics, regulatory scenarios, and technological advancements that are shaping the industry. It assesses the impact of external factors and global economic changes on market growth. Lastly, it provides strategic recommendations for new entrants and established companies to navigate the complexities of the market.

Future Outlook:

  • Retailers will expand virtual fitting features across mobile apps to meet growing demand for on-the-go shopping experiences.
  • AI-powered personalization will enhance sizing accuracy and style recommendations for individual consumers.
  • Integration of 3D avatars and real-time simulation will improve realism and drive user engagement.
  • Partnerships between fashion retailers and tech firms will accelerate solution deployment and innovation.
  • Virtual fitting rooms will support sustainability goals by reducing product returns and carbon footprints.
  • Luxury and premium brands will increasingly use virtual try-ons to deliver high-end digital experiences.
  • Social media platforms will play a larger role in shaping purchase decisions via virtual try-on integrations.
  • Emerging markets will drive new growth, supported by mobile commerce and expanding internet access.
  • E-commerce platforms will differentiate their offerings through immersive AR-based try-on tools.
  • Cloud-based deployment will enable scalable, low-latency solutions for global retailers.

CHAPTER NO. 1 :   GENESIS OF THE MARKET       

1.1 Market Prelude – Introduction & Scope

1.2 The Big Picture – Objectives & Vision

1.3 Strategic Edge – Unique Value Proposition

1.4 Stakeholder Compass – Key Beneficiaries

CHAPTER NO. 2 :   EXECUTIVE LENS

2.1 Pulse of the End Use – Market Snapshot

2.2 Growth Arc – Revenue Projections (USD Million)

2.3. Premium Insights – Based on Primary Interviews

CHAPTER NO. 3 :   VIRTUAL FITTING ROOM MARKET FORCES & INDUSTRY PULSE 

3.1 Foundations of Change – Market Overview
3.2 Catalysts of Expansion – Key Market Drivers
3.2.1 Momentum Boosters – Growth Triggers
3.2.2 Innovation Fuel – Disruptive Technologies
3.3 Headwinds & Crosswinds – Market Restraints
3.3.1 Regulatory Tides – Compliance Challenges
3.3.2 Economic Frictions – Inflationary Pressures
3.4 Untapped Horizons – Growth Potential & Opportunities
3.5 Strategic Navigation – End Use Frameworks
3.5.1 Market Equilibrium – Porter’s Five Forces
3.5.2 Ecosystem Dynamics – Value Chain Analysis
3.5.3 Macro Forces – PESTEL Breakdown

3.6 Price Trend Analysis

3.6.1 Regional Price Trend
3.6.2 Price Trend by product

CHAPTER NO. 4 :   KEY INVESTMENT EPICENTER           

4.1 Regional Goldmines – High-Growth Geographies

4.2 Product Frontiers – Lucrative Product Categories

4.3 Application Sweet Spots – Emerging Demand Segments

CHAPTER NO. 5: REVENUE TRAJECTORY & WEALTH MAPPING

5.1 Momentum Metrics – Forecast & Growth Curves

5.2 Regional Revenue Footprint – Market Share Insights

5.3 Segmental Wealth Flow – Component & Application Revenue

CHAPTER NO. 6 :   TRADE & COMMERCE ANALYSIS      

6.1.      Import Analysis by Region

6.1.1.   Global Virtual Fitting Room Market Import Revenue By Region

6.2.      Export Analysis by Region

6.2.1.   Global Virtual Fitting Room Market Export Revenue By Region

CHAPTER NO. 7 :   COMPETITION ANALYSIS         

7.1.      Company Market Share Analysis

7.1.1.   Global Virtual Fitting Room Market: Company Market Share

7.2.      Global Virtual Fitting Room Market Company Revenue Market Share

7.3.      Strategic Developments

7.3.1.   Acquisitions & Mergers

7.3.2.   New Product Launch

7.3.3.   Regional Expansion

7.4.      Competitive Dashboard

7.5.    Company Assessment Metrics, 2024

CHAPTER NO. 8 :   VIRTUAL FITTING ROOM MARKET – BY COMPONENT SEGMENT ANALYSIS   

8.1.      Virtual Fitting Room Market Overview by Component Segment

8.1.1.   Virtual Fitting Room Market Revenue Share By Component

8.2.      Hardware

8.3.      Software

8.3.1    On-premise

8.3.2    Cloud

8.4.      Services

8.4.1    Installation

8.4.2    Support & Maintenance

8.4.3    Consulting

CHAPTER NO. 9 :   VIRTUAL FITTING ROOM MARKET – BY APPLICATION SEGMENT ANALYSIS 

9.1.      Virtual Fitting Room Market Overview by Application Segment

9.1.1.   Virtual Fitting Room Market Revenue Share By Application

9.2.      Apparel

9.3.      Beauty and Cosmetics

9.4.      Eyewear

9.5.      Footwear

9.6.      Others

CHAPTER NO. 10 : VIRTUAL FITTING ROOM MARKET – BY END USE SEGMENT ANALYSIS

10.1.    Virtual Fitting Room Market Overview by End Use Segment

10.1.1. Virtual Fitting Room Market Revenue Share By End Use

10.2.    Physical Stores

10.3.    Virtual Stores

CHAPTER NO. 11 : VIRTUAL FITTING ROOM MARKET – REGIONAL ANALYSIS   

11.1.    Virtual Fitting Room Market Overview by Region Segment

11.1.1. Global Virtual Fitting Room Market Revenue Share By Region

11.1.3. Regions

11.1.4. Global Virtual Fitting Room Market Revenue By Region

.1.6.     Component

11.1.7. Global Virtual Fitting Room Market Revenue By Component

11.1.9. Application

11.1.10.           Global Virtual Fitting Room Market Revenue By Application

11.1.12.           End Use

11.1.13.           Global Virtual Fitting Room Market Revenue By End Use

CHAPTER NO. 12 : NORTH AMERICA VIRTUAL FITTING ROOM MARKET – COUNTRY ANALYSIS        

12.1.    North America Virtual Fitting Room Market Overview by Country Segment

12.1.1. North America Virtual Fitting Room Market Revenue Share By Region

12.2.    North America

12.2.1.North America Virtual Fitting Room Market Revenue By Country

12.2.2. Component

12.2.3. North America Virtual Fitting Room Market Revenue By Component

12.2.4. Application

12.2.5. North America Virtual Fitting Room Market Revenue By Application

2.2.6.   End Use

12.2.7.North America Virtual Fitting Room Market Revenue By End Use

2.3.      U.S.

12.4.    Canada

12.5.    Mexico

CHAPTER NO. 13 : EUROPE VIRTUAL FITTING ROOM MARKET – COUNTRY ANALYSIS      

13.1.    Europe Virtual Fitting Room Market Overview by Country Segment

13.1.1. Europe Virtual Fitting Room Market Revenue Share By Region

13.2.    Europe

13.2.1.Europe Virtual Fitting Room Market Revenue By Country

13.2.2. Component

13.2.3. Europe Virtual Fitting Room Market Revenue By Component

13.2.4. Application

13.2.5. Europe Virtual Fitting Room Market Revenue By Application

13.2.6. End Use

13.2.7. Europe Virtual Fitting Room Market Revenue By End Use

13.3.    UK

13.4.    France

13.5.    Germany

13.6.    Italy

13.7.    Spain

13.8.    Russia

13.9.   Rest of Europe

CHAPTER NO. 14 : ASIA PACIFIC VIRTUAL FITTING ROOM MARKET – COUNTRY ANALYSIS      

14.1.    Asia Pacific Virtual Fitting Room Market Overview by Country Segment

14.1.1. Asia Pacific Virtual Fitting Room Market Revenue Share By Region

14.2.    Asia Pacific

14.2.1. Asia Pacific Virtual Fitting Room Market Revenue By Country

14.2.2. Component

14.2.3. Asia Pacific Virtual Fitting Room Market Revenue By Component

14.2.4. Application

14.2.5. Asia Pacific Virtual Fitting Room Market Revenue By Application

14.2.5. End Use

14.2.7. Asia Pacific Virtual Fitting Room Market Revenue By End Use

14.3.    China

14.4.    Japan

14.5.    South Korea

14.6.    India

14.7.    Australia

14.8.    Southeast Asia

14.9.    Rest of Asia Pacific

CHAPTER NO. 15 : LATIN AMERICA VIRTUAL FITTING ROOM MARKET – COUNTRY ANALYSIS

15.1.    Latin America Virtual Fitting Room Market Overview by Country Segment

15.1.1. Latin America Virtual Fitting Room Market Revenue Share By Region

15.2.    Latin America

15.2.1. Latin America Virtual Fitting Room Market Revenue By Country

15.2.2. Component

15.2.3. Latin America Virtual Fitting Room Market Revenue By Component

15.2.4. Application

15.2.5. Latin America Virtual Fitting Room Market Revenue By Application

15.2.6. End Use

15.2.7.Latin America Virtual Fitting Room Market Revenue By End Use

15.3.    Brazil

15.4.    Argentina

15.5.    Rest of Latin America

CHAPTER NO. 16 : MIDDLE EAST VIRTUAL FITTING ROOM MARKET – COUNTRY ANALYSIS

16.1.    Middle East Virtual Fitting Room Market Overview by Country Segment

16.1.1. Middle East Virtual Fitting Room Market Revenue Share By Region

16.2.    Middle East

16.2.1. Middle East Virtual Fitting Room Market Revenue By Country

16.2.2. Component

16.2.3. Middle East Virtual Fitting Room Market Revenue By Component

16.2.4. Application

16.2.5. Middle East Virtual Fitting Room Market Revenue By Application

16.2.6. End Use

16.2.7. Middle East Virtual Fitting Room Market Revenue By End Use

16.3.    GCC Countries

16.4.    Israel

16.5.    Turkey

16.6.    Rest of Middle East

CHAPTER NO. 17 : AFRICA VIRTUAL FITTING ROOM MARKET – COUNTRY ANALYSIS      

17.1.    Africa Virtual Fitting Room Market Overview by Country Segment

17.1.1. Africa Virtual Fitting Room Market Revenue Share By Region

17.2.    Africa

17.2.1. Africa Virtual Fitting Room Market Revenue By Country

17.2.2. Component

17.2.3. Africa Virtual Fitting Room Market Revenue By Component

17.2.4. Application

17.2.5. Africa Virtual Fitting Room Market Revenue By Application

17.2.6. End Use

17.2.7. Africa Virtual Fitting Room Market Revenue By End Use

17.3.    South Africa

17.4.    Egypt

17.5.    Rest of Africa

CHAPTER NO. 18 : COMPANY PROFILES     

18.1.    AstraFit

18.1.1. Company Overview

18.1.2. Product Portfolio

18.1.3. Financial Overview

18.1.4.Recent Developments

18.1.5. Growth Strategy

18.1.6. SWOT Analysis

18.2.    ELSE Corp Srl

18.3.    FXGear Inc.

18.4.    Metail

18.5.    Fit Analytics

18.6.    Zugara Inc.

18.7.    SIZEBAY

18.8.    Magic Mirror

18.9.    Memomi Labs Inc

18.10.  SenseMi

18.11   triMirror

18.12.  Virtusize

18.13.  Visualook

18.14.  Reactive Reality GmbH


Request Free Sample

Ready to Transform Data into Decisions?

Request Your Sample Report and Start Your Journey of Informed Choices


Providing the strategic compass for industry titans.

cr-clients-logos

Frequently Asked Questions :

What is the current size of the Virtual Fitting Room Market?

The market is valued at USD 4,531.71 million in 2024 and is projected to grow significantly by 2032.

What factors are driving the growth of the Virtual Fitting Room Market?

Key growth drivers include the surge in e-commerce adoption, changing consumer shopping preferences, and the expansion of online retail channels. Consumers demand immersive, interactive, and convenient shopping experiences, which virtual fitting rooms address through augmented reality (AR) and artificial intelligence (AI) technologies. These solutions enhance confidence in online purchases, reduce return rates, and provide retailers with valuable customer insights for personalized marketing and sales optimization.

What are some challenges faced by the Virtual Fitting Room Market?

Challenges include high implementation costs, technical complexity, and compliance with stringent data privacy and security regulations, such as those enforced by the European Union’s General Data Protection Regulation (GDPR). Consumer privacy concerns, variability in user experiences across different devices, and lingering skepticism about the accuracy of virtual fittings also pose barriers to adoption.

Who are the major players in the Virtual Fitting Room Market?

Major players include Fit Analytics, Metail, MemoMi, 3D-A-PORTER, AstraFit, Color IT Tech, ELSE Corp, Fision Technologies, FXGear, and Magic Mirror.

Which segment is leading the market share?

In the virtual fitting room market, the apparel segment holds the largest market share. This dominance is driven by the widespread adoption of virtual fitting technologies by clothing retailers aiming to enhance the online shopping experience, reduce return rates, and increase customer satisfaction.

About Author

Sushant Phapale

Sushant Phapale

ICT & Automation Expert

Sushant is an expert in ICT, automation, and electronics with a passion for innovation and market trends.

View Profile

Virtual Private Server Market

The Virtual Private Server Market size was valued at USD 3,500.00 million in 2018 to USD 5,253.35 million in 2024 and is anticipated to reach USD 12,551.82 million by 2032, at a CAGR of 11.57% during the forecast period.

Intelligent Virtual Assistant (IVA) Market

The Intelligent Virtual Assistant (IVA) Market size was valued at USD 1,750.00 million in 2018 to USD 3,711.40 million in 2024 and is anticipated to reach USD 21,297.40 million by 2032, at a CAGR of 24.44% during the forecast period.

Augmented And Virtual Reality Contact Lens Market

The Global Augmented And Virtual Reality Contact Lens Market size was valued at USD 612.00 million in 2018 to USD 1,087.30 million in 2024 and is anticipated to reach USD 3,945.05 million by 2032, at a CAGR of 17.54% during the forecast period.

Virtual Companion Care Market

The virtual companion care market is projected to grow from USD 7,480 million in 2024 to USD 30,201.5 million by 2032, registering a robust CAGR of 19.06% during the forecast period.

Virtual Queue Management System Market

Virtual Queue Management System Market size was valued at USD 362.6 million in 2024 and is anticipated to reach USD 582 million by 2032, at a CAGR of 6.1% during the forecast period (2024-2032).

Smart Virtual Personal Assistants Market

The Smart Virtual Personal Assistants Market is projected to grow from USD 3,796.32 million in 2024 to USD 24,783.5 million by 2032, reflecting a robust compound annual growth rate (CAGR) of 26.43%.

Virtual Reality (VR) and Augmented Reality (AR) Micro display Market

The Virtual Reality (VR) and Augmented Reality (AR) Microdisplay Market is projected to grow from USD 1,344 million in 2024 to USD 5,296.7 million by 2032, registering a robust compound annual growth rate (CAGR) of 18.7% during the forecast period.

Virtual Private Network (VPN) Routers Market

The Virtual Private Network (VPN) Routers Market is projected to grow from USD 76.13 million in 2024 to USD 196.73 million by 2032, with a compound annual growth rate (CAGR) of 12.6%.

Virtual Desktop Infrastructure (VDI) Software Market

The Virtual Desktop Infrastructure (VDI) Software Market was valued at USD 15,828.51 million and is expected to reach USD 62,175.53 million by 2032, growing at a CAGR of 22.2% during the forecast period.

Corporate Performance Management Market

The Corporate Performance Management Market size was valued at USD 9529.7 million in 2024 and is anticipated to reach USD 25514.1 million by 2032, at a CAGR of 13.1% during the forecast period (2024-2032).

End User Experience Monitoring Market

The End User Experience Monitoring (EUEM) Market size was valued at USD 3890.5 million in 2024 and is anticipated to reach USD 12321.4 million by 2032, growing at a CAGR of 15.5% during the forecast period.

Composite AI Market

The Global Composite AI Market size was valued at USD 1,847.20 million in 2018 to USD 11,791.70 million in 2024 and is anticipated to reach USD 1,39,634.72 million by 2032, at a CAGR of 36.20% during the forecast period.

Cloud Social Media Management Market

The Global Cloud Social Media Management Market size was valued at USD 4,335.18 million in 2018 to USD 8,453.98 million in 2024 and is anticipated to reach USD 23,463.33 million by 2032, at a CAGR of 12.68% during the forecast period.

Canada Telecommunication Services Market

The Canada Telecommunication Services Market size was valued at USD 42,325.05 million in 2018 to USD 52,251.2 million in 2024 and is anticipated to reach USD 73,791.98 million by 2032, at a CAGR of 4.41% during the forecast period.

Connected Baby Monitor Market

The Global Connected Baby Monitor Market size was valued at USD 800.28 million in 2018 to USD 1,370.37 million in 2024 and is anticipated to reach USD 2,910.31 million by 2032, at a CAGR of 9.20% during the forecast period.

Enterprise Wireless Local Area Network (WLAN) Market

The Enterprise Wireless Local Area Network (WLAN) market was valued at USD 8,060.4 million in 2024. It is projected to grow to USD 21,428.1 million by 2032, reflecting a compound annual growth rate (CAGR) of 13% over the forecast period.

Travel Technology Solutions Market

The Travel Technology Solutions Market size was valued at USD 9308 million in 2024 and is anticipated to reach USD 19664.1 million by 2032, at a CAGR of 9.8% during the forecast period (2024-2032).

Explosive Detectors Market

The Explosive Detectors Market size was valued at USD 11214.2 million in 2024 and is anticipated to reach USD 27765.9 million by 2032, at a CAGR of 12% during the forecast period (2024-2032).

Live Streaming Market

The live streaming market size was valued at USD 79554.6 million in 2024 and is anticipated to reach USD 214504.7 million by 2032, at a CAGR of 13.2 % during the forecast period (2024-2032).

Distributed Antenna Systems Market

Distributed Antenna Systems (DAS) Market size was valued at USD 2809 million in 2024 and is anticipated to reach USD 5597.1 million by 2032, at a CAGR of 9% during the forecast period.

Image Processing Systems Market

The Image Processing Systems Market size was valued at USD 13646 million in 2024 and is anticipated to reach USD 26208.6 million by 2032, at a CAGR of 8.5% during the forecast period (2024-2032).

Purchase Options

The report comes as a view-only PDF document, optimized for individual clients. This version is recommended for personal digital use and does not allow printing.
$4699

To meet the needs of modern corporate teams, our report comes in two formats: a printable PDF and a data-rich Excel sheet. This package is optimized for internal analysis and multi-location access, making it an excellent choice for organizations with distributed workforce.
$5699

The report will be delivered in printable PDF format along with the report’s data Excel sheet. This license offers 100 Free Analyst hours where the client can utilize Credence Research Inc.’s research team. It is highly recommended for organizations seeking to execute short, customized research projects related to the scope of the purchased report.
$12699

Credence Staff 3

WILLIAM, North America

Support Staff at Credence Research

KEITH PHILLIPS, Europe

Lee - CR Sales Staff

LEE VALLANCE, Asia Pacific

Kieran Jameson

KIERAN JAMESON, Australia

Report delivery within 24 to 48 hours

User Review

Thank you for the data! The numbers are exactly what we asked for and what we need to build our business case.

Materials Scientist
(privacy requested)

User Review

The report was an excellent overview of the Industrial Burners market. This report does a great job of breaking everything down into manageable chunks.

Imre Hof
Management Assistant, Bekaert

cr-clients-logos

Request Sample