Market Overview:
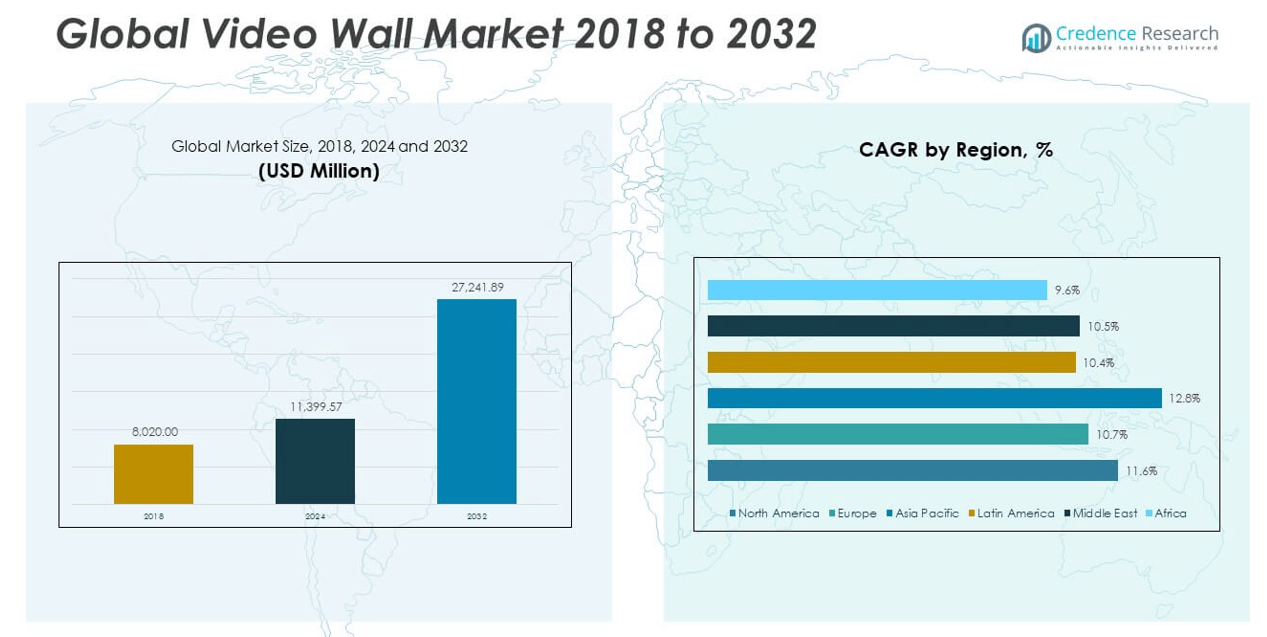
The Video Wall Market size was valued at USD 8,020.00 million in 2018 to USD 11,399.57 million in 2024 and is anticipated to reach USD 27,241.89 million by 2032, at a CAGR of 11.55% during the forecast period.
| REPORT ATTRIBUTE |
DETAILS |
| Historical Period |
2020-2023 |
| Base Year |
2024 |
| Forecast Period |
2025-2032 |
| Video Wall Market Size 2024 |
USD 11,399.57 million |
| Video Wall Market, CAGR |
11.55% |
| Video Wall Market Size 2032 |
USD 27,241.89 million |
The market is experiencing strong growth due to the rising demand for large-scale display solutions across sectors such as retail, hospitality, transportation, and corporate settings. Video walls offer high-resolution visual performance, scalability, and flexibility, which are essential for enhanced customer engagement, real-time data visualization, and collaborative workspaces. Technological advancements, including narrow bezel designs, LED backlighting, and 4K and 8K resolutions, have significantly improved display quality and reduced energy consumption, further accelerating market adoption.
Regionally, North America leads the video wall market, supported by early technological adoption and high investments in digital signage infrastructure across commercial and control room applications. Europe also holds a substantial share due to strong demand from transportation hubs and entertainment venues. Meanwhile, the Asia Pacific region is emerging rapidly, driven by urbanization, smart city initiatives, and expanding retail and public infrastructure projects in countries like China, India, and Japan. This regional momentum reflects diverse applications and increasing investments in digital display ecosystems.
Market Insights:
- The Video Wall Market size was valued at USD 8,020.00 million in 2018 to USD 11,399.57 million in 2024 and is anticipated to reach USD 27,241.89 million by 2032, at a CAGR of 11.55% during the forecast period.
- Rising demand for large-format displays in control rooms, airports, and public surveillance centers is a primary growth driver.
- Technological innovations such as ultra-narrow bezels, fine pitch LEDs, and high-resolution content compatibility are expanding product appeal.
- High installation and maintenance costs, coupled with limited interoperability between systems, restrict wider adoption.
- North America leads the market due to advanced infrastructure and early adoption across commercial and government sectors.
- Asia Pacific is emerging rapidly, driven by urban development, retail expansion, and smart city initiatives.
- Europe shows steady growth with strong investments in transportation hubs and high-end digital signage applications.
Access crucial information at unmatched prices!
Request your sample report today & start making informed decisions powered by Credence Research Inc.!
Download Sample
Market Drivers:
Rising Demand Across Control Rooms and Surveillance Applications Fuels Market Expansion
The Video Wall Market benefits significantly from the increasing need for real-time monitoring in control rooms and security environments. Organizations in sectors like transportation, energy, and defense require continuous visual data to make rapid decisions. Video walls offer high-resolution displays that enable better situational awareness and quicker response. This requirement has intensified with the rise of smart city projects and infrastructure digitization. In security operations centers, large-screen visibility allows for better incident tracking and system diagnostics. Government and utility departments have begun integrating video wall systems to improve public safety and asset management.
- For example, LamasaTech’s ultra-narrow bezel video wall displays feature bezels as thin as 0.44mm, resulting in a near-seamless 0.88mm bezel-to-bezel width. These panels are engineered for 24/7 operation, boasting over 60,000 hours of life expectancy and available brightness ratings of 500 or 700cd/m².
Corporate Digitization and Remote Collaboration Tools Elevate Product Utility
Enterprises adopting digital transformation strategies increasingly install video walls in boardrooms, collaboration areas, and reception spaces. It supports internal communication, branding, and real-time collaboration across dispersed teams. With hybrid work models, companies deploy unified communication platforms that integrate with visual displays. High-definition video walls support dynamic presentation delivery and immersive content sharing, improving team productivity. Corporate training centers also leverage this technology for interactive education and simulations. As visual storytelling becomes essential in business communication, demand for seamless and engaging display systems rises.
- For example, AG Neovo’s PN-46D2 46″ display uses UniWall™ technology and DisplayPort 1.2 daisy-chaining to create large, virtually seamless walls supporting up to a 15×15 matrix. Each unit delivers 500 nits brightness and supports both landscape and portrait orientation for dynamic content.
Retail and Hospitality Sectors Prioritize Immersive Customer Experiences
Retailers and hotel operators increasingly use video walls to elevate visual merchandising and enhance customer engagement. Large-format screens deliver brand messaging, seasonal campaigns, and product promotions with high clarity and visual appeal. In-store video walls enable immersive digital experiences, encouraging longer customer dwell times. Hospitality providers, including luxury hotels and entertainment venues, incorporate video walls in lobbies, conference halls, and event spaces. It enhances guest experiences and supports digital signage for navigation and live updates. Retail chains also benefit from centralized content control across multiple outlets. Dynamic visuals help businesses stand out in competitive urban environments. The Video Wall Market finds substantial growth in consumer-facing sectors that emphasize engagement and experience.
Technology Evolution Drives Performance and Cost-Efficiency Gains
Advancements in LED, OLED, and microLED technologies significantly enhance image quality, brightness, and energy efficiency. Manufacturers produce ultra-narrow bezel displays that offer seamless visuals and reduce installation complexity. These innovations improve display longevity while lowering operational costs. The integration of AI-powered processors enables real-time content adjustment and predictive maintenance. Connectivity enhancements through wireless systems and IP-based infrastructure expand deployment flexibility. Touchscreen compatibility and interactivity features open use cases in education and exhibitions. The Video Wall Market embraces innovation to meet diverse end-user demands. It remains attractive to budget-conscious institutions and technologically forward industries alike.
Market Trends:
Shift Toward Modular and Scalable Architectures for Custom Installations
The Video Wall Market is witnessing a notable shift toward modular systems that enable flexible configurations across varying spaces. Architects and systems integrators prefer units that can be adapted for different dimensions and room layouts. Modular designs allow for seamless upgrades and phased investments, which align well with evolving spatial and operational needs. The trend supports greater design freedom in sectors like education, museums, and religious institutions. Installers can easily replace or service components without dismantling the full setup. This adaptability also caters to businesses operating in leased spaces with limited reconfiguration rights.
- For instance, Samsung’s The Wall exemplifies the industry’s shift to modular video wall systems, with individual MicroLED modules that can be custom-configured to virtually any shape and scale. Each module measures 806.4mm by 453.6mm and the system allows seamless assembly up to 583 inches diagonal with 8K resolution.
Growing Popularity of Fine Pitch LED Displays in High-End Applications
Fine pitch LED displays continue gaining traction in corporate, broadcast, and entertainment applications due to superior image resolution and uniform brightness. Their ability to support high refresh rates and 4K or 8K content makes them ideal for close viewing scenarios. They outperform traditional LCD displays in terms of contrast, seamlessness, and longevity. Designers now integrate these displays into curved and wraparound structures, enhancing spatial aesthetics. In broadcast studios, fine pitch LEDs offer color accuracy critical for video production. Corporations use them in flagship locations for visual branding and investor presentations. It adds a premium dimension to the display experience and supports dynamic digital storytelling. The Video Wall Market evolves alongside these innovations.
- For example, Planar and Barco have advanced fine pitch LED technology with solutions supporting extremely high pixel densities and refresh rates up to 3,840Hz. The Planar DirectLight Slim Series offers MicroLED models with a minimum installation depth of just 2 inches, pixel pitches down to 0.9mm, and maximum brightness of 1,600 nits. Its 4:9 aspect ratio and curved configuration capability enable seamless integration into nontraditional architectural envelopes, such as circular boardrooms or curved broadcast sets
Integration of Real-Time Analytics and Intelligent Content Delivery
Interactive video walls increasingly incorporate content management software with analytics features that track viewer engagement and content performance. Businesses use these tools to tailor content based on traffic flow, demographics, or real-time events. In public venues and retail spaces, dynamic content adjusts based on crowd size, weather, or promotions. Intelligent scheduling enables efficient content rotation without manual input. These capabilities allow advertisers to measure ROI more effectively and optimize display strategies. Government agencies and transport hubs also deploy analytics to improve public communication. It enables contextual messaging and efficient screen usage. The Video Wall Market responds to the demand for intelligent, responsive, and data-driven visual systems.
Convergence with Augmented Reality and Immersive Display Technologies
The combination of video walls with AR platforms and motion-sensing interfaces creates fully immersive environments for brand storytelling and entertainment. These integrations allow audiences to engage with content through gestures or devices. In automotive showrooms and trade expos, customers interact with 3D product models on large displays. Educational institutions use this approach for simulations and interactive learning modules. It expands the use case potential beyond static presentations. Virtual studio production teams also benefit from this convergence in creating compelling virtual backgrounds. The Video Wall Market gains new dimensions through creative and immersive content delivery. It helps differentiate physical experiences from conventional screens.
Market Challenges Analysis:
High Capital Investment Requirements and Operational Complexities Slow Adoption
Initial deployment of video walls requires significant capital, particularly for high-resolution LED systems and fine pitch displays. Installation involves structural reinforcements, power arrangements, and specialized cooling systems in some cases. These cost barriers limit adoption among small enterprises and educational institutions with limited budgets. Operational expenses, including calibration, maintenance, and periodic component replacement, add to total ownership costs. Complex control systems and media players necessitate trained personnel, which presents a resource constraint for smaller organizations. Inconsistent procurement standards across regions further complicate system design and vendor coordination.
Lack of Standardization and Interoperability Hampers Seamless Integration
The diversity of hardware and software solutions often leads to compatibility issues between display units, controllers, and content management systems. Manufacturers offer proprietary configurations, which limit cross-vendor interoperability. System integrators face challenges aligning new deployments with existing AV infrastructure, especially in legacy buildings or hybrid IT environments. Without unified standards, customers experience difficulty scaling installations across sites or updating existing components. The Video Wall Market encounters friction where integration with building management systems or digital signage networks is required. It must address these technical constraints to enhance cross-platform deployment and reduce dependency on exclusive vendor ecosystems.
Market Opportunities:
Emergence of Smart Cities and Digital Infrastructure Drives New Installations
Government investments in smart city initiatives and urban modernization create favorable conditions for video wall deployments. Public command centers, traffic monitoring stations, and information kiosks increasingly rely on high-resolution visual platforms. Municipalities adopt video walls to streamline emergency responses, public broadcasting, and civic engagement. It opens new revenue streams for suppliers and system integrators through long-term service contracts and infrastructure integration. The Video Wall Market stands to gain from government-backed digital transformation projects across Asia, the Middle East, and Latin America.
Expansion of the Experiential Economy Creates Demand in Events and Retail
The growth of experience-driven marketing and themed entertainment boosts demand for large-format, immersive displays. Event organizers, fashion brands, and media companies seek impactful visuals for exhibitions, launches, and pop-up stores. Video walls support storytelling through synchronized visual effects, making them central to consumer experience design. It finds traction in both temporary setups and permanent entertainment venues. The Video Wall Market captures new growth opportunities by serving experience-focused industries that prioritize audience engagement.
Market Segmentation Analysis:
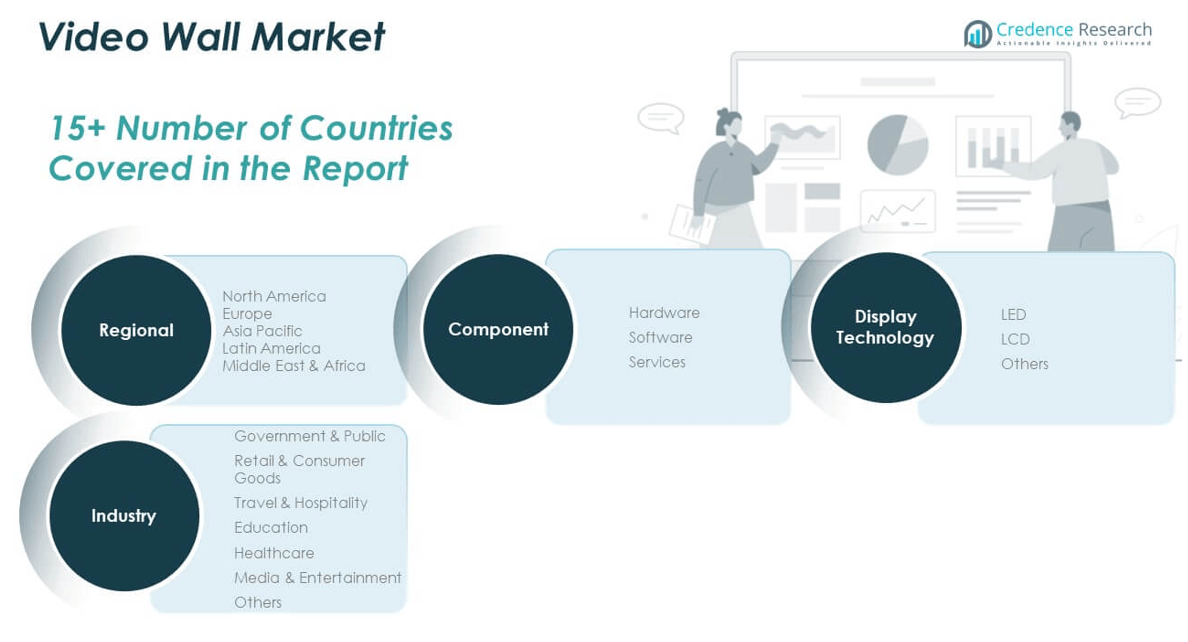
The Video Wall Market is segmented by component into hardware, software, and services.
By component Hardware dominates the market share, driven by strong demand for high-resolution displays, controllers, and mounting systems. Software plays a growing role, offering real-time content management, analytics, and seamless integration across systems. Services such as installation, maintenance, and consulting are gaining traction, particularly in large-scale deployments requiring long-term support.
- For example, Samsung’s proprietary controller for The Wall IWA Series supports up to 40,000 nits peak brightness and 8K resolution across unlimited modular configurations.
By display technology, the market includes LED, LCD, and other categories. LED technology leads due to its brightness, energy efficiency, and seamless visual output, making it ideal for large venues and outdoor environments. LCD remains widely used for indoor applications where budget constraints and moderate performance requirements align. Other categories, such as projection cubes and emerging microLEDs, serve niche applications that require specific resolutions or formats.
- For example, Barco UniSee is a well-documented LCD video wall platform featuring 55-inch, bezel-less panels with “NoGap” technology and innovative mounting. It is promoted for high-end corporate, control room, and experience center installations,
By industry verticals, government and public institutions represent a key segment, using video walls for control rooms and emergency management. Retail and consumer goods sectors leverage them for digital signage and branding. Travel and hospitality use them in airports, hotels, and event venues to enhance visitor experience. Education and healthcare deploy video walls for collaborative learning and real-time diagnostics. Media and entertainment utilize them for broadcast studios, virtual production, and immersive installations. It supports diverse industries with solutions tailored to operational and communication needs.
Segmentation:
By Component:
- Hardware
- Software
- Services
By Display Technology:
By Industry:
- Government & Public
- Retail & Consumer Goods
- Travel & Hospitality
- Education
- Healthcare
- Media & Entertainment
- Others
By Region:
- North America
- Europe
- Germany
- France
- U.K.
- Italy
- Spain
- Rest of Europe
- Asia Pacific
- China
- Japan
- India
- South Korea
- South-east Asia
- Rest of Asia Pacific
- Latin America
- Brazil
- Argentina
- Rest of Latin America
- Middle East & Africa
- GCC Countries
- South Africa
- Rest of the Middle East and Africa
Regional Analysis:
North America
The North America Video Wall Market size was valued at USD 2,766.90 million in 2018 to USD 3,882.62 million in 2024 and is anticipated to reach USD 9,265.02 million by 2032, at a CAGR of 11.6% during the forecast period. North America holds a 34.05% share of the global market, driven by high adoption across commercial, command-and-control, and corporate sectors. Strong investment in digital signage infrastructure and early uptake of advanced display technologies support regional dominance. The U.S. leads the demand with significant deployments in retail chains, transport hubs, and mission-critical operations. Organizations in the region prioritize high-resolution visual systems that integrate seamlessly with enterprise platforms.
Europe
The Europe Video Wall Market size was valued at USD 1,983.35 million in 2018 to USD 2,702.53 million in 2024 and is anticipated to reach USD 6,076.38 million by 2032, at a CAGR of 10.7% during the forecast period. Europe accounts for 23.14% of the global share, supported by demand from transportation, exhibition, and corporate communication segments. Countries like Germany, the UK, and France lead in integrating video wall solutions into public infrastructure and enterprise workspaces. Urban development and airport modernization programs expand the need for dynamic display systems. The region places a strong emphasis on energy efficiency and design aesthetics, prompting demand for sustainable and seamless display configurations.
Asia Pacific
The Asia Pacific Video Wall Market size was valued at USD 2,215.12 million in 2018 to USD 3,272.20 million in 2024 and is anticipated to reach USD 8,540.35 million by 2032, at a CAGR of 12.8% during the forecast period. Asia Pacific holds a 31.35% share of the global market, with rapid growth driven by smart city initiatives, expanding public infrastructure, and retail digitization. China, Japan, South Korea, and India lead demand through investments in transport surveillance, public information systems, and consumer engagement platforms. It benefits from local manufacturing capabilities that reduce hardware costs and support widespread adoption. Government programs aimed at urban safety and modernization fuel control room and command center deployments.
Latin America
The Latin America Video Wall Market size was valued at USD 434.68 million in 2018 to USD 610.90 million in 2024 and is anticipated to reach USD 1,336.76 million by 2032, at a CAGR of 10.4% during the forecast period. Latin America accounts for 4.91% of the global market, showing steady progress in retail, transportation, and government applications. Countries like Brazil, Mexico, and Chile invest in airport upgrades, transit systems, and city surveillance projects that require visual display solutions. It sees emerging demand in hospitality and digital advertising, particularly in urban commercial zones. Local integrators and AV distributors help expand market accessibility by offering customized deployment models
Middle East
The Middle East Video Wall Market size was valued at USD 390.57 million in 2018 to USD 527.73 million in 2024 and is anticipated to reach USD 1,166.10 million by 2032, at a CAGR of 10.5% during the forecast period. The region represents 4.28% of the global market, led by digital transformation efforts in the UAE, Saudi Arabia, and Qatar. Video walls support control centers, security infrastructure, and high-end retail environments. Government-backed infrastructure initiatives such as Vision 2030 programs stimulate demand for smart displays and public communication platforms. It sees notable uptake in luxury hotels, stadiums, and event venues that prioritize digital engagement. Integration with AI and analytics platforms is increasing in control room applications.
Africa
The Africa Video Wall Market size was valued at USD 229.37 million in 2018 to USD 403.59 million in 2024 and is anticipated to reach USD 857.28 million by 2032, at a CAGR of 9.6% during the forecast period. Africa holds a 3.14% share of the global market and shows gradual adoption in transportation hubs, public safety, and education sectors. South Africa, Nigeria, and Kenya are key countries investing in digital infrastructure to improve urban services and information systems. The market is supported by donor-led urban planning projects and regional AV integration initiatives. Affordability and local service availability remain crucial for adoption, prompting vendors to offer modular and low-maintenance solutions. It shows promise in corporate environments and event spaces in high-growth urban centers.
Shape Your Report to Specific Countries or Regions & Enjoy 30% Off!
Key Player Analysis:
- Sony Corporation
- Samsung Electronics Co Ltd
- Koninklijke Philips N.V
- Panasonic Corporation
- Adflow Networks
- NEC Display Solutions
- Navori SA
- Omnivex Corporation
- AU Optronics Corp
- Toshiba Corporation
- Electronic Displays Inc
- ViewSonic Corporation
- Leyard Optoelectronic Co Ltd
- Shenzhen Unilumin Group Co Ltd
- Planar Systems
- NEC Corporation
- LG Electronics Inc
Competitive Analysis:
The Video Wall Market features intense competition among global and regional players focusing on product innovation, visual performance, and cost efficiency. Leading companies include LG Display, Samsung Electronics, Leyard Optoelectronic, Barco NV, and NEC Corporation. These firms invest in ultra-narrow bezel displays, fine pitch LED panels, and AI-integrated control systems to strengthen product portfolios. It sees strong R&D activity and strategic collaborations to meet evolving industry needs. Smaller players compete by offering niche solutions, flexible pricing, and localized services. Key competitors prioritize durability, energy efficiency, and ease of installation to enhance market appeal. The Video Wall Market demands high customization, pushing companies to deliver modular, scalable, and maintenance-friendly products. Technological leadership, strong distribution networks, and after-sales support remain central to competitive positioning.
Recent Developments:
- In June 2025, Sony Electronics launched the Crystal LED CAPRI series, expanding its LED display lineup. This new product is aimed at supporting virtual production for television, film, and broadcast, making advanced video wall technology more accessible to creative industries.
- In September 2024, PPDS and Oracle Red Bull Racing installed a record breaking 46.25 m wide Philips dvLED video wall at the MK 7 venue claimed to be “Europe’s largest indoor dvLED wall” unveiled during a PPDS event on 10 September.
Market Concentration & Characteristics
The Video Wall Market demonstrates moderate to high market concentration, with a few dominant global players holding significant share across enterprise, control room, and commercial sectors. It is characterized by rapid technological innovation, short product life cycles, and increasing demand for customization across applications. The market favors vendors with strong manufacturing capabilities, software integration support, and global logistics infrastructure. It supports both large-scale installations and niche, mobile formats, reflecting diverse end-user preferences. Buyers expect seamless interoperability, long-term durability, and energy efficiency from suppliers. Strategic collaborations and continuous R&D drive differentiation. The Video Wall Market remains highly responsive to visual performance standards and system scalability demands.
Report Coverage:
The research report offers an in-depth analysis based on Component, Display Technology and Industry. It details leading market players, providing an overview of their business, product offerings, investments, revenue streams, and key applications. Additionally, the report includes insights into the competitive environment, SWOT analysis, current market trends, as well as the primary drivers and constraints. Furthermore, it discusses various factors that have driven market expansion in recent years. The report also explores market dynamics, regulatory scenarios, and technological advancements that are shaping the industry. It assesses the impact of external factors and global economic changes on market growth. Lastly, it provides strategic recommendations for new entrants and established companies to navigate the complexities of the market.
Future Outlook:
- Demand will rise for interactive and AI-driven video walls in smart control rooms and command centers.
- Enterprises will adopt modular and seamless displays to support hybrid workplaces and digital collaboration.
- Fine pitch LED and microLED technologies will become mainstream in premium commercial applications.
- Retail and hospitality sectors will continue to invest in immersive video walls for experiential marketing.
- Urban infrastructure development and smart city projects will create sustained demand in emerging regions.
- Integration with data analytics and audience measurement tools will enhance content delivery strategies.
- Education and healthcare institutions will expand use of video walls for simulation, learning, and information sharing.
- Declining hardware costs and improved power efficiency will increase adoption among mid-sized businesses.
- Manufacturers will prioritize ultra-slim, bezel-free designs for aesthetic appeal and space optimization.
- Strategic partnerships and localized production will help global players strengthen regional competitiveness.


