Market Overview:
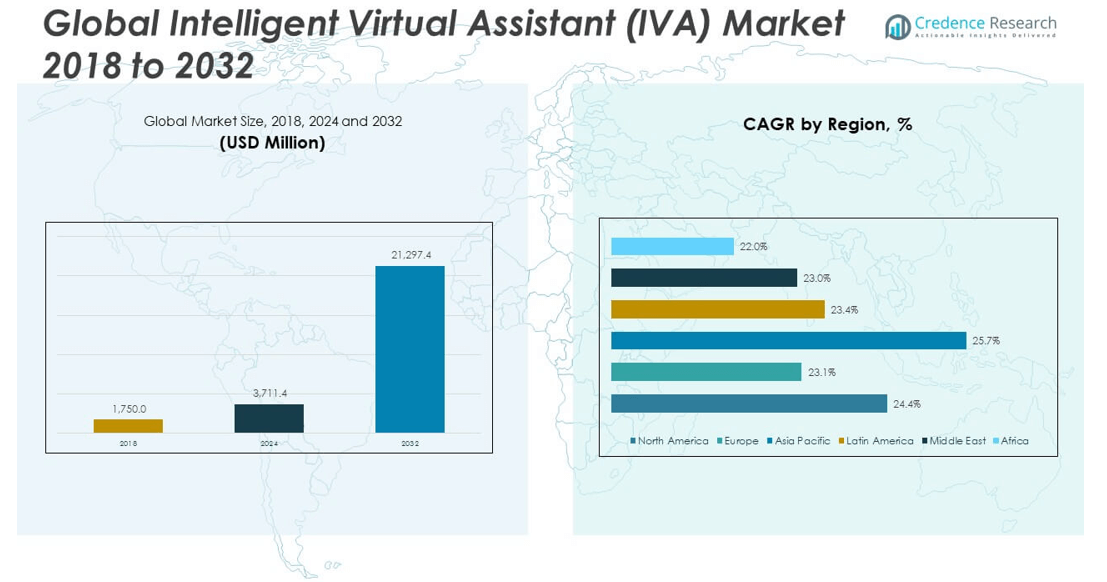
The Intelligent Virtual Assistant (IVA) Market size was valued at USD 1,750.00 million in 2018 to USD 3,711.40 million in 2024 and is anticipated to reach USD 21,297.40 million by 2032, at a CAGR of 24.44% during the forecast period.
| REPORT ATTRIBUTE |
DETAILS |
| Historical Period |
2020-2023 |
| Base Year |
2024 |
| Forecast Period |
2025-2032 |
| Intelligent Virtual Assistant (IVA) Market Size 2024 |
USD 3,711.40 million |
| Intelligent Virtual Assistant (IVA) Market, CAGR |
24.44% |
| Intelligent Virtual Assistant (IVA) Market Size 2032 |
USD 21,297.40 million |
Rising demand for automation in customer service, rapid adoption of AI-powered tools, and the proliferation of smart devices have significantly driven the IVA market. Businesses across sectors such as BFSI, healthcare, retail, and telecommunications are leveraging intelligent virtual assistants to enhance customer engagement, reduce operational costs, and improve overall service efficiency. The integration of natural language processing (NLP) and machine learning capabilities is enabling these assistants to deliver more personalized, context-aware, and human-like interactions, fueling further adoption across digital customer-facing platforms.
North America leads the IVA market, driven by strong investments in AI, widespread digital transformation, and early adoption across industries. The U.S. remains at the forefront due to the presence of major tech companies and a mature digital infrastructure. Europe follows with a focus on automation and regulatory support for digital technologies. Meanwhile, the Asia-Pacific region is emerging rapidly, with countries like China, Japan, and India expanding IVA usage across e-commerce, banking, and healthcare, propelled by a growing tech-savvy population and increasing smartphone penetration.
Market Insights:
- The Intelligent Virtual Assistant (IVA) Market was valued at USD 3,711.40 million in 2024 and is projected to reach USD 21,297.40 million by 2032, growing at a CAGR of 24.44%.
- Rising demand for automation in customer engagement is driving widespread IVA deployment across BFSI, retail, and healthcare sectors.
- Integration of advanced AI, NLP, and context-aware technologies is improving IVA performance and enhancing user experience.
- Data privacy concerns and regulatory compliance challenges remain key restraints limiting adoption in sensitive industries.
- North America led the market in 2024 with a 38.2% share, supported by strong digital infrastructure and enterprise investment.
- Asia Pacific is emerging as a high-growth region due to rapid digitalization, mobile-first usage, and multilingual IVA adoption.
- Market players face challenges in contextual understanding and multilingual capabilities, affecting IVA accuracy and user trust.
Access crucial information at unmatched prices!
Request your sample report today & start making informed decisions powered by Credence Research Inc.!
Download Sample
Market Drivers:
Growing Enterprise Demand for Automating Customer Interactions to Improve Efficiency and Reduce Costs
Businesses across industries are actively adopting IVAs to streamline customer service processes. These tools reduce the need for human intervention in repetitive tasks and enable faster response times. Companies benefit from lower operational costs and improved scalability of support functions. The Intelligent Virtual Assistant (IVA) Market is expanding as organizations seek to enhance customer experience while optimizing workforce allocation. It plays a critical role in minimizing customer wait times and ensuring consistent communication. IVAs also offer multilingual support, addressing the global customer base of enterprises. The demand is strong in sectors like BFSI, e-commerce, and telecommunications. These industries prioritize automation to handle large volumes of inquiries while maintaining service quality.
- For example, Bank of America’s virtual assistant, Erica, has facilitated more than 2 billion client interactions since its launch in 2018, significantly exceeding the 1.5 billion milestone and demonstrating its effectiveness in customer self-service and engagement.
Integration of AI, NLP, and Context-Aware Capabilities Enhancing Conversational Intelligence
The rise in adoption of AI and NLP technologies has made IVAs significantly more intuitive and responsive. These tools now understand context, intent, and sentiment with greater accuracy. It empowers businesses to deliver personalized conversations that feel natural to users. The Intelligent Virtual Assistant (IVA) Market is benefitting from this evolution in AI, enabling more human-like engagements. Enhanced capabilities reduce user frustration and increase satisfaction across customer touchpoints. Enterprises increasingly integrate IVAs into web, mobile, and voice platforms. This multi-channel presence expands the scope of customer interaction. With growing user expectations, intelligent assistants need to learn and adapt continuously, which AI integration supports effectively.
Proliferation of Smart Devices and Growing Use of Voice Interfaces in Consumer Applications
Smartphones, smart speakers, and connected devices have become widespread across global markets. Consumers frequently use voice assistants for everyday tasks, setting the stage for IVA growth. It aligns with rising demand for hands-free, voice-activated digital support. The Intelligent Virtual Assistant (IVA) Market continues to expand as consumers engage with technology in more natural ways. Businesses now deploy IVAs in consumer electronics, automotive infotainment, and healthcare monitoring tools. This growth increases awareness and acceptance of virtual assistants among end users. Manufacturers embed virtual assistants directly into devices, enabling faster adoption. The expansion of IoT and smart homes also contributes to the rising deployment of IVAs.
- For instance, Amazon Alexa is now integrated into over 600 million devices worldwide, significantly expanding consumer engagement with voice-enabled virtual assistants and reinforcing widespread adoption across smart home and mobile ecosystems.
Increased Adoption in Healthcare, Education, and Government for Scalable Digital Services
Healthcare providers now rely on IVAs for appointment scheduling, patient triage, and general inquiries. Educational institutions deploy them for enrollment support and student information access. It supports large-scale communication needs while reducing pressure on administrative staff. The Intelligent Virtual Assistant (IVA) Market gains traction in public services, with government agencies using IVAs for citizen engagement. These deployments improve accessibility to services and ensure information is available 24/7. Virtual assistants help standardize messaging, which is vital during emergencies or health crises. Their usage in pandemic response boosted adoption across healthcare and public sectors. The market reflects growing confidence in IVAs to handle sensitive, critical communication reliably.
Market Trends
Rise in Emotion Recognition Capabilities to Humanize Interactions and Improve User Trust
Developers are embedding emotion detection into virtual assistants to simulate empathetic interactions. This approach builds user trust and drives longer engagement periods. It enables the assistant to modify tone, pace, or message depending on user sentiment. The Intelligent Virtual Assistant (IVA) Market is advancing through emotion-aware solutions in sectors like mental health, HR, and customer service. These features support emotionally intelligent responses, improving outcomes in sensitive situations. Companies use these tools to strengthen brand perception. It also reduces user churn by promoting more personalized support. Emotion recognition adds depth to AI engagement, especially in high-stakes or personal contexts.
Expansion of IVA Applications in Internal Enterprise Operations Beyond Customer Service
IVAs are now assisting employees internally with tasks like IT support, HR queries, and workflow automation. Companies implement them within internal communication platforms for task management and data retrieval. It helps reduce the workload on support teams and improves internal efficiency. The Intelligent Virtual Assistant (IVA) Market shows diversification beyond external-facing roles. Enterprises view IVAs as tools to enhance employee productivity and reduce information silos. These assistants offer fast answers to procedural and policy-related questions. The ability to integrate with enterprise software enhances their utility. Organizations increasingly position IVAs as digital coworkers supporting daily operations.
Shift Toward Multimodal IVA Interfaces Combining Voice, Text, and Visual Elements
IVAs now support multimodal interaction using a combination of voice commands, text responses, and visual displays. This advancement improves accessibility and user experience across platforms. It ensures consistent performance across smartphones, kiosks, desktops, and smart TVs. The Intelligent Virtual Assistant (IVA) Market adapts to user preferences by offering flexible communication modes. Multimodal capabilities help address different user needs, including visual learners or hearing-impaired users. Businesses use these assistants to offer rich media responses like videos, infographics, and live updates. It increases engagement and comprehension, particularly in education and training applications. Demand continues to rise for IVAs that communicate beyond just voice.
- For instance, Google Gemini powers a multimodal assistant that can analyze uploaded images, comprehend related queries, and respond via text or voice.
Rising Integration of IVA Technology into Automotive Systems for In-Car Experience Enhancement
Automotive manufacturers integrate IVAs into infotainment systems to deliver real-time navigation, vehicle control, and hands-free communication. These assistants support natural voice commands, reducing driver distraction. It aligns with the shift toward connected and autonomous vehicles. The Intelligent Virtual Assistant (IVA) Market gains momentum as consumers expect AI-enabled features in modern cars. IVAs enable interaction with smart homes or work calendars from within the vehicle. Manufacturers use these technologies to differentiate premium models. These assistants also handle emergency alerts and predictive maintenance. As electric and connected vehicle markets grow, so does the need for intelligent in-car assistants.
- For instance, Volvo will become the first automaker to integrate Google’s Gemini conversational AI yet more advanced than Google Assistant into its vehicles to enable natural voice requests like directions, manual lookup, and messaging.
Market Challenges Analysis
Data Privacy Concerns and Regulatory Compliance Issues Impact User Trust and Adoption
Widespread deployment of IVAs raises concerns about data privacy, surveillance, and potential misuse of personal information. Organizations must ensure compliance with data protection laws such as GDPR, HIPAA, and CCPA. Users hesitate to engage with IVAs if they fear their information will be recorded or shared without consent. The Intelligent Virtual Assistant (IVA) Market faces increasing scrutiny, especially in healthcare and finance sectors where sensitive data is handled. Companies must implement end-to-end encryption, anonymization techniques, and secure data storage practices. Ensuring transparency in data collection processes is essential to build trust. Non-compliance could result in financial penalties and reputational damage. Legal ambiguity in cross-border data flows complicates expansion strategies for multinational deployments.
Limitations in Contextual Understanding and Language Support Affect Performance and Reach
Many IVAs still struggle with interpreting context, managing long conversations, or handling complex queries. Users encounter frustration when assistants fail to understand intent or provide irrelevant responses. It affects user satisfaction and limits repeated usage. The Intelligent Virtual Assistant (IVA) Market must overcome these limitations to ensure sustained engagement and performance across use cases. Multilingual support remains inadequate in many tools, creating barriers in diverse markets. Lack of support for local dialects and cultural nuance hinders penetration in emerging regions. Developers face challenges in continuously training models without increasing infrastructure costs. These limitations reduce the value of deployment in knowledge-intensive or high-stakes applications.
Market Opportunities
Growing Demand in Underserved Regions with Expanding Internet and Mobile Penetration
Emerging markets offer untapped potential where digital services are expanding rapidly. It presents an opportunity to deploy IVAs in vernacular languages across rural and semi-urban areas. The Intelligent Virtual Assistant (IVA) Market could address information access gaps in healthcare, government, and financial services. With mobile-first users driving engagement, voice-first IVAs find strong relevance. Organizations that invest early in localization strategies can build strong user bases. Demand is high in sectors needing scalable communication without extensive infrastructure. Deployment of cloud-based solutions lowers entry barriers. These markets represent the next wave of high-growth IVA adoption.
Advancements in Generative AI and Contextual AI Creating New Possibilities for IVA Development
Recent breakthroughs in large language models and contextual AI unlock new avenues for IVA capabilities. These technologies allow assistants to handle nuanced, multi-turn conversations across industries. It enables more personalized, human-like interaction even in complex scenarios. The Intelligent Virtual Assistant (IVA) Market benefits from cross-industry innovation, especially in GenAI toolkits and APIs. Companies can now create vertical-specific assistants without building from scratch. Generative AI also accelerates content generation, summaries, and adaptive responses. This trend supports use cases in legal tech, consulting, and education. It raises the bar for user expectations and service delivery.
Market Segmentation Analysis:
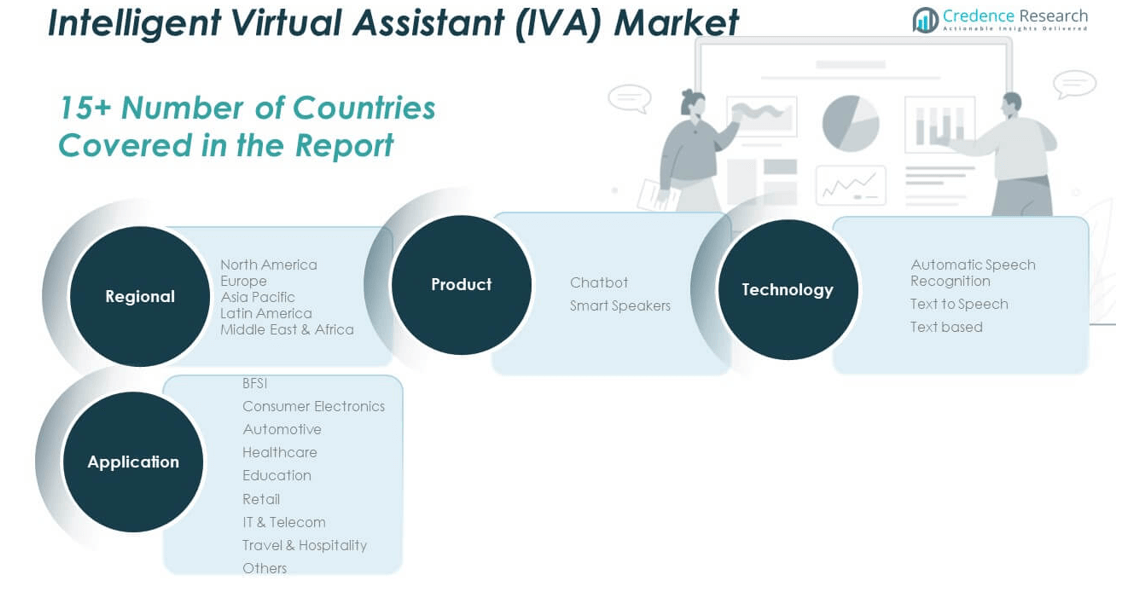
The Intelligent Virtual Assistant (IVA) Market is segmented
By product into chatbots and smart speakers. Chatbots lead the segment due to their integration across websites, messaging platforms, and enterprise service portals. Smart speakers follow closely, driven by consumer demand for hands-free voice interfaces and home automation. Both product types support growing personalization in user interactions and contribute to higher engagement across consumer and enterprise domains.
- For example, Amazon has sold millions of Echo smart speakers globally, enabling hands-free interaction across smart home environments. Chatbots like Bank of America’s Erica have handled over 2 billion interactions, showcasing widespread enterprise integration.
By application, the market spans BFSI, consumer electronics, automotive, healthcare, education, retail, IT & telecom, travel & hospitality, and others. BFSI organizations use IVAs to handle high volumes of customer inquiries and financial transactions securely. Consumer electronics integrate virtual assistants to enhance device interactivity and functionality. In automotive, IVA supports in-car voice commands and infotainment systems. Healthcare providers implement these solutions for appointment management and patient guidance. The retail sector adopts IVAs to improve customer engagement and streamline operations. Education, IT & telecom, and travel industries use them to deliver real-time support and optimize digital workflows.
- For example, Google Assistant leverages automatic speech recognition for voice commands across 1 billion devices. Microsoft’s Azure Speech offers high-quality text-to-speech output, while enterprise chatbots like Drift and LivePerson manage millions of text-based customer queries.
By technology, the Intelligent Virtual Assistant (IVA) Market includes automatic speech recognition, text to speech, and text-based solutions. Automatic speech recognition dominates in voice-enabled applications across devices and platforms. Text to speech solutions facilitate accessibility and voice responses for visually impaired users. Text-based assistants maintain relevance in chat-driven customer support systems. Each technology plays a critical role in delivering seamless, context-aware interactions that align with user expectations and digital transformation initiatives.
Segmentation:
By Product:
By Application:
- BFSI
- Consumer Electronics
- Automotive
- Healthcare
- Education
- Retail
- IT & Telecom
- Travel & Hospitality
- Others
By Technology:
- Automatic Speech Recognition
- Text to Speech
- Text Based
By Region:
- North America
- Europe
- Germany
- France
- U.K.
- Italy
- Spain
- Rest of Europe
- Asia Pacific
- China
- Japan
- India
- South Korea
- South-east Asia
- Rest of Asia Pacific
- Latin America
- Brazil
- Argentina
- Rest of Latin America
- Middle East & Africa
- GCC Countries
- South Africa
- Rest of the Middle East and Africa
Regional Analysis:
North America
The North America Intelligent Virtual Assistant (IVA) Market size was valued at USD 689.50 million in 2018 to USD 1,445.94 million in 2024 and is anticipated to reach USD 8,286.86 million by 2032, at a CAGR of 24.4% during the forecast period. North America accounted for 38.2% of the global market share in 2024. It leads the market due to high adoption of AI-powered customer engagement tools across sectors such as BFSI, healthcare, and retail. Strong digital infrastructure, presence of key players, and early adoption of smart technologies drive market leadership. Enterprises invest heavily in voice assistants, chatbots, and cognitive computing platforms to automate customer support and internal processes. The U.S. contributes the largest share, supported by widespread smart speaker usage and advanced machine learning applications. Canada and Mexico show growing interest in voice-based IVA tools across consumer and government sectors. The region continues to attract major investments in R&D and AI-driven conversational platforms.
Europe
The Europe Intelligent Virtual Assistant (IVA) Market size was valued at USD 303.63 million in 2018 to USD 605.97 million in 2024 and is anticipated to reach USD 3,178.69 million by 2032, at a CAGR of 23.1% during the forecast period. Europe represented 16.3% of the global market share in 2024. The region’s growth is supported by rising deployment of virtual assistants in banking, insurance, and public administration. Countries such as the UK, Germany, and France drive adoption due to strong regulatory frameworks supporting data security and innovation. The EU’s push for digital transformation and AI integration across sectors adds to the momentum. Enterprises implement IVA tools to improve multilingual customer support and manage high call volumes efficiently. Smart speakers and chat-based platforms see rapid adoption in both commercial and residential settings. Europe also benefits from increasing investment in voice recognition and natural language processing. Regional companies seek to enhance user engagement and service personalization using AI-driven assistants.
Asia Pacific
The Asia Pacific Intelligent Virtual Assistant (IVA) Market size was valued at USD 516.25 million in 2018 to USD 1,135.12 million in 2024 and is anticipated to reach USD 7,077.14 million by 2032, at a CAGR of 25.7% during the forecast period. Asia Pacific captured 30.6% of the global market share in 2024. The region is witnessing robust growth due to increasing smartphone penetration, rising digital literacy, and strong demand for virtual agents in sectors like e-commerce and healthcare. China and Japan lead adoption with investments in AI and smart device ecosystems. India and Southeast Asia are emerging as key growth markets driven by customer service automation in financial services, retail, and education. Local enterprises integrate multilingual IVA systems to engage diverse user bases. Demand for mobile-based and voice-first assistants continues to rise with expanding internet access. The region’s start-up ecosystem and government-led digitalization programs strengthen IVA deployment across industries.
Latin America
The Latin America Intelligent Virtual Assistant (IVA) Market size was valued at USD 124.60 million in 2018 to USD 261.99 million in 2024 and is anticipated to reach USD 1,407.12 million by 2032, at a CAGR of 23.4% during the forecast period. Latin America held 7.1% of the global market share in 2024. Brazil, Mexico, and Argentina are leading adoption through digital transformation in customer service operations. The region shows increased IVA use in retail, telecom, and public services where scalability and automation are key. Companies deploy chatbots and virtual agents to manage high customer volumes and deliver round-the-clock support. Growth in fintech and online platforms contributes to wider IVA integration. Voice-enabled assistants are gaining popularity in mobile-first consumer segments. Localized language support is becoming a critical factor for market penetration. Governments and enterprises invest in AI-driven tools to enhance citizen services and optimize internal workflows.
Middle East
The Middle East Intelligent Virtual Assistant (IVA) Market size was valued at USD 71.75 million in 2018 to USD 143.24 million in 2024 and is anticipated to reach USD 747.66 million by 2032, at a CAGR of 23.0% during the forecast period. The region accounted for 3.9% of the global market share in 2024. Countries like the UAE and Saudi Arabia lead investments in AI and digital services. IVA adoption is expanding across smart city projects, banking, and healthcare. Governments use virtual assistants to offer 24/7 multilingual access to public services. Enterprises deploy IVAs to modernize call centers and reduce customer wait times. Integration of smart speakers and chatbots into consumer electronics is also on the rise. Businesses in the region prioritize automation for operational efficiency and user satisfaction. Strategic investments support the development of localized AI tools for Arabic-speaking users.
Africa
The Africa Intelligent Virtual Assistant (IVA) Market size was valued at USD 44.27 million in 2018 to USD 119.15 million in 2024 and is anticipated to reach USD 599.93 million by 2032, at a CAGR of 22.0% during the forecast period. Africa contributed 3.2% of the global market share in 2024. The market is growing steadily, supported by mobile-first digital adoption and rising demand for scalable communication solutions. South Africa, Egypt, and Nigeria are key countries driving IVA implementation. Local businesses use IVAs to handle customer interactions across banking, telecom, and healthcare. Voice-based assistants address language and literacy barriers in underserved regions. It enables faster access to essential services and improves user engagement. International companies are entering the market through partnerships and cloud-based IVA solutions. Investment in AI infrastructure and digital skills is gradually improving the adoption landscape across Africa.
Shape Your Report to Specific Countries or Regions & Enjoy 30% Off!
Key Player Analysis:
- com, Inc.
- Apple Inc.
- Baidu, Inc.
- Clara Labs
- CSS Corp.
- Creative Virtual
- CodeBaby Corp.
- eGain Corp.
- Google Inc.
- IBM Corporation
- Kognito
- Microsoft Corp.
- MedRespond
- Next IT Corp.
- Nuance Communications, Inc.
- Oracle Corp.
- True Image Interactive, Inc.
Competitive Analysis:
The Intelligent Virtual Assistant (IVA) Market features intense competition among global technology leaders focused on AI-driven conversational platforms. Companies like Amazon, Apple, Google, Microsoft, and IBM maintain dominant positions through continuous product innovation and ecosystem integration. It witnesses active participation from emerging players such as Clara Labs, Creative Virtual, and eGain Corp., which offer specialized solutions for enterprise automation. Market participants prioritize AI enhancements, multilingual capabilities, and cross-platform deployment to differentiate their offerings. Strategic partnerships, acquisitions, and product upgrades remain central to expansion strategies. Amazon’s Alexa and Apple’s Siri lead in consumer environments, while Microsoft and IBM focus on enterprise and hybrid AI applications. It reflects rapid innovation cycles and a strong emphasis on natural language processing, emotional intelligence, and cloud-based scalability. Companies invest in user personalization and privacy-compliant solutions to build customer trust and retain market share. Competitive dynamics continue to evolve with the rise of generative AI and voice-first applications.
Recent Developments:
- In July 2025, Amazon announced the acquisition of Bee, a San Francisco-based startup that produces an AI-powered wearable wristband priced at about $50. This device listens to conversations, transcribes them, and provides users with summaries, to-do lists, and daily reminders. This acquisition reflects Amazon’s strategic expansion into wearable AI technology, distinct from its existing Alexa voice assistant products.
Market Concentration & Characteristics:
The Intelligent Virtual Assistant (IVA) Market exhibits moderate to high market concentration, with a few major players dominating global revenue share. It is characterized by rapid technological evolution, strong emphasis on AI and NLP integration, and growing cross-industry deployment. Leading firms invest in proprietary platforms and cloud-based infrastructure to ensure scalability and real-time responsiveness. The market shows a mix of consumer-focused and enterprise-grade solutions, supporting diverse applications from smart homes to customer service automation. It favors companies with extensive R&D capabilities and strong distribution networks. High entry barriers stem from technological complexity, data privacy requirements, and the need for continuous updates. Voice-enabled interfaces and multilingual support remain key product features shaping competition and user adoption.
Report Coverage:
The research report offers an in-depth analysis based on Product, Application, and Technology. It details leading market players, providing an overview of their business, product offerings, investments, revenue streams, and key applications. Additionally, the report includes insights into the competitive environment, SWOT analysis, current market trends, as well as the primary drivers and constraints. Furthermore, it discusses various factors that have driven market expansion in recent years. The report also explores market dynamics, regulatory scenarios, and technological advancements that are shaping the industry. It assesses the impact of external factors and global economic changes on market growth. Lastly, it provides strategic recommendations for new entrants and established companies to navigate the complexities of the market.
Future Outlook:
- The Intelligent Virtual Assistant (IVA) Market will expand with deeper enterprise integration across operations and customer service.
- Demand for personalized, context-aware interactions will drive investments in advanced NLP and AI models.
- Growth in voice commerce will increase adoption of voice-enabled assistants in retail and e-commerce platforms.
- Integration with IoT and smart home ecosystems will enhance real-time, multi-device user experiences.
- Healthcare providers will adopt IVA tools for patient engagement, triage, and remote care support.
- Multilingual and regional language capabilities will support market penetration in non-English-speaking regions.
- Automotive manufacturers will integrate IVAs for voice-controlled navigation, infotainment, and safety functions.
- Educational institutions will utilize IVA platforms to automate student support and content delivery.
- Cloud-native and API-driven IVA platforms will enable faster deployment and scalability for SMEs.
- Regulatory focus on data privacy and ethical AI will influence product design and deployment strategies.


