
Market Overview:
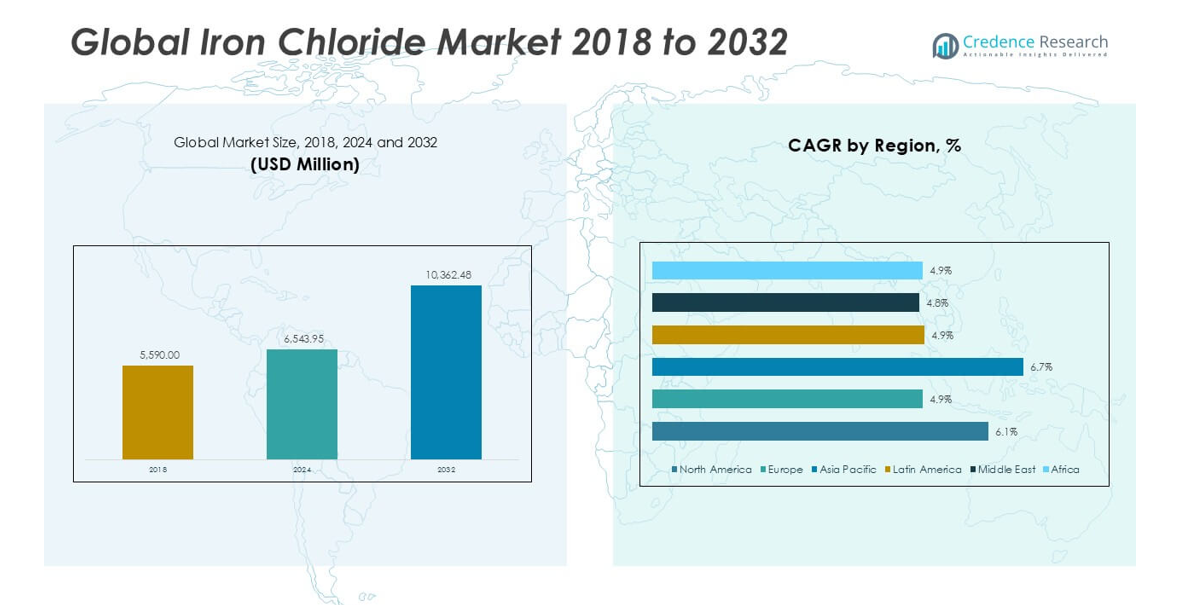
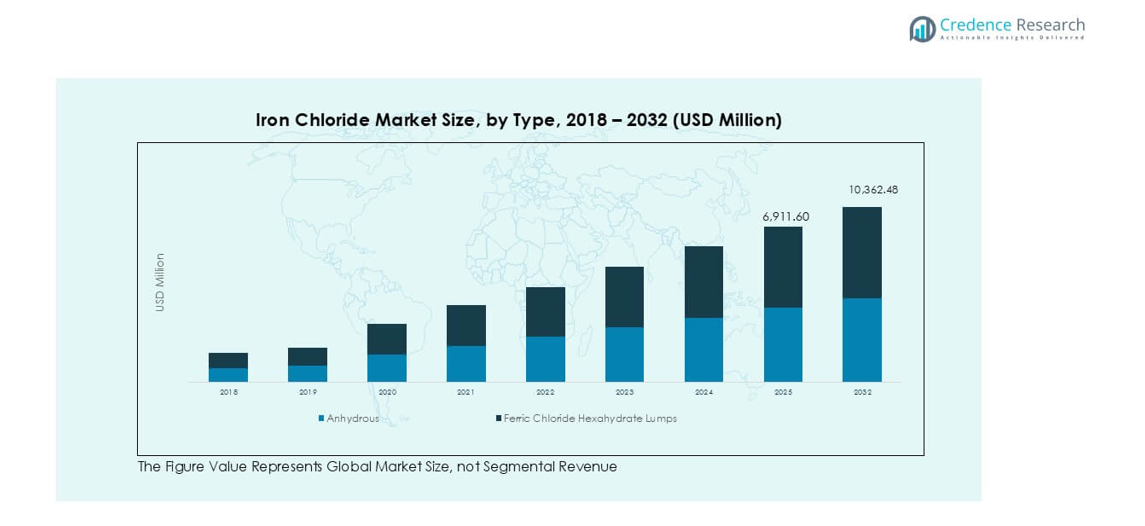
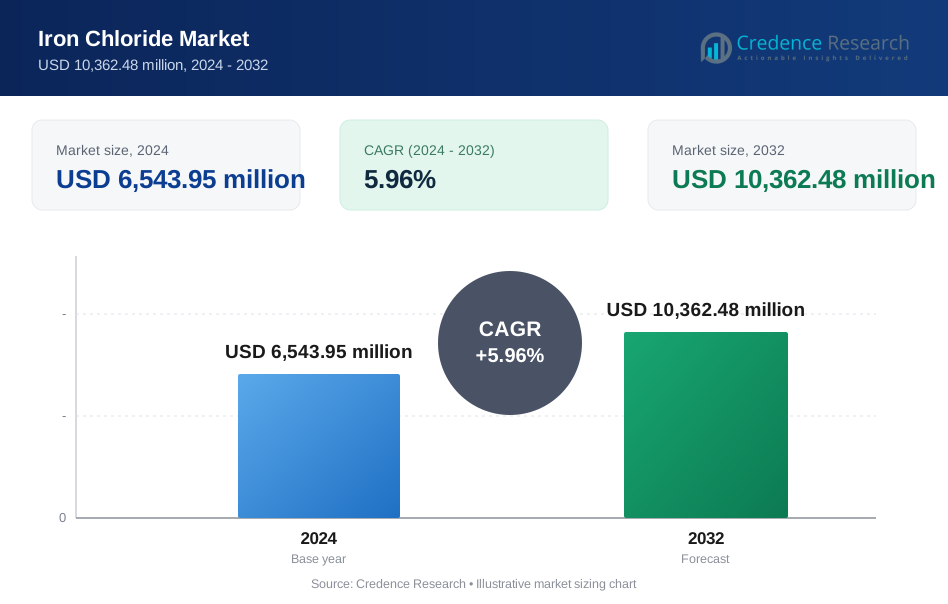
The Iron Chloride market size was valued at USD 5,590.0 million in 2018, increasing to USD 6,543.95 million in 2024, and is anticipated to reach USD 10,362.48 million by 2032, at a CAGR of 5.96% during the forecast period.
| REPORT ATTRIBUTE | DETAILS |
|---|---|
| Historical Period | 2020-2023 |
| Base Year | 2024 |
| Forecast Period | 2025-2032 |
| Iron Chloride Market Size 2024 | USD 6,543.95 million |
| Iron Chloride Market, CAGR | 5.96% |
| Iron Chloride Market Size 2032 | SD 10,362.48 million |
The iron chloride market is shaped by prominent players such as Kemira Oyj, BASF SE, Akzo Nobel N.V., Chemifloc Limited, PVS Chemicals Inc., Tessenderlo Group, BorsodChem, and Gujarat Alkalies and Chemicals Ltd. These companies maintain leadership through strong portfolios in water and wastewater treatment, pigments, and electronics etchants, supported by global supply chains and regional production bases. Asia Pacific leads the market with 41% share in 2024, driven by rapid industrialization, urbanization, and expanding municipal water treatment projects. North America follows with 26% share, supported by advanced infrastructure and strict environmental regulations, while Europe holds 20%, reflecting steady demand across industrial and municipal segments.
Market Insights
- The global iron chloride market was valued at USD 5,590.0 million in 2018, reached USD 6,543.95 million in 2024, and is projected to hit USD 10,362.48 million by 2032, growing at a CAGR of 5.96%.
- Demand is strongly driven by rising investments in water and wastewater treatment, where ferric chloride liquid dominates with over 60% share due to its cost-effectiveness and easy application.
- Key trends include the shift toward eco-friendly treatment solutions, increasing use in PCB manufacturing, and growth in pigment applications for construction and coatings.
- The market is moderately consolidated, with leading players such as Kemira Oyj, BASF SE, Akzo Nobel N.V., and PVS Chemicals Inc. expanding through partnerships, capacity additions, and sustainable product innovation.
- Asia Pacific holds 41% share in 2024, followed by North America at 26% and Europe at 20%, with wastewater treatment accounting for 45% share by application.
Market Segmentation Analysis:
By Grade
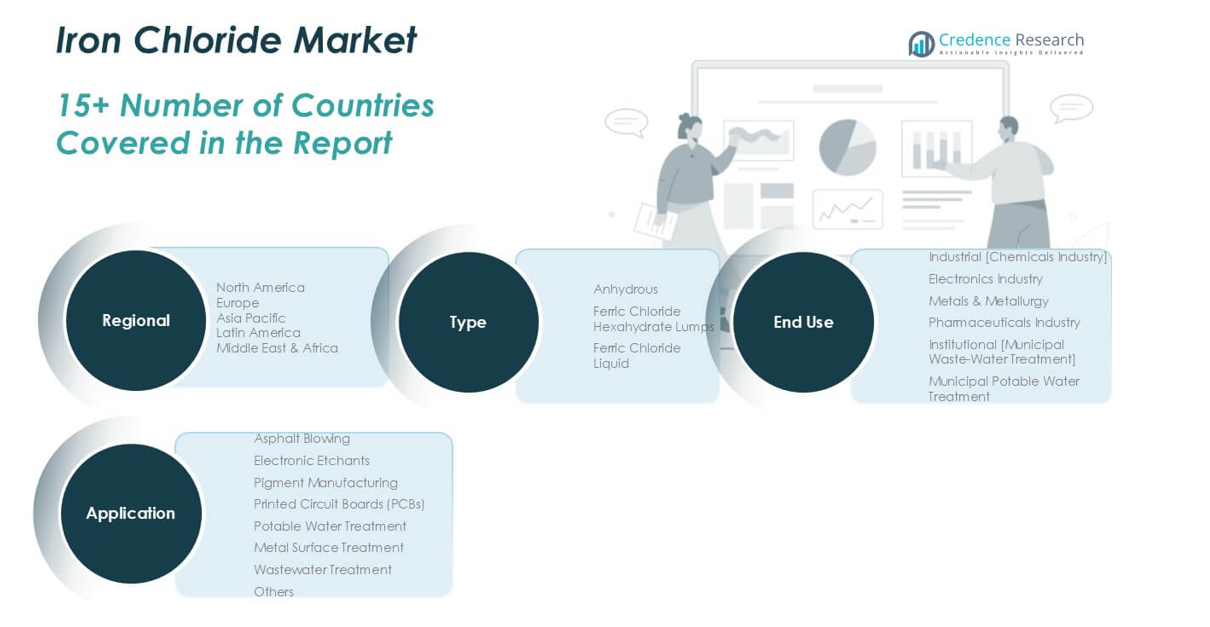
The iron chloride market by grade is segmented into anhydrous, ferric chloride hexahydrate lumps, and ferric chloride liquid. Among these, ferric chloride liquid dominates with over 60% share in 2024, driven by its extensive use in water and wastewater treatment plants. Its solubility, cost-effectiveness, and easy handling make it the preferred choice for large-scale municipal and industrial applications. The demand for anhydrous and hexahydrate lumps remains steady, supported by niche uses in metallurgy, pigment manufacturing, and electronics. Growth in environmental regulations further strengthens the adoption of liquid ferric chloride across regions.
- For instance, in 2023, Kemira Oyj supplied substantial quantities of ferric chloride and other water treatment chemicals to municipal facilities across Europe, in line with its role as a leading provider of sustainable chemical solutions for water-intensive industries.
By Application
In application segmentation, wastewater treatment leads with nearly 45% share in 2024, reflecting its critical role in industrial effluent and municipal sewage treatment. Rising concerns over water pollution and stricter discharge standards are driving adoption worldwide. Potable water treatment also represents a significant share, with growing demand from municipalities to ensure clean water supply. Other applications, including pigment manufacturing, asphalt blowing, PCBs, and metal surface treatment, add consistent revenue streams. Increasing investments in electronics manufacturing and urban infrastructure projects are expected to enhance demand across both traditional and emerging applications.
- For instance, in 2023, Kemira Oyj supplied substantial quantities of ferric chloride and other water treatment chemicals to municipal facilities across Europe, in line with its role as a leading provider of sustainable chemical solutions for water-intensive industries.
By End-use
The end-use segmentation highlights the dominance of institutional wastewater treatment, holding close to 38% share in 2024. The segment benefits from rising municipal investments in water treatment facilities and compliance with environmental norms. Industrial applications within the chemicals industry also show strong demand, as iron chloride is widely used in pigment, dye, and catalyst production. The electronics sector further supports growth through applications in PCB etching and surface preparation. Municipal potable water treatment continues to expand steadily, reflecting population growth and government spending on safe drinking water initiatives.
Market Overview
Rising Demand for Water and Wastewater Treatment
The growing need for clean water is a major driver of the iron chloride market. Municipalities and industries are increasingly adopting ferric chloride in both potable water and wastewater treatment facilities. Its ability to act as a strong coagulant helps in removing impurities and controlling odor, making it a preferred solution. Rapid urbanization, coupled with stringent government regulations on effluent discharge, continues to accelerate adoption. In 2024, wastewater treatment applications accounted for nearly 45% of market share, underscoring their dominance. Expanding industrial clusters, particularly in Asia-Pacific, and increased investment in municipal water treatment projects ensure consistent demand growth through 2032.
- For instance, Kemira Oyj is a significant supplier of water treatment chemicals for municipal and industrial customers in Finland, Sweden, and other parts of Europe.
Expansion in Electronics and PCB Manufacturing
The electronics sector is emerging as a strong growth driver, with iron chloride playing a crucial role in etching printed circuit boards (PCBs). The global expansion of semiconductor fabrication and rising demand for consumer electronics have created steady requirements for high-purity ferric chloride. PCB manufacturing is particularly vital in Asia-Pacific, where countries like China, South Korea, and Taiwan dominate electronics production. As 5G rollout and IoT-enabled devices scale globally, the reliance on PCBs intensifies, further boosting demand. Continuous innovation in miniaturized and multi-layered circuit boards is also increasing the need for reliable etching agents, positioning iron chloride as a key enabler in this sector.
- For instance, BorsodChem is a chemical manufacturer in Hungary that produces ferric chloride, which is used in the electronics industry for printed circuit board (PCB) etching.
Growth of Chemical and Pigment Manufacturing
Iron chloride remains a critical raw material in pigment and dye production, making chemical industry demand a key growth driver. Pigments derived from iron chloride are widely used in paints, coatings, plastics, and textiles. Rising construction activity and infrastructure projects are fueling the consumption of paints and coatings, indirectly expanding iron chloride demand. In addition, regulatory pressure to adopt eco-friendly formulations is encouraging industries to rely on iron-based alternatives instead of heavy-metal pigments. The chemical industry accounted for a significant share of industrial end-use in 2024, and growing urbanization across emerging markets is expected to sustain strong growth through 2032.
Key Trends & Opportunities
Increasing Shift Toward Eco-Friendly Water Treatment Solutions
A clear trend shaping the iron chloride market is the shift toward sustainable and eco-friendly water treatment methods. Ferric chloride is gaining prominence as an alternative to aluminum-based coagulants due to better sludge handling and lower environmental impact. Growing awareness of safe drinking water and pressure to meet global sustainability goals are pushing municipalities and industries to expand iron chloride adoption. This shift opens opportunities for suppliers to develop advanced grades, such as high-purity ferric chloride liquids, to cater to both municipal and industrial buyers seeking green solutions.
- For instance, Kemira Oyj launched a ferric chloride grade in 2022 that reduced sludge volume by 15,000 tons per year across Finnish water treatment plants, supporting circular waste management targets.
Rising Investments in Infrastructure and Urban Development
Large-scale investments in urban infrastructure projects present new opportunities for iron chloride suppliers. Road construction, real estate development, and public works create strong demand for pigments, asphalt blowing, and water treatment applications. Emerging economies in Asia-Pacific, Africa, and the Middle East are particularly expanding public infrastructure spending, which strengthens downstream demand. With construction materials requiring iron-derived pigments and urban centers needing enhanced water treatment capacity, suppliers can tap into diversified growth opportunities across multiple applications in the next decade.
Key Challenges
Corrosive Nature and Handling Limitations
The highly corrosive nature of iron chloride presents a significant operational challenge. Its storage, transport, and handling require specialized equipment and safety protocols, which increase overall costs for end-users. Small and mid-scale industries often struggle with additional infrastructure investment to handle ferric chloride safely. Corrosion-related risks also limit adoption in some sensitive applications, pushing buyers to consider substitutes. This restricts the broader penetration of iron chloride in industries that seek safer and lower-maintenance alternatives.
Volatility in Raw Material Prices
The production of iron chloride relies heavily on the availability and cost of raw materials such as scrap iron and chlorine. Price fluctuations in these inputs create volatility in supply and profitability for manufacturers. Global trade dynamics, energy prices, and regional supply shortages often disrupt production economics. For instance, rising energy costs significantly increase chlorination process expenses. Such price volatility challenges producers in maintaining competitive pricing, especially in price-sensitive markets in Asia and Africa, creating uncertainty for long-term supply contracts.
Regional Analysis
North America
North America accounted for 26% share of the global iron chloride market in 2024, with a market size of USD 1,729.07 million, up from USD 1,498.12 million in 2018. The region is projected to reach USD 2,756.99 million by 2032, expanding at a CAGR of 6.1%. Growth is driven by robust wastewater treatment investments, strong industrial output, and regulatory compliance in potable water treatment. The U.S. leads regional demand due to advanced municipal infrastructure and electronics manufacturing, while Canada contributes through expanding urban water treatment initiatives. Industrial end-use remains a key revenue driver across the region.
Europe
Europe represented a 20% share of the iron chloride market in 2024, valued at USD 1,326.93 million, rising from USD 1,190.67 million in 2018. By 2032, the market is expected to reach USD 1,935.43 million, growing at a CAGR of 4.9%. Strict environmental policies and EU directives on water quality fuel adoption across municipal and industrial wastewater treatment. Germany, France, and the U.K. remain core markets with high demand in chemicals and metallurgy. While growth is moderate compared to Asia-Pacific, the region benefits from technological advances and a shift toward sustainable water treatment solutions.
Asia Pacific
Asia Pacific dominated the global market with 41% share in 2024, valued at USD 2,696.41 million, up from USD 2,242.71 million in 2018. The market is forecasted to reach USD 4,519.27 million by 2032, at the highest regional CAGR of 6.7%. Rapid industrialization, urbanization, and growing municipal investments in water treatment drive strong demand. China and India are key contributors, supported by expanding electronics manufacturing and large-scale wastewater treatment infrastructure. The chemical and metallurgy sectors also generate significant demand. Rising environmental regulations and government-backed urban development initiatives continue to strengthen the region’s leading position.
Latin America
Latin America accounted for 5% of global iron chloride demand in 2024, valued at USD 329.75 million, compared with USD 285.09 million in 2018. The market is projected to reach USD 480.51 million by 2032, expanding at a CAGR of 4.9%. Brazil and Mexico lead consumption due to rising demand for potable water treatment and chemical processing. Government-led projects to upgrade urban infrastructure and tackle industrial pollution are driving adoption. While growth remains steady, limited investments in advanced manufacturing constrain broader expansion. Nevertheless, increasing environmental awareness and industrial activity create stable long-term opportunities in the region.
Middle East
The Middle East represented 3% of the global iron chloride market in 2024, with a value of USD 226.38 million, rising from USD 206.83 million in 2018. By 2032, the market is expected to reach USD 327.39 million, at a CAGR of 4.8%. Regional demand is strongly influenced by large-scale desalination and potable water treatment projects, particularly in Saudi Arabia and the UAE. Expansion of the construction and chemical industries also adds momentum. However, growth is moderated by limited electronics manufacturing activity. Increasing investments in sustainable water management continue to support steady adoption across municipal applications.
Africa
Africa contributed 5% share of the market in 2024, valued at USD 235.41 million, up from USD 166.58 million in 2018. The region is anticipated to reach USD 342.90 million by 2032, expanding at a CAGR of 4.9%. Rising urbanization, coupled with urgent needs for wastewater and potable water treatment, fuels demand across key economies such as South Africa, Nigeria, and Egypt. However, infrastructure gaps and limited industrial capacity constrain faster adoption. Municipal projects, often supported by international funding and government initiatives, drive most consumption. Growing awareness of water quality standards presents long-term opportunities despite current structural challenges.
Market Segmentations:
By Grade
- Anhydrous
- Ferric Chloride Hexahydrate Lumps
- Ferric Chloride Liquid
By Application
- Asphalt Blowing
- Electronic Etchants
- Pigment Manufacturing
- Printed Circuit Boards (PCBs)
- Potable Water Treatment
- Metal Surface Treatment
- Wastewater Treatment
- Others
By End-use
- Industrial (Chemicals Industry)
- Electronics Industry
- Metals & Metallurgy
- Pharmaceuticals Industry
- Institutional (Municipal Waste-Water Treatment)
- Municipal Potable Water Treatment
By Geography
- North America
- U.S.
- Canada
- Mexico
- Europe
- UK
- France
- Germany
- Italy
- Spain
- Russia
- Belgium
- Netherlands
- Austria
- Sweden
- Poland
- Denmark
- Switzerland
- Rest of Europe
- Asia Pacific
- China
- Japan
- South Korea
- India
- Australia
- Thailand
- Indonesia
- Vietnam
- Malaysia
- Philippines
- Taiwan
- Rest of Asia Pacific
- Latin America
- Brazil
- Argentina
- Peru
- Chile
- Colombia
- Rest of Latin America
- Middle East
- UAE
- KSA
- Israel
- Turkey
- Iran
- Rest of Middle East
- Africa
- Egypt
- Nigeria
- Algeria
- Morocco
- Rest of Africa
Competitive Landscape
The iron chloride market is moderately consolidated, with global and regional players competing on product quality, pricing, and service capabilities. Leading companies such as Kemira Oyj, BASF SE, Akzo Nobel N.V., Chemifloc Limited, and PVS Chemicals Inc. dominate through extensive product portfolios and established distribution networks. These firms focus on water and wastewater treatment chemicals, securing long-term contracts with municipalities and industries. Regional players, including Gujarat Alkalies and Chemicals Ltd., Malay-Sino Chemical Industries, and Sidra Chemicals, strengthen competition by offering cost-effective solutions tailored to local needs. Strategic initiatives include capacity expansions, technological advancements in high-purity ferric chloride, and partnerships with utility providers to enhance market penetration. Recent developments highlight increased investments in sustainable water treatment applications, reflecting growing regulatory pressure. The landscape is further shaped by mid-sized companies such as Tessenderlo Group, BorsodChem, and Phoenix Chemicals, which target niche applications in pigments, metallurgy, and electronics, ensuring diversified growth across end-use segments.
Key Player Analysis
- Kemira Oyj
- BASF SE
- Akzo Nobel N.V.
- Chemifloc Limited
- PVS Chemicals Inc.
- Tessenderlo Group
- BorsodChem
- Gujarat Alkalies and Chemicals Ltd.
- Malay-Sino Chemical Industries Sdn. Bhd.
- Sukha Chemical Industries
- Phoenix Chemicals
- Sidra Chemicals
- Arjun Chemicals
- Shandong Haohua Tire Co., Ltd.
Recent Developments
- In May 2025, Tessenderlo Group entered a strategic partnership with Darling Ingredients Inc. to form a new joint venture called Nextida™, which will combine the collagen and gelatin segments of both companies. While this partnership is primarily focused on health, wellness, and nutrition products, it reflects Tessenderlo’s ongoing strategy of leveraging synergies and expanding its specialty chemicals portfolio.
- In March 2025, Gulbrandsen Technologies LLC announced its plans to build additional polyethylene wax manufacturing capacity and a new functional polymers plant at its Dahej, India site. While this expansion is not specific to iron chloride, it demonstrates Gulbrandsen’s commitment to increasing specialty chemical production and supply reliability globally.
- In Feb 2025, Kemira completed the acquisition of Thatcher Group’s iron sulfate coagulant business in the East Coast region of the United States, strengthening its water treatment portfolio and expanding its customer base in North America
Report Coverage
The research report offers an in-depth analysis based on Grade, Application, End-use and Geography. It details leading market players, providing an overview of their business, product offerings, investments, revenue streams, and key applications. Additionally, the report includes insights into the competitive environment, SWOT analysis, current market trends, as well as the primary drivers and constraints. Furthermore, it discusses various factors that have driven market expansion in recent years. The report also explores market dynamics, regulatory scenarios, and technological advancements that are shaping the industry. It assesses the impact of external factors and global economic changes on market growth. Lastly, it provides strategic recommendations for new entrants and established companies to navigate the complexities of the market.
Future Outlook
- The iron chloride market will grow steadily, supported by stricter water treatment regulations worldwide.
- Ferric chloride liquid will remain the leading grade due to its high adoption in municipal treatment.
- Wastewater treatment will continue to dominate application share, driven by industrial effluent control needs.
- PCB manufacturing demand will rise as electronics and semiconductor industries expand globally.
- Pigment manufacturing will experience consistent growth, fueled by construction and coatings demand.
- Asia Pacific will remain the largest regional market with strong industrialization and urbanization trends.
- North America will sustain growth, supported by advanced municipal water treatment infrastructure.
- Europe will see moderate expansion, guided by EU environmental directives and sustainable water policies.
- Leading companies will invest in sustainable and high-purity iron chloride products to stay competitive.
- Emerging markets in Latin America, Middle East, and Africa will offer new opportunities through urban infrastructure projects.
Request a Free Sample
Fill in your details and we'll send you a free sample report.
- Sample data tables & charts
- Research methodology
Need a Custom Version of This Report?
Tailor the scope, geography, or segments to your exact requirements.
- Custom geography or segment scope
- Direct access to our analyst team
Frequently Asked Questions
What is the current size of the Iron Chloride Market?
What factors are driving the growth of the Iron Chloride Market?
What are the key segments within the Iron Chloride Market?
What are some challenges faced by the Iron Chloride Market?
Who are the major players in the Iron Chloride Market?
Table of Content
Chapter 1. Report Introduction
- 1.1 Report Description & Purpose
- 1.1.1 Report Title & Market Definition
- 1.1.2 Unique Selling Propositions (USP) & Key Differentiators
- 1.1.3 Value Proposition for Stakeholders
- 1.2 Research Objectives
- 1.2.1 Market Sizing Objectives (Volume & Revenue) (Volume Where Applicable)
- 1.2.2 Segmentation Objectives
- 1.2.3 Competitive Intelligence Objectives
- 1.2.4 Forecast & Scenario Objectives
- 1.3 Report Scope
- 1.3.1 Iron Chloride Scope – Segments & Subsegments Covered
- 1.3.2 Geographic Scope – Regions & Countries Covered
- 1.3.3 Historical Period, Base Year & Forecast Period (2024; forecast to 2032)
- 1.3.4 Inclusions & Exclusions
- 1.4 Industry Classification & Applicable Codes
- 1.5 Currency, Measurement Units & Valuation Basis
- 1.6 Target Stakeholders
- 1.7 Limitations & Assumptions
Chapter 2. Executive Summary
- 2.1 Global Iron Chloride Market Snapshot
- 2.1.1 Market Size – Historical (2024) & Forecast (2024-2032) (2024: USD 6,543.95 million → 2032: USD 10,362.48 million)
- 2.1.2 Volume & Revenue – Global Totals (Volume Where Applicable)
- 2.1.3 Key Market Highlights – Top Five Facts
- 2.2 Iron Chloride Market Segmentation Snapshot
- 2.2.1 Market Split by Region – 2024 vs. 2032
- 2.3 Competitive Snapshot
- 2.3.1 Top 10 Players by Revenue Share – 2024
- 2.3.2 Top 10 Players by Volume Share – 2024 (Volume Where Applicable)
- 2.3.3 Recent Strategic Developments (18-Month Summary)
- 2.4 Key Investment Highlights & Strategic Conclusions
Chapter 3. Iron Chloride Market Dynamics & Industry Analysis
- 3.1 Market Overview & Context
- 3.1.1 Iron Chloride Market Position in the Broader Industry Value Chain
- 3.1.2 Demand Structure & Purchasing Dynamics
- 3.1.3 Market Maturity & Development Stage by Region
- 3.2 Iron Chloride Market Drivers
- 3.3 Iron Chloride Market Restraints & Challenges
- 3.4 Iron Chloride Market Opportunities
- 3.5 Porter's Five Forces Analysis
- 3.5.1 Threat of New Entrants
- 3.5.2 Bargaining Power of Suppliers
- 3.5.3 Bargaining Power of Buyers
- 3.5.4 Threat of Substitutes
- 3.5.5 Competitive Rivalry – Intensity Assessment
- 3.6 Iron Chloride Value Chain Analysis
- 3.6.1 Upstream – Key Inputs, Resources & Suppliers
- 3.6.1.1 Key Input/Resource 1
- 3.6.1.2 Key Input/Resource 2
- 3.6.1.3 Key Input/Resource 3
- 3.6.2 Midstream – Core Operations & Value Creation
- 3.6.2.1 Operating Model & Process Overview
- 3.6.2.2 Key Operating Locations & Capabilities by Company
- 3.6.3 Downstream – Market Channels & End Users
- 3.6.3.1 Direct Sales & Customer Engagement Channels
- 3.6.3.2 Indirect Sales, Intermediaries & Partner Channels
- 3.6.4 Value Chain Profitability Analysis
- 3.6.1 Upstream – Key Inputs, Resources & Suppliers
- 3.7 PESTEL Analysis
- 3.7.1 Political Factors
- 3.7.2 Economic Factors
- 3.7.3 Social Factors
- 3.7.4 Technological Factors
- 3.7.5 Environmental Factors
- 3.7.6 Legal Factors
- 3.8 Iron Chloride Supply Chain Analysis
- 3.8.1 Critical Input & Resource Availability Risk Assessment
- 3.8.2 Supplier & Operational Concentration Risk (Geographic Exposure)
- 3.8.3 Supply & Service Disruption Impact Analysis
- 3.9 Regulatory & Policy Landscape
Note: The regulatory and policy landscape section covers regulations based on their applicability to the market, Iron Chloride category, geography, and scope of the study. Only regulatory frameworks with a material impact on operations, compliance, trade, sustainability, or market access are analyzed in detail.
Chapter 4. Key Investment Pockets & Opportunity Analysis
- 4.1 Iron Chloride Market Attractiveness Analysis
- 4.1.1 By Region – Investment Attractiveness Matrix (Market Size × CAGR)
- 4.2 Absolute Revenue Growth Opportunity
- 4.2.1 By Region – Absolute Revenue Growth Through 2032
- 4.3 Incremental Demand Opportunity
- 4.3.1 By Region – Incremental Demand Through 2032
- 4.3.2 Segment – Incremental Demand
- 4.4 Emerging Submarket Opportunity Deep Dive (Subject to Applicability)
- 4.5 Priority Market Opportunity Scorecards
- 4.5.1 United States
- 4.5.2 Europe
- 4.5.3 Asia
- 4.5.4 Middle East & Africa
Note: Priority market opportunity scorecards reflect the geographic scope and strategic relevance of the study. Listed markets are indicative and may be adapted to the industry.
Chapter 5. Iron Chloride Cross-Border Trade & Market Access Analysis
- 5.1 International Trade & Cross-Border Activity Overview
- 5.1.1 Global Export Value by Country (2024)
- 5.1.2 Global Export Volume by Country (2024) (Volume Where Applicable)
- 5.1.3 Global Import Value by Country (2024)
- 5.1.4 Global Import Volume by Country (2024) (Volume Where Applicable)
- 5.1.5 Net Trade Balance by Country (2024)
- 5.2 Export Analysis – Segment
- 5.2.1 Category 1 (Applicable Classification Code)
- 5.2.2 Category 2 (Applicable Classification Code)
- 5.2.3 Category 3 (Applicable Classification Code)
- 5.2.4 Category 4 (Applicable Classification Code)
- 5.2.5 Category 5 (Applicable Classification Code)
- 5.3 Import Analysis – Segment
- 5.3.1 Category 1 (Applicable Classification Code)
- 5.3.2 Category 2 (Applicable Classification Code)
- 5.3.3 Category 3 (Applicable Classification Code)
- 5.3.4 Category 4 (Applicable Classification Code)
- 5.3.5 Category 5 (Applicable Classification Code)
- 5.4 Cross-Border Pricing & Transaction Benchmarks
- 5.4.1 Export Pricing – Segment & Country
- 5.4.2 Import Pricing – Segment & Source Country
- 5.4.3 Price Trends (2024)
- 5.5 Key Cross-Border Trade & Delivery Routes
- 5.5.1 Cross-Border Trade/Delivery Route 1
- 5.5.2 Cross-Border Trade/Delivery Route 2
- 5.5.3 Cross-Border Trade/Delivery Route 3
- 5.5.4 Cross-Border Trade/Delivery Route 4
- 5.5.5 Cross-Border Trade/Delivery Route 5
- 5.6 Trade Policy & Market Access Impact Assessment
- 5.6.1 Tariff & Non-Tariff Barriers
- 5.6.2 Regional Trade & Economic Integration Frameworks
- 5.6.3 Bilateral & Multilateral Trade Agreements
- 5.6.4 Cross-Border Operating, Licensing & Localization Requirements
Note: This chapter applies where cross-border trade or delivery is relevant to Iron Chloride. Goods, services, and digital offerings are assessed using applicable classifications and transaction measures. Import-export volumes, trade balances, and route analyses are included only where meaningful to the market.
Chapter 6. Competitive Landscape & Company Benchmarking
- 6.1 Iron Chloride Market Concentration & Structure
- 6.1.1 Herfindahl-Hirschman Index (HHI) – vs. 2024
- 6.1.2 Leading, Mid-Sized & Emerging Player Structure
- 6.1.3 Global, Regional & Local Player Dynamics
- 6.2 Iron Chloride Market Share Analysis – 2024
- 6.2.1 Global Revenue Share by Company
- 6.2.2 Global Volume Share by Company (Volume Where Applicable)
- 6.2.3 Regional Revenue Share
- 6.2.4 Market Share Evolution ( vs. 2024)
- 6.2.5 Company Market Share by Key Segment
- 6.2.6 Company Market Share by Customer Group
- 6.3 Operating Scale, Capacity & Infrastructure Analysis
- 6.3.1 Global Operating Scale & Supply Capacity
- 6.3.2 Resource Utilization & Operating Efficiency
- 6.3.3 Output, Service Delivery & Activity Metrics
- 6.3.4 Operating Footprint & Infrastructure Map
- 6.3.5 Planned Operational & Capacity Expansion
- 6.4 Iron Chloride Competitive Benchmarking Matrix
- 6.4.1 Revenue, Growth, Profitability & Operating Metric Comparison
- 6.4.2 Channel Revenue Mix
- 6.4.3 Geographic Revenue Exposure
- 6.4.4 R&D Intensity
- 6.4.5 Sustainability Maturity
- 6.5 Strategic Developments in Iron Chloride (Last 24 Months)
- 6.5.1 Mergers, Acquisitions & Divestments
- 6.5.2 New Products, Services & Solutions in Iron Chloride
- 6.5.3 Operational & Infrastructure Expansions
- 6.5.4 Strategic Alliances, Joint Ventures & Partnerships
- 6.5.5 Distribution Expansion & Market Entry
- 6.5.6 Sustainability & ESG Initiatives
- 6.6 Competitive Strategy Mapping
- 6.6.1 Leader, Challenger, Follower & Niche Classification
- 6.6.2 Pricing Strategy Comparison
- 6.6.3 Channel Strategy Matrix
Note: Strategic developments are included based on their materiality and the availability of reliable information.
Chapter 7. Global Iron Chloride Market – By Sales & Delivery Channel
- 7.1 Segment Overview
- 7.1.1 Volume & Revenue Split by Channel (2024 & 2032) (Volume Where Applicable)
- 7.1.2 Channel Mix Evolution (2024-2032)
Chapter 8. Regional Market Analysis – Global Overview
- 8.1 Global Regional Overview
- 8.1.1 Regional Volume Share (Volume Where Applicable)
- 8.1.2 Regional Revenue Share
- 8.1.3 Regional Volume by Region (Volume Where Applicable)
- 8.1.4 Regional Revenue by Region
- 8.1.5 Regional Forecast Through 2032
- 8.2 Cross-Regional Segment Analysis
- 8.2.1 By Sales & Delivery Channel
- 8.2.2 By Competitive Positioning & Price Tier
Chapter 9. North America Iron Chloride Market
- 9.1 United States
- 9.2 Canada
- 9.3 Mexico
Chapter 10. Europe Iron Chloride Market
- 10.1 Germany
- 10.2 France
- 10.3 Italy
- 10.4 United Kingdom
- 10.5 Spain
- 10.6 Poland
- 10.7 Russia
- 10.8 Netherlands
- 10.9 Belgium
- 10.10 Sweden
- 10.11 Denmark
- 10.12 Norway
- 10.13 Rest of Europe
Chapter 11. Asia Pacific Iron Chloride Market
- 11.1 China
- 11.2 India
- 11.3 Japan
- 11.4 South Korea
- 11.5 Thailand
- 11.6 Indonesia
- 11.7 Vietnam
- 11.8 Malaysia
- 11.9 Australia
- 11.10 Rest of Asia Pacific
Chapter 12. Latin America Iron Chloride Market
- 12.1 Brazil
- 12.2 Argentina
- 12.3 Colombia
- 12.4 Chile
- 12.5 Rest of Latin America
Chapter 13. Middle East Iron Chloride Market
- 13.1 Saudi Arabia
- 13.2 United Arab Emirates
- 13.3 Turkey
- 13.4 Israel
- 13.5 Iran
- 13.6 Rest of the Middle East
Chapter 14. Africa Iron Chloride Market
- 14.1 South Africa
- 14.2 Egypt
- 14.3 Nigeria
- 14.4 Morocco
- 14.5 Rest of Africa
Chapter 15. Iron Chloride Company Profiles
- 15.1 [Company 01]
- 15.1.1 Company Overview
- 15.1.2 Key Management Personnel
- 15.1.3 Products & Services Portfolio
- 15.1.4 Financial Performance
- 15.1.5 Key Market Focus & Geographic Presence
- 15.1.6 Recent Developments & Strategic Initiatives
Note: The company profile list is preliminary and may change based on research findings, market developments, data availability, and client requirements.
Chapter 16. Appendices
- Appendix A – List of Abbreviations & Acronyms
- Appendix B – Industry Classification Code Reference – Full Series
- Appendix C – Supply, Output & Operating Capacity Data Tables
- Appendix D – End-Use & Demand Base Tables
- Appendix E – Demand, Adoption & Usage Assumptions
- Appendix F – Pricing & Revenue Metric Reference Tables
- Appendix G – Company Operations & Infrastructure Database
- Appendix H – Cross-Border Trade & Activity Data Tables (Where Applicable)
- Appendix I – Regulatory Summary Tables
- Appendix J – Primary Research Participant List (Anonymized)
- Appendix K – Primary Research Questionnaire Framework
- Appendix L – Data Sources & Bibliography
- Appendix M – Market Size Divergence & Source Comparison
Chapter 17. Research Methodology
- 17.1 Research Framework & Philosophy
- 17.2 Secondary Research – Sources, Hierarchy & Data Extraction
- 17.3 Data Modeling – Bottom-Up & Top-Down Market Sizing
- 17.4 Primary Research – Stakeholder Framework, LOI & Sample Sizes
- 17.5 Forecast Methodology – Regression, Scenario & Sensitivity Analysis
- 17.6 Quality Control – Four-Layer Validation Framework
- 17.7 Limitations & Standard Assumptions
- 17.8 Disclaimer
