
Market Overview:
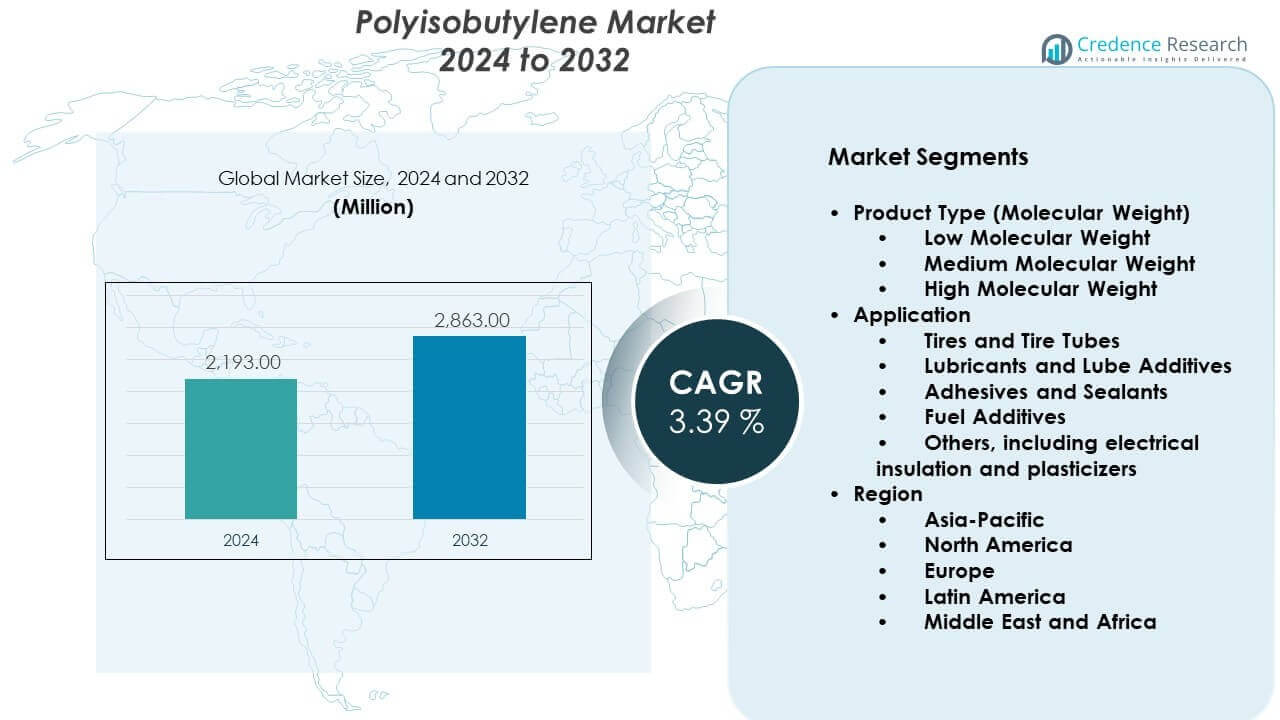
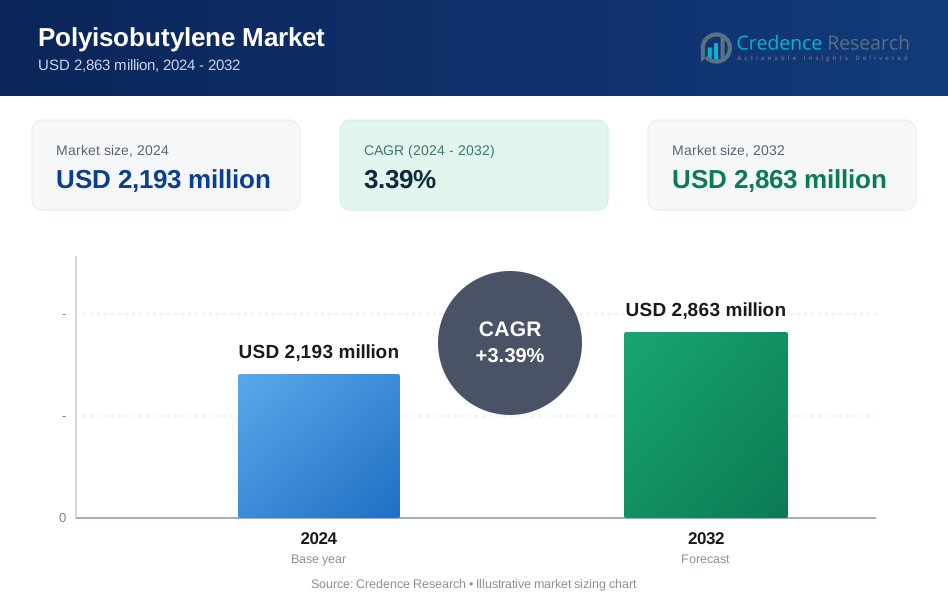
The Polyisobutylene market is projected to grow from USD 2,193 million in 2024 to USD 2,863 million by 2032. The market is expected to expand at a CAGR of 3.39% from 2024 to 2032.
| REPORT ATTRIBUTE | DETAILS |
|---|---|
| Historical Period | 2020-2023 |
| Base Year | 2024 |
| Forecast Period | 2025-2032 |
| Polyisobutylene Market Size 2024 | USD 2,193 Million |
| Polyisobutylene Market Market, CAGR | 3.39% |
| Polyisobutylene Market Size 2032 | USD 2,863 Million |
Demand rises due to strong use in automotive lubricants and fuel additives. Polyisobutylene improves viscosity control and engine protection. Growth in vehicle production supports steady consumption across regions. Construction activity also drives demand for sealants and waterproofing materials. Manufacturers favor the polymer for durability and weather resistance. Industrial growth increases usage in adhesives and elastomers. Ongoing product upgrades improve performance and processing efficiency. These factors sustain long-term demand across end-use industries.
North America and Europe lead the Polyisobutylene market due to mature automotive and construction sectors. Strong regulatory focus on fuel efficiency supports additive demand in these regions. Asia Pacific emerges as the fastest-growing region, driven by industrial expansion and rising vehicle production. China and India play key roles due to large manufacturing bases. Expanding infrastructure projects further support regional growth. Latin America and the Middle East show gradual uptake, supported by industrial development and energy-related applications.
Market Insights:
- The Polyisobutylene market was valued at USD 2,193 million in 2024 and is projected to reach USD 2,863 million by 2032, expanding at a CAGR of 3.39% during the forecast period.
- Asia-Pacific leads with about 38% share due to strong automotive and industrial manufacturing, followed by North America at 27% driven by lubricant additives demand, and Europe at 23% supported by strict automotive performance standards.
- Asia-Pacific is also the fastest-growing region, holding nearly 38% share, supported by rising vehicle production, infrastructure expansion, and cost-efficient manufacturing bases in China and India.
- By application, lubricants and lube additives account for around 42% share due to widespread use in automotive and industrial engines, while tires and tire tubes hold about 31% share driven by air retention needs.
- By product type, high molecular weight polyisobutylene represents nearly 46% share for tire and sealing uses, while medium molecular weight grades contribute about 34% due to balanced performance in lubricants and sealants.
Market Drivers:
Rising Dependence On Automotive Lubricants And Fuel Additives
The Polyisobutylene market benefits from strong demand in automotive lubricants. The polymer improves viscosity stability and engine cleanliness. Automakers prefer materials that support longer engine life. Fuel additive demand supports steady material consumption. Emission control standards push lubricant upgrades across regions. The market gains from consistent vehicle production growth. Industrial fleets also support volume demand. This driver sustains long-term material relevance.
- For instance, The Lubrizol Corporation uses polyisobutylene-based dispersants that meet API SP engine oil standards, which cap piston deposit formation under severe oxidation tests defined by ASTM sequences.
Growing Use In Construction Sealants And Waterproofing Systems
Construction activity supports rising sealant demand worldwide. Polyisobutylene offers strong moisture resistance and flexibility. Builders value durability in harsh weather conditions. The Polyisobutylene market serves roofing and glazing applications. Urban infrastructure projects raise material usage levels. Renovation projects also support repeat demand. The polymer ensures long service life in joints. Construction cycles keep demand stable.
- For instance, BASF SE states that PIB-based insulating glass sealants using Oppanol achieve service lifetimes exceeding 20 years under EN 1279 durability testing.
Expansion Of Industrial Adhesives And Elastomer Applications
Industrial manufacturing relies on high-performance bonding materials. Polyisobutylene supports strong adhesion across surfaces. Equipment makers prefer materials with chemical stability. The Polyisobutylene market aligns with industrial reliability needs. Elastomer blends improve vibration control and sealing. Factory automation supports steady adhesive consumption. Equipment maintenance cycles drive repeat use. Industrial growth strengthens demand fundamentals.
Preference For Materials With Chemical And Thermal Stability
Manufacturers prefer polymers that resist chemicals and heat. Polyisobutylene performs well under demanding conditions. The Polyisobutylene market benefits from this reliability factor. Chemical plants use the polymer in protective systems. Energy sector applications support niche demand. Stability reduces maintenance and replacement costs. Buyers favor proven material performance. This preference supports long-term adoption.
Market Trends:
Shift Toward High-Purity And Customized Polymer Grades
Producers focus on tailored polymer grades for end users. Customers seek precise molecular weight control. The Polyisobutylene market sees demand for specialized formulations. High-purity grades support sensitive industrial uses. Quality control standards gain importance across industries. Suppliers invest in process refinement. Custom grades improve customer retention. This trend raises value per unit.
- For instance, INEOS reports controlled PIB polymerization processes that deliver narrow molecular weight distributions required for fuel additive detergents meeting ISO cleanliness standards.
Increasing Focus On Performance Optimization In End Products
Manufacturers optimize formulations to enhance final product performance. Polyisobutylene supports improved elasticity and sealing strength. The Polyisobutylene market aligns with product differentiation goals. End users demand consistent material behavior. Performance benchmarking guides material selection. Suppliers provide technical support services. This trend strengthens supplier-client relationships. Value-added offerings gain traction.
- For instance, TPC Group highlights PIB elastomer use in adhesive systems that maintain flexibility across a −40°C to 100°C operating range, verified through ASTM D412 tensile testing.
Adoption Of Advanced Processing And Blending Techniques
Processing technology upgrades improve production efficiency. Polyisobutylene blends achieve better uniformity. The Polyisobutylene market benefits from improved manufacturing control. Advanced reactors support consistent output quality. Automation reduces operational variability. Producers focus on yield optimization. Processing innovation supports cost control. Technology adoption shapes competitive positioning.
Growing Integration In Multi-Component Material Systems
Industries integrate polyisobutylene into complex material systems. Hybrid formulations improve overall product performance. The Polyisobutylene market supports compatibility with other polymers. Sealant and adhesive systems benefit from synergy. Material integration reduces formulation complexity. Suppliers collaborate with compounders closely. This trend expands application scope. System-level solutions gain preference.
Market Challenges Analysis:
Exposure To Raw Material Price Volatility And Supply Risks
Raw material cost fluctuations affect pricing stability. Polyisobutylene production depends on petrochemical feedstocks. The Polyisobutylene market faces margin pressure during price swings. Supply disruptions create planning challenges for producers. Long-term contracts offer limited protection. Cost pass-through remains difficult in competitive markets. Buyers demand price consistency. Volatility complicates revenue forecasting.
Competition From Alternative Polymers And Substitute Materials
Alternative polymers compete in sealants and lubricants. Some substitutes offer lower cost options. The Polyisobutylene market faces substitution risk in price-sensitive uses. Buyers test alternative materials during cost pressure periods. Performance trade-offs influence switching decisions. Innovation remains critical to defend share. Technical differentiation helps reduce substitution. Competitive pressure remains persistent.
Market Opportunities:
Expansion In High-Growth Emerging Industrial Economies
Emerging economies invest in manufacturing and infrastructure. Polyisobutylene demand rises with industrial expansion. The Polyisobutylene market gains from rising vehicle ownership. Construction growth supports sealant consumption. Local production capacity attracts supplier interest. Cost-effective grades suit regional needs. Market entry strategies focus on partnerships. Emerging regions offer volume growth.
Product Innovation To Address Specialized And Premium Applications
Innovation opens access to premium applications. Polyisobutylene supports advanced sealing and damping uses. The Polyisobutylene market can target high-margin niches. Specialty grades serve electronics and energy sectors. Performance-focused buyers accept premium pricing. Technical collaboration drives application development. Innovation reduces competitive pressure. Value-led growth opportunities emerge.
Market Segmentation Analysis:
Product Type (Molecular Weight)
Low molecular weight polyisobutylene supports fluid control and tack properties. Manufacturers use this grade in fuel additives and plasticizers. Medium molecular weight grades balance elasticity and viscosity. The Polyisobutylene market uses this segment widely in lubricants and sealants. High molecular weight polyisobutylene offers strong elasticity and air retention. Tire and tube producers rely on this grade for durability. Chemical stability supports long service life. Each molecular class serves a defined performance need.
- For instance, BASF SE confirms that high-molecular-weight PIB in tire inner liners reduces air permeability by nearly ten times compared with natural rubber, based on standardized permeability testing.
Application
Tires and tire tubes represent a core application due to air retention properties. Lubricants and lube additives rely on polyisobutylene for viscosity control. Adhesives and sealants benefit from strong bonding and moisture resistance. The Polyisobutylene market supports fuel additives that improve engine cleanliness. Electrical insulation uses the polymer for chemical resistance. Plasticizers apply the material for flexibility enhancement. Industrial users value consistent performance. Application diversity supports stable demand.
- For instance, Braskem notes PIB-based sealant formulations used in industrial glazing maintain adhesion strength above 0.3 MPa after accelerated weathering tests defined by ISO standards.
Product And Application Alignment
Product type selection depends on end-use performance needs. Low molecular weight grades suit flow-critical uses. Medium grades serve balanced industrial formulations. High molecular weight grades meet mechanical strength demands. The Polyisobutylene market benefits from this clear alignment. Buyers select grades based on durability and stability. This structure improves supply efficiency. Segment clarity supports targeted product development.
Segmentation:
By Product Type (Molecular Weight)
- Low Molecular Weight
- Medium Molecular Weight
- High Molecular Weight
By Application
- Tires and Tire Tubes
- Lubricants and Lube Additives
- Adhesives and Sealants
- Fuel Additives
- Others, including electrical insulation and plasticizers
By Region
- North America
- U.S.
- Canada
- Mexico
- Europe
- Germany
- France
- U.K.
- Italy
- Spain
- Rest of Europe
- Asia Pacific
- China
- Japan
- India
- South Korea
- South-east Asia
- Rest of Asia Pacific
- Latin America
- Brazil
- Argentina
- Rest of Latin America
- Middle East & Africa
- GCC Countries
- South Africa
- Rest of the Middle East and Africa
Regional Analysis:
Asia-Pacific
Asia-Pacific holds the largest share of the Polyisobutylene market at nearly 38%. China leads due to strong automotive and industrial manufacturing capacity. Japan supports demand through advanced lubricant and specialty chemical production. India contributes through rising vehicle output and infrastructure growth. Tire manufacturing expansion supports consistent polymer use. Cost-efficient production attracts global suppliers. The region benefits from broad application demand.
North America
North America accounts for around 27% of the Polyisobutylene market share. The United States dominates due to strong lubricant and fuel additive demand. Automotive maintenance and aftermarket services drive steady consumption. The region favors high-quality and performance-focused polymer grades. Industrial adhesives and sealants support stable volumes. Established petrochemical infrastructure ensures supply reliability. Innovation focus strengthens competitive positioning.
Europe, Latin America, And Middle East & Africa
Europe represents nearly 23% of the Polyisobutylene market, led by Germany and France. Strict automotive standards support lubricant and sealant demand. Latin America holds about 7% share, driven by Brazil and Mexico. Industrial growth supports gradual uptake in adhesives and tires. Middle East & Africa account for roughly 5% share. Energy and construction sectors support niche demand. These regions show steady but selective growth potential.
Key Player Analysis:
Competitive Analysis:
The Polyisobutylene market shows moderate concentration with global chemical producers leading supply. Large players compete through product consistency and broad application coverage. Scale advantages support cost control and reliable supply. Technology know-how helps firms serve high-performance lubricant and tire segments. The Polyisobutylene market also reflects strong customer ties with additive and sealant producers. Product customization supports long-term contracts. Regional producers focus on price-sensitive applications. Competitive pressure remains steady across mature and emerging regions.
Recent Developments:
- TPC Group, positioned as the leading polyisobutylene producer in North America and a major global supplier, advanced its product innovation strategy with the launch of PIBplus™ in 2025. This proprietary epoxidized polyisobutylene technology represents a significant technological leap, offering enhanced reactivity and a broader chemical platform compared to conventional PIB products. PIBplus™-derived dispersants demonstrate markedly improved oxidation stability compared to traditional polyisobutylene succinimide (PIBSI) formulations, making them well-suited for modern, smaller, high-performance engines designed to maximize fuel efficiency and reduce emissions. Additionally, in December 2025, TPC Group completed its first International Sustainability and Carbon Certification (ISCC) Plus certification transaction for 1,3 Butadiene originating from its Houston operations, reflecting the company's commitment to environmental standards and responsible business practices.
- Braskem's focus within polyisobutylene markets has centered on broader sustainability initiatives rather than traditional PIB product launches. At K 2025, the world's leading trade fair for plastics and rubber held in Düsseldorf, Germany in October 2025, Braskem unveiled next-generation bio-based and circular product solutions across its I'm green™ portfolio, though these announcements primarily addressed polyethylene and related polymers rather than polyisobutylene-specific innovations. The company's recent strategic emphasis reflects a company-wide pivot toward bio-based materials and circular economy principles across its petrochemical portfolio.
- Lubrizol announced a major strategic land acquisition in July 2024, signing a Memorandum of Understanding with Maharashtra State authorities to purchase a 120-acre site in Aurangabad, India, planned to become the company's largest manufacturing facility in the region. This expansion supports Lubrizol's regional growth strategy and capacity development. In August 2025, Lubrizol further expanded its strategic partnerships by extending its three-decade-long collaboration with Arihant Innochem, a leading specialty chemical distributor across Health, Home, and Personal Care markets, to include its growing Nutraceutical ingredients portfolio. Additionally, in July 2025, Lubrizol inaugurated its first Asia-Pacific Innovation Center in Singapore, reinforcing the company's commitment to regional research, collaboration, and market development across the Asia-Pacific region.
Report Coverage:
The research report offers an in-depth analysis based on Product Type (Molecular Weight) and Application segments. It details leading market players, providing an overview of their business, product offerings, investments, revenue streams, and key applications. Additionally, the report includes insights into the competitive environment, SWOT analysis, current market trends, as well as the primary drivers and constraints. Furthermore, it discusses various factors that have driven market expansion in recent years. The report also explores market dynamics, regulatory scenarios, and technological advancements that are shaping the industry. It assesses the impact of external factors and global economic changes on market growth. Lastly, it provides strategic recommendations for new entrants and established companies to navigate the complexities of the market.
Future Outlook:
- Demand from automotive lubricants and fuel additives is expected to remain stable across major regions.
- Tire and tire tube applications are likely to continue as a core volume driver for producers.
- Industrial adhesives and sealants are expected to support steady consumption growth.
- Product customization and grade differentiation will gain importance among end users.
- Emerging economies are expected to contribute incremental demand through industrial expansion.
- Manufacturers are likely to focus on improving production efficiency and cost control.
- Supply chain resilience will become a stronger priority for global producers.
- Technological improvements will support consistent quality and performance standards.
- Competition will favor companies with scale, technical expertise, and strong customer ties.
- Long-term market stability will depend on innovation and diversified application demand.
Request a Free Sample
Fill in your details and we'll send you a free sample report.
- Sample data tables & charts
- Research methodology
Need a Custom Version of This Report?
Tailor the scope, geography, or segments to your exact requirements.
- Custom geography or segment scope
- Direct access to our analyst team
Frequently Asked Questions
What is the current market size for Polyisobutylene market, and what is its projected size in 2032?
At what Compound Annual Growth Rate is the Polyisobutylene market projected to grow between 2025 and 2032?
Which Polyisobutylene market market segment held the largest share in 2024?
What are the primary factors fueling the growth of the Polyisobutylene market?
Who are the leading companies in the Polyisobutylene market?
Which region commanded the largest share of the Polyisobutylene market in 2024?
Table of Content
Chapter 1. Report Introduction
- 1.1 Report Description & Purpose
- 1.1.1 Report Title & Market Definition
- 1.1.2 Unique Selling Propositions (USP) & Key Differentiators
- 1.1.3 Value Proposition for Stakeholders
- 1.2 Research Objectives
- 1.2.1 Market Sizing Objectives (Volume & Revenue)
- 1.2.2 Segmentation Objectives
- 1.2.3 Competitive Intelligence Objectives
- 1.2.4 Forecast & Scenario Objectives
- 1.3 Report Scope
- 1.3.1 Polyisobutylene Scope – Types & Subtypes Covered
- 1.3.2 Geographic Scope – Regions & Countries Covered
- 1.3.3 Historical Period, Base Year & Forecast Period (2024; forecast to 2032)
- 1.3.4 Inclusions & Exclusions
- 1.4 HS Code & Classification Framework
- 1.5 Currency, Units & Pricing Basis
- 1.6 Target Stakeholders
- 1.7 Limitations & Assumptions
Chapter 2. Executive Summary
- 2.1 Global Polyisobutylene Market Snapshot
- 2.1.1 Market Size – Historical (2024) & Forecast (2024-2032) (2024: USD 2,193 million → 2032: USD 2,863 million)
- 2.1.2 Volume & Revenue – Global Totals
- 2.1.3 Key Market Highlights – Top Five Facts
- 2.2 Polyisobutylene Market Segmentation Snapshot
- 2.2.1 Market Split by Region – 2024 vs. 2032
- 2.3 Competitive Snapshot
- 2.3.1 Top 10 Players by Revenue Share – 2024
- 2.3.2 Top 10 Players by Volume Share – 2024
- 2.3.3 Recent Strategic Developments (18-Month Summary)
- 2.4 Key Investment Highlights & Strategic Conclusions
Chapter 3. Polyisobutylene Market Dynamics & Industry Analysis
- 3.1 Market Overview & Context
- 3.1.1 Polyisobutylene Market Position in the Broader Automotive Value Chain
- 3.1.2 OEM vs. Replacement Market Dynamics
- 3.1.3 Market Maturity & Development Stage by Region
- 3.2 Polyisobutylene Market Drivers
- 3.3 Polyisobutylene Market Restraints & Challenges
- 3.4 Polyisobutylene Market Opportunities
- 3.5 Porter's Five Forces Analysis
- 3.5.1 Threat of New Entrants
- 3.5.2 Bargaining Power of Suppliers
- 3.5.3 Bargaining Power of Buyers
- 3.5.4 Threat of Substitutes
- 3.5.5 Competitive Rivalry – Intensity Assessment
- 3.6 Polyisobutylene Value Chain Analysis
- 3.6.1 Upstream – Raw Material/Input Suppliers
- 3.6.1.1 Raw Material/Input 1
- 3.6.1.2 Raw Material/Input 2
- 3.6.1.3 Raw Material/Input 3
- 3.6.2 Midstream – Production/Manufacturing/Service Delivery
- 3.6.2.1 Production/Process Overview
- 3.6.2.2 Key Facility Locations & Capacity by Manufacturer
- 3.6.3 Downstream – Distribution & End Consumer
- 3.6.3.1 Primary Channel – B2B/OEM
- 3.6.3.2 Secondary Channels – Dealer, Retail, Online, Direct
- 3.6.4 Value Chain Profitability Analysis
- 3.6.1 Upstream – Raw Material/Input Suppliers
- 3.7 PESTEL Analysis
- 3.7.1 Political Factors
- 3.7.2 Economic Factors
- 3.7.3 Social Factors
- 3.7.4 Technological Factors
- 3.7.5 Environmental Factors
- 3.7.6 Legal Factors
- 3.8 Polyisobutylene Supply Chain Analysis
- 3.8.1 Raw Material/Input Supply Risk Assessment
- 3.8.2 Manufacturing Concentration Risk (Geographic Exposure)
- 3.8.3 Trade Disruption Impact Analysis
- 3.9 Regulatory & Policy Landscape
Note: The regulatory and policy landscape section covers regulations based on their applicability to the market, Polyisobutylene category, geography, and scope of the study. Only regulatory frameworks with a material impact on operations, compliance, trade, sustainability, or market access are analyzed in detail.
Chapter 4. Key Investment Pockets & Opportunity Analysis
- 4.1 Polyisobutylene Market Attractiveness Analysis
- 4.1.1 By Region – Investment Attractiveness Matrix (Volume × CAGR)
- 4.2 Absolute Revenue Growth Opportunity
- 4.2.1 By Region – Absolute USD Growth Through 2032
- 4.3 Incremental Volume Opportunity
- 4.3.1 By Region – Incremental Volume Through 2032
- 4.3.2 Segment – Incremental Volume
- 4.4 Emerging Submarket Opportunity Deep Dive (Subject to Applicability)
- 4.5 Emerging Market Opportunity Scorecards
- 4.5.1 United States
- 4.5.2 Europe
- 4.5.3 Asia
- 4.5.4 Middle East & Africa
Note: Emerging Market Opportunity Scorecards will be included based on relevance and strategic importance. Regions listed are indicative and may vary depending on data availability and market dynamics.
Chapter 5. Polyisobutylene Import-Export Analysis & Trade Flows
- 5.1 Global Trade Overview
- 5.1.1 Global Export Value by Country (2024)
- 5.1.2 Global Export Volume by Country (2024)
- 5.1.3 Global Import Value by Country (2024)
- 5.1.4 Global Import Volume by Country (2024)
- 5.1.5 Net Trade Balance by Country (2024)
- 5.2 Export Analysis – Segment
- 5.2.1 Type 1 (HS Code)
- 5.2.2 Type 2 (HS Code)
- 5.2.3 Type 3 (HS Code)
- 5.2.4 Type 4 (HS Code)
- 5.2.5 Type 5 (HS Code)
- 5.3 Import Analysis – Segment
- 5.3.1 Type 1 (HS Code)
- 5.3.2 Type 2 (HS Code)
- 5.3.3 Type 3 (HS Code)
- 5.3.4 Type 4 (HS Code)
- 5.3.5 Type 5 (HS Code)
- 5.4 Average Unit Trade Prices
- 5.4.1 Average Export Price – Segment & Country
- 5.4.2 Average Import Price – Segment & Source Country
- 5.4.3 Price Trends (2024)
- 5.5 Key Trade Route Analysis
- 5.5.1 Trade Route 1
- 5.5.2 Trade Route 2
- 5.5.3 Trade Route 3
- 5.5.4 Trade Route 4
- 5.5.5 Trade Route 5
- 5.6 Trade Policy Impact Assessment
- 5.6.1 US Anti-Dumping & Section 301 Tariffs
- 5.6.2 EU Customs Union Impact
- 5.6.3 Major Free Trade Agreements
- 5.6.4 USMCA Rules of Origin
Note: Trade policy analysis will be included only where relevant to the Polyisobutylene market.
Chapter 6. Competitive Landscape & Company Benchmarking
- 6.1 Polyisobutylene Market Concentration & Structure
- 6.1.1 Herfindahl-Hirschman Index (HHI) – vs. 2024
- 6.1.2 Tier 1, Tier 2 & Tier 3 Market Structure
- 6.1.3 Global, Regional & Local Player Dynamics
- 6.2 Polyisobutylene Market Share Analysis – 2024
- 6.2.1 Global Revenue Share by Company
- 6.2.2 Global Volume Share by Company
- 6.2.3 Regional Revenue Share
- 6.2.4 Market Share Evolution ( vs. 2024)
- 6.2.5 OEM Segment Share by Company
- 6.2.6 Replacement Segment Share by Company
- 6.3 Production/Delivery Capacity & Facility Analysis
- 6.3.1 Global Installed Capacity
- 6.3.2 Capacity Utilization Rates
- 6.3.3 Production/Output Volume
- 6.3.4 Facility Locations & Capacity Map
- 6.3.5 Planned Capacity Additions
- 6.4 Polyisobutylene Competitive Benchmarking Matrix
- 6.4.1 Revenue, Volume, CAGR & Profitability Comparison
- 6.4.2 Channel Revenue Mix
- 6.4.3 Geographic Revenue Exposure
- 6.4.4 R&D Intensity
- 6.4.5 Sustainability Maturity
- 6.5 Strategic Developments in Polyisobutylene (Last 24 Months)
- 6.5.1 Mergers, Acquisitions & Divestments
- 6.5.2 New Polyisobutylene Launches
- 6.5.3 Facility Expansions
- 6.5.4 Strategic Alliances, Joint Ventures & Partnerships
- 6.5.5 Distribution Expansion & Market Entry
- 6.5.6 Sustainability & ESG Initiatives
- 6.6 Competitive Strategy Mapping
- 6.6.1 Leader, Challenger, Follower & Niche Classification
- 6.6.2 Pricing Strategy Comparison
- 6.6.3 Channel Strategy Matrix
Note: Strategic developments are included based on their materiality and the availability of reliable information.
Chapter 7. Global Polyisobutylene Market – By Distribution Channel
- 7.1 Segment Overview
- 7.1.1 Volume & Revenue Split by Channel (2024 & 2032)
- 7.1.2 Channel Mix Evolution (2024-2032)
Chapter 8. Regional Market Analysis – Global Overview
- 8.1 Global Regional Overview
- 8.1.1 Regional Volume Share
- 8.1.2 Regional Revenue Share
- 8.1.3 Regional Volume by Region
- 8.1.4 Regional Revenue by Region
- 8.1.5 Regional Forecast Through 2032
- 8.2 Cross-Regional Segment Analysis
- 8.2.1 By Distribution Channel
- 8.2.2 By Brand/Price Tier
Chapter 9. North America Polyisobutylene Market
- 9.1 United States
- 9.2 Canada
- 9.3 Mexico
Chapter 10. Europe Polyisobutylene Market
- 10.1 Germany
- 10.2 France
- 10.3 Italy
- 10.4 United Kingdom
- 10.5 Spain
- 10.6 Poland
- 10.7 Russia
- 10.8 Netherlands
- 10.9 Belgium
- 10.10 Sweden
- 10.11 Denmark
- 10.12 Norway
- 10.13 Rest of Europe
Chapter 11. Asia Pacific Polyisobutylene Market
- 11.1 China
- 11.2 India
- 11.3 Japan
- 11.4 South Korea
- 11.5 Thailand
- 11.6 Indonesia
- 11.7 Vietnam
- 11.8 Malaysia
- 11.9 Australia
- 11.10 Rest of Asia Pacific
Chapter 12. Latin America Polyisobutylene Market
- 12.1 Brazil
- 12.2 Argentina
- 12.3 Colombia
- 12.4 Chile
- 12.5 Rest of Latin America
Chapter 13. Middle East Polyisobutylene Market
- 13.1 Saudi Arabia
- 13.2 United Arab Emirates
- 13.3 Turkey
- 13.4 Israel
- 13.5 Iran
- 13.6 Rest of the Middle East
Chapter 14. Africa Polyisobutylene Market
- 14.1 South Africa
- 14.2 Egypt
- 14.3 Nigeria
- 14.4 Morocco
- 14.5 Rest of Africa
Chapter 15. Polyisobutylene Company Profiles
- 15.1 [Company 01]
- 15.1.1 Company Overview
- 15.1.2 Key Management Personnel
- 15.1.3 Products & Services Portfolio
- 15.1.4 Financial Performance
- 15.1.5 Key Market Focus & Geographic Presence
- 15.1.6 Recent Developments & Strategic Initiatives
Note: The company profile list is preliminary and may change based on research findings, market developments, data availability, and client requirements.
Chapter 16. Appendices
- Appendix A – List of Abbreviations & Acronyms
- Appendix B – Industry Classification Code Reference – Full Series
- Appendix C – Production & Capacity Data Tables
- Appendix D – End-Use & Demand Base Tables
- Appendix E – Consumption & Replacement Rate Assumptions
- Appendix F – ASP Reference Tables
- Appendix G – Manufacturing & Facility Database
- Appendix H – Import-Export Data Tables
- Appendix I – Regulatory Summary Tables
- Appendix J – Primary Research Participant List (Anonymized)
- Appendix K – Primary Research Questionnaire Framework
- Appendix L – Data Sources & Bibliography
- Appendix M – Market Size Divergence & Source Comparison
Chapter 17. Research Methodology
- 17.1 Research Framework & Philosophy
- 17.2 Secondary Research – Sources, Hierarchy & Data Extraction
- 17.3 Data Modeling – Bottom-Up & Top-Down Market Sizing
- 17.4 Primary Research – Stakeholder Framework, LOI & Sample Sizes
- 17.5 Forecast Methodology – Regression, Scenario & Sensitivity Analysis
- 17.6 Quality Control – Four-Layer Validation Framework
- 17.7 Limitations & Standard Assumptions
- 17.8 Disclaimer
