Market Overview
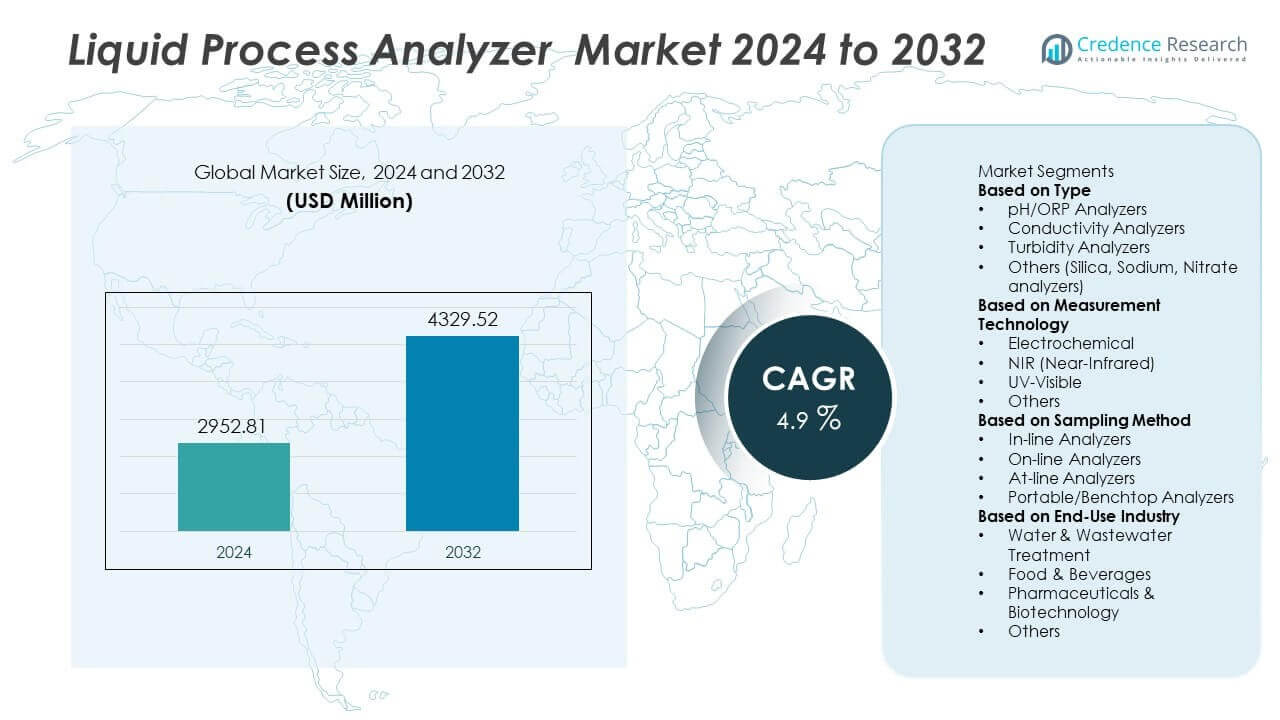
The Liquid Process Analyzer Market reached USD 2,952.81 million in 2024. The market is projected to rise to USD 4,329.52 million by 2032. It is expected to grow at a CAGR of 4.9% during the forecast period.
| REPORT ATTRIBUTE |
DETAILS |
| Historical Period |
2020-2023 |
| Base Year |
2024 |
| Forecast Period |
2025-2032 |
| Liquid Process Analyzer Market Size 2024 |
USD 2,952.81 Million |
| Liquid Process Analyzer Market, CAGR |
4.9% |
| Liquid Process Analyzer Market Size 2032 |
USD 4,329.52 Million |
The Liquid Process Analyzer market includes prominent players such as ABB Ltd., Yokogawa Electric Corporation, Emerson Electric Co., Endress+Hauser Group, Honeywell International Inc., Siemens AG, Schneider Electric SE, Thermo Fisher Scientific Inc., Hach (Danaher Corporation), and Mettler-Toledo International Inc. These companies compete through advanced sensor technology, multi-parameter analyzers, and IoT-enabled monitoring systems for improved process control. Asia-Pacific leads the market with a 29% share, driven by rapid industrialization, rising investments in wastewater treatment, and expansion in pharmaceuticals and semiconductor manufacturing. North America and Europe follow, supported by strict environmental regulations, strong digitalization efforts, and well-established process automation infrastructure.
Access crucial information at unmatched prices!
Request your sample report today & start making informed decisions powered by Credence Research Inc.!
Download Sample
Market Insights
- The Liquid Process Analyzer market reached USD 2,952.81 million in 2024 and is set to reach USD 4,329.52 million by 2032 at a 4.9% CAGR, driven by rising automation in water treatment and industrial processing.
- Strong demand for real-time quality monitoring acts as a core driver, as pH/ORP analyzers hold a 34% segment share, supporting chemical balance, corrosion control, and regulatory safety needs across wastewater, food, and pharmaceutical operations.
- Smart and connected analyzers remain a key trend, with IoT-based diagnostics, self-calibration sensors, and cloud data improving process visibility. Companies focus on multi-parameter, modular systems that cut downtime and reduce maintenance costs.
- Competitive activity intensifies as ABB, Emerson, Yokogawa, Endress+Hauser, and Honeywell expand analyzer portfolios and enhance data integration platforms. Vendors use mergers, digital service models, and regional production to strengthen global reach.
- Asia-Pacific leads the market with 29% regional share, followed by North America at 32% and Europe at 27%, while Latin America and Middle East & Africa hold 7% and 5%, supported by long-term industrial water and energy projects.
Market Segmentation Analysis:
By Type:
pH/ORP analyzers hold the dominant share of 34% in the type segment. Industries rely on pH and oxidation-reduction potential measurement to maintain chemical balance, corrosion control, and process efficiency. Conductivity analyzers continue to expand due to rising demand in water treatment and ultrapure water systems. Turbidity analyzers support regulatory compliance in food, beverage, and wastewater quality testing. Other analyzers such as silica, sodium, and nitrate devices gain traction in power generation and environmental monitoring. Strong adoption in pharmaceuticals and municipal treatment plants drives sustained demand for advanced type-specific liquid process analyzers.
- For instance, Yokogawa released a silica analyzer capable of detecting concentrations as low as 0.5 ppb for power plant boiler monitoring.
By Measurement Technology:
Electrochemical technology accounts for the largest market share of 41% in this segment. The technology supports stable measurement of pH, conductivity, dissolved oxygen, and ion concentration across complex production environments. UV-Visible and NIR methods observe strong growth trends due to rapid, non-destructive measurement capabilities. These technologies play a vital role in pharmaceutical bioprocessing and petrochemical feedstock monitoring. Other measurement methods, including Raman and ion-selective sensing, enhance precision in chemical and diagnostic applications. Increasing automation and sensor calibration improvements support broader adoption across processing plants.
- For instance, Mettler-Toledo upgraded its electrochemical platform with sensors that use Intelligent Sensor Management (ISM) technology to provide predictive diagnostics, such as the number of days remaining until the sensor needs calibration, which helps proactively manage sensor drift and ensure accurate results.
By Sampling Method:
In-line analyzers represent the leading sampling method with a 46% share in the market. These analyzers enable real-time monitoring and continuous quality control, reducing downtime and manual intervention in industrial processes. On-line analyzers also see rising use in closed-loop systems that require automated control adjustments. At-line configurations support laboratory-confirmed testing near production lines, while portable and benchtop analyzers serve field and remote operations. Growth in smart monitoring infrastructure and industrial automation strengthens demand for in-line systems, particularly in oil and gas, power generation, and wastewater treatment applications.
Key Growth Drivers
Rising Need for Real-Time Quality Monitoring
Industries adopt liquid process analyzers to ensure accurate and continuous monitoring of critical parameters in water treatment, chemical production, and pharmaceutical manufacturing. Real-time data reduces contamination risks, prevents process deviations, and supports compliance with stringent quality regulations. Facilities integrate analyzers into automated control systems to minimize human error and improve production efficiency. Growing investments in digital water infrastructure and smart process control systems further accelerate demand. This driver remains vital as end users prioritize reliable measurement to improve operational stability and reduce lifecycle maintenance costs across industrial applications.
- For instance, Endress+Hauser upgraded its Liquiline CM44x platform with an enhanced Memosens sensor interface capable of storing up to 16,000 measurement points directly on the sensor head. The digital protocol supports signal transmission across 100 meters of cable length without data loss, improving reliability in large industrial plants.
Stricter Environmental and Wastewater Regulations
Global authorities enforce tighter discharge limits on chemical effluents, dissolved solids, turbidity levels, and biological contaminants, driving strong demand for advanced analyzers. Municipal and industrial wastewater plants deploy pH, conductivity, and nutrient analyzers to meet regulatory frameworks and support sustainable water reuse. Industrial operators rely on continuous monitoring to avoid legal penalties and enhance environmental stewardship. The trend aligns with expanding investments in desalination, sludge treatment, and low-impact industrial processing. Regulatory compliance will remain a core growth driver as more nations develop zero-liquid-discharge and resource recovery initiatives.
- For instance, Hach (Danaher Corporation) introduced a next-generation phosphate analyzer with a reagent-use reduction of up to 80 liters per month, lowering chemical waste in regulated wastewater plants. The analyzer delivers automated nutrient measurement every 5 minutes, supporting compliance with strict nutrient-discharge thresholds.
Growing Use in High-Purity and Bioprocessing Applications
Liquid process analyzers gain traction in pharmaceuticals, biotechnology, and semiconductor manufacturing where ultrapure fluids are essential. Real-time measurement of TOC, dissolved oxygen, and conductivity supports vaccine production, biologics development, and sterile manufacturing guidelines. Expansion of cell therapy and bioprocessing facilities increases the requirement for analyzers that ensure batch consistency and contamination-free output. Semiconductor fabs adopt analyzers to maintain stringent water purity standards for etching and wafer cleaning. Increased research funding and long-term biomanufacturing capacity upgrades reinforce demand in these high-purity applications.
Key Trends & Opportunities
Advancement of Smart and Connected Analyzer Systems
Process industries accelerate adoption of analyzers integrated with cloud connectivity, predictive diagnostics, and IoT-enabled data visualization. Remote monitoring enhances maintenance planning, reduces downtime, and enables faster response to process deviations. Smart analyzers leverage analytics to identify sensor drift, calibration needs, and contamination events well before equipment failure. Software-driven platforms create opportunities for subscription-based service models and data-as-a-service solutions. This trend supports digital transformation in water management, food processing, and chemicals, positioning connected analyzers as valuable tools for automated and high-efficiency process operations.
- For instance, Yokogawa Electric Corporation’s FLXA402 platform can be used with SENCOM smart sensor technology. The SENCOM platform’s digital sensors store calibration data on an integrated chip, which can be uploaded to the FLXA402 analyzer or a PC for simplified maintenance.
Increasing Adoption of Modular and Multi-Parameter Analyzers
Manufacturers develop modular instruments capable of measuring multiple chemical and physical parameters in a single platform. These designs reduce installation time, simplify maintenance, and lower operational costs while improving laboratory and field efficiency. Multi-parameter systems are increasingly used in desalination, membrane filtration, and industrial water reuse processes. Standardized modules allow faster upgrades and support diverse configurations for pharmaceuticals, petrochemicals, and mining operations. This trend creates significant growth opportunities for vendors offering scalable hardware combined with calibration software and advanced process integration capabilities.
- For instance, Emerson’s Rosemount X-well™ Technology, used for non-intrusive temperature measurement, features a simple bolt-on design that can be commissioned in less than one hour per temperature point, eliminating the need for cutting and welding pipes.
Key Challenges
High Maintenance and Calibration Requirements
Liquid process analyzers require frequent calibration, sensor replacements, and chemical conditioning to ensure measurement accuracy. Harsh industrial conditions, including corrosive fluids and extreme temperature fluctuations, accelerate component wear and increase service needs. Skilled technicians remain essential for installation and maintenance, raising operational expenses for end users. Downtime caused by improper readings can interrupt production and lead to financial losses. These factors may slow adoption in cost-sensitive facilities and encourage manufacturers to focus on self-cleaning, self-calibrating, and longer-lifecycle sensor technologies.
Integration Complexities with Legacy Industrial Systems
Many processing plants operate older automation and SCADA systems that challenge smooth integration of advanced analyzers. Compatibility gaps with existing communication protocols and digital control networks increase deployment costs and delay modernization efforts. Operators may require additional software upgrades, fieldbus converters, or engineering support to synchronize real-time analyzer data. Limited IT infrastructure and cybersecurity concerns further restrict cloud-based and remote monitoring adoption. Overcoming these integration hurdles remains critical for achieving seamless automation and unlocking the full value of process analytics in industrial environments.
Regional Analysis
North America
North America holds a 32% share of the Liquid Process Analyzer market, supported by strong adoption in water treatment, pharmaceuticals, and petrochemicals. The United States invests in modernizing municipal and industrial wastewater facilities, driving demand for pH, turbidity, and conductivity analyzers. The region benefits from advanced process automation and stricter EPA discharge regulations, encouraging real-time monitoring systems. Growth in biopharmaceutical production and upstream oil and gas operations also supports continued analyzer deployment. Canada advances digital water quality monitoring programs, reinforcing the role of connected and cloud-enabled analytical solutions across industrial applications.
Europe
Europe accounts for a 27% share of the market, driven by environmental compliance frameworks and circular water management initiatives. The EU Water Framework Directive accelerates the adoption of continuous measurement technologies in municipal and industrial treatment plants. Pharmaceutical and food processing industries remain key users, especially in Germany, France, and the United Kingdom. Expanded investment in green hydrogen and chemical processing facilities increases deployment of liquid analyzers for process optimization and safety monitoring. Regional manufacturers focus on sensor lifecycle improvements, modular analyzer designs, and Industry 4.0 integration to enhance operational value.
Asia-Pacific
Asia-Pacific leads with a 29% share of the market, supported by expanding manufacturing, water infrastructure upgrades, and rising industrial automation. China and India invest in large-scale wastewater recycling, desalination, and semiconductor production, increasing demand for multi-parameter analyzers. Japan and South Korea adopt analyzers in precision chemical and pharmaceutical operations requiring high-purity liquid monitoring. Strong growth in food and beverage processing and power generation also strengthens market demand. Government programs promoting industrial sustainability and digital process control systems contribute to the region’s long-term adoption of real-time monitoring solutions.
Latin America
Latin America holds a 7% share of the market, driven by gradual improvements in mining, oil and gas, and municipal water treatment infrastructure. Brazil and Mexico invest in water quality monitoring systems to address contamination and improve resource management. Mining operations in Chile and Peru deploy analyzers to enhance process efficiency and comply with wastewater discharge standards. Adoption remains slower than in other regions due to budget constraints and limited access to skilled technical personnel. However, growing interest in automation and industrial safety supports future demand across manufacturing and processing facilities.
Middle East & Africa
The Middle East & Africa capture a 5% share of the market, influenced by desalination projects, petrochemical expansion, and water reuse initiatives. Gulf countries deploy advanced analyzers across reverse osmosis plants and refinery operations, improving efficiency and regulatory compliance. South Africa strengthens analyzer usage in mining and municipal treatment networks. Regional adoption is supported by rising industrial digitalization and investment in remote monitoring technologies for harsh operating environments. Limited service infrastructure and higher maintenance requirements remain adoption barriers, but long-term opportunities grow as nations pursue sustainable water management strategies.
Market Segmentations:
By Type
- pH/ORP Analyzers
- Conductivity Analyzers
- Turbidity Analyzers
- Others (Silica, Sodium, Nitrate analyzers)
By Measurement Technology
- Electrochemical
- NIR (Near-Infrared)
- UV-Visible
- Others
By Sampling Method
- In-line Analyzers
- On-line Analyzers
- At-line Analyzers
- Portable/Benchtop Analyzers
By End-Use Industry
- Water & Wastewater Treatment
- Food & Beverages
- Pharmaceuticals & Biotechnology
- Others
By Geography
- North America
- Europe
- Germany
- France
- U.K.
- Italy
- Spain
- Rest of Europe
- Asia Pacific
- China
- Japan
- India
- South Korea
- South-east Asia
- Rest of Asia Pacific
- Latin America
- Brazil
- Argentina
- Rest of Latin America
- Middle East & Africa
- GCC Countries
- South Africa
- Rest of the Middle East and Africa
Competitive Landscape
The Liquid Process Analyzer market features major players such as ABB Ltd., Yokogawa Electric Corporation, Emerson Electric Co., Endress+Hauser Group, Honeywell International Inc., Siemens AG, Schneider Electric SE, Thermo Fisher Scientific Inc., Hach (Danaher Corporation), and Mettler-Toledo International Inc. Competition focuses on portfolio diversification, enhanced measurement accuracy, and integration of digital monitoring platforms. Companies invest in sensor innovation, self-calibration capabilities, and multiparameter analyzer designs to reduce maintenance and improve lifecycle performance. Strategic partnerships with industrial automation providers strengthen real-time process control and cybersecurity-enabled data connectivity. Vendors pursue acquisitions and regional manufacturing expansions to increase service coverage and target fast-growing industries such as pharmaceuticals, semiconductor production, and water treatment. Cloud-enabled diagnostics and predictive maintenance tools also shape differentiation strategies. As industries prioritize sustainability and regulatory compliance, suppliers emphasize solutions that ensure consistent monitoring, energy-efficient operations, and reduced environmental discharge risks across diverse.
Key Player Analysis
- ABB Ltd.
- Yokogawa Electric Corporation
- Emerson Electric Co.
- Honeywell International Inc.
- Endress+Hauser Group
- Schneider Electric SE
- Thermo Fisher Scientific Inc.
- Siemens AG
- Hach (Danaher Corporation)
- Mettler-Toledo International Inc.
Recent Developments
- In November 2025, Endress+Hauser Group opened a new development and production building at its Waldheim site (Germany) specifically for liquid analysis sensors and components, doubling the site’s usable area and signalling strong investment in its liquid measurement business.
- In December 2024, ABB Ltd. launched the ChloroStar™ family of chlorine-measurement analyzers, designed for water & wastewater and other liquid process-applications, featuring self-cleaning sensors and EZLink™ technology.
Shape Your Report to Specific Countries or Regions & Enjoy 30% Off!
Report Coverage
The research report offers an in-depth analysis based on Type, Measurement Technology, Sampling Method, End-Use Industry and Geography. It details leading market players, providing an overview of their business, product offerings, investments, revenue streams, and key applications. Additionally, the report includes insights into the competitive environment, SWOT analysis, current market trends, as well as the primary drivers and constraints. Furthermore, it discusses various factors that have driven market expansion in recent years. The report also explores market dynamics, regulatory scenarios, and technological advancements that are shaping the industry. It assesses the impact of external factors and global economic changes on market growth. Lastly, it provides strategic recommendations for new entrants and established companies to navigate the complexities of the market.
Future Outlook
- Demand for real-time monitoring will increase as industries expand automation.
- Smart, connected analyzers will gain adoption with stronger IoT and AI integration.
- Multi-parameter platforms will replace single-parameter systems in complex processing.
- Self-cleaning and self-calibrating sensors will reduce maintenance time and cost.
- High-purity applications in pharmaceuticals and semiconductors will support stronger growth.
- Water reuse, desalination, and zero-liquid-discharge projects will boost analyzer deployment.
- Vendors will focus on modular designs to support scalable process configurations.
- Cybersecure data management and cloud analytics will become core to solution development.
- Partnerships between analyzer manufacturers and digital automation providers will expand global reach.
- Emerging economies will invest more in wastewater quality control, supporting long-term market expansion.


