Market Overview
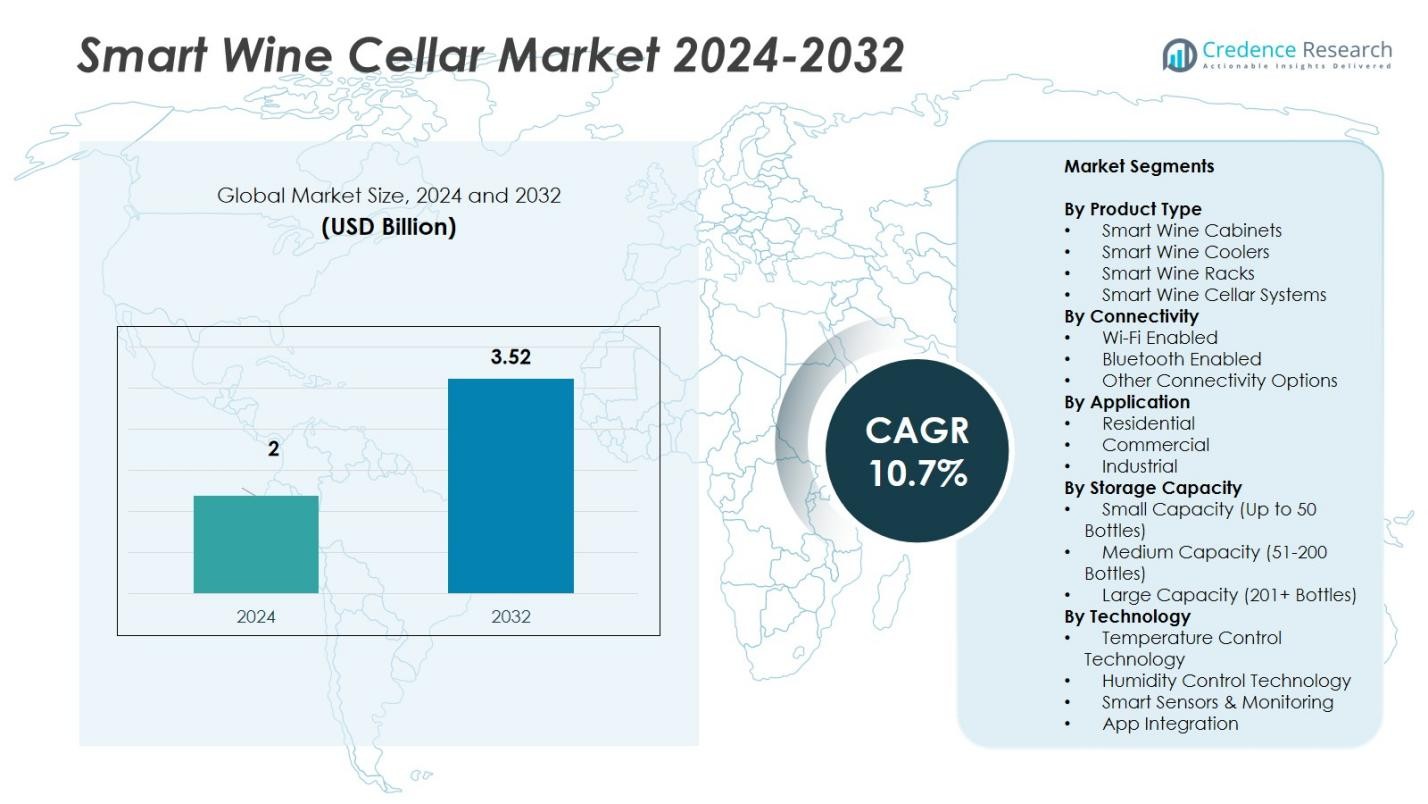
The Smart Wine Cellar Market size was valued at USD 2 billion in 2024 and is anticipated to reach USD 3.52 billion by 2032, growing at a CAGR of 10.7% during the forecast period.
| REPORT ATTRIBUTE |
DETAILS |
| Historical Period |
2020-2023 |
| Base Year |
2024 |
| Forecast Period |
2025-2032 |
| Smart Wine Cellar Market Size 2024 |
USD 2 Billion |
| Smart Wine Cellar Market, CAGR |
10.7% |
| Smart Wine Cellar Market Size 2032 |
USD 3.52 Billion |
The smart wine cellar market is driven by prominent players such as LG Electronics, EuroCave, Haier Electronics Group, Liebherr-International Deutschland GmbH, Electrolux AB, Dometic Group, La Sommeliere, Caveasy, Avast Solutions, and Cellar Solutions. These companies focus on innovative storage technologies, AI-enabled monitoring, and Wi-Fi-based connectivity to enhance user convenience and energy efficiency. EuroCave and Liebherr dominate the premium European market, while LG and Haier lead in Asia-Pacific with compact, tech-integrated designs. North America remains the leading region, holding a 34% market share, supported by widespread smart home adoption and luxury residential installations, followed by Europe with 29% driven by sustainable and high-end wine storage demand.
Access crucial information at unmatched prices!
Request your sample report today & start making informed decisions powered by Credence Research Inc.!
Download Sample
Market Insights
- The Smart Wine Cellar Market was valued at USD 2 billion in 2024 and is projected to reach USD 3.52 billion by 2032, growing at a CAGR of 10.7%.
- Rising smart home integration and growing demand for connected appliances drive the adoption of intelligent wine storage systems globally.
- The market trend focuses on AI-enabled monitoring, energy-efficient cooling, and Wi-Fi connectivity for enhanced user convenience and sustainability.
- Smart Wine Cabinets lead with a 38% share, while Wi-Fi-enabled systems dominate connectivity with a 64% share, supported by advanced digital features.
- North America holds 34% of the global share, followed by Europe with 29% and Asia-Pacific with 23%, driven by expanding luxury housing and hospitality projects, while high installation costs remain a key restraint.
Market Segmentation Analysis:
By Product Type
Smart Wine Cabinets hold the dominant share of 38% in the smart wine cellar market due to their advanced climate control and sleek design integration in modern homes. These cabinets offer precise temperature and humidity management, making them ideal for long-term wine preservation. The segment benefits from rising adoption in luxury residential projects and growing consumer preference for space-efficient wine storage. Manufacturers integrate touchscreen displays, smart sensors, and voice control features to enhance usability and energy efficiency, driving their widespread popularity among premium consumers.
- For instance, for high-end wine preservation, EuroCave’s Royale range features a highly stable, single temperature zone set at an optimal 12°C (+/- 0.5°C tolerance), with a patented “Hygrocontrol System” that ensures a consistent humidity of around 70%.
By Connectivity
The Wi-Fi Enabled segment leads the market with a 64% share, driven by the increasing demand for remote monitoring and control capabilities. Wi-Fi connectivity allows users to adjust storage settings, receive alerts, and manage multiple cellars through mobile applications. Smart home ecosystem compatibility further boosts adoption in urban households and hospitality spaces. Continuous product innovation, such as integration with AI-based assistants and real-time inventory tracking, strengthens this segment’s dominance over Bluetooth and other connectivity options in smart wine management solutions.
- For instance, LG’s smart wine cellar features intuitive sensors that automatically open the door and allow seamless control via Wi-Fi, enhancing user convenience even when hands are full.
By Application
The Residential segment accounts for the largest market share of 58%, fueled by the rising number of smart homes and luxury apartment installations. Homeowners invest in intelligent wine storage units to maintain wine quality and enhance lifestyle convenience. Customizable capacity options and energy-efficient features cater to both collectors and casual consumers. Increasing disposable income and awareness of wine preservation technology further promote demand. The segment’s growth is also supported by aesthetic integration trends in modular kitchens and home automation systems across developed and emerging economies.
Key Growth Drivers
Rising Adoption of Smart Home Technology
The smart wine cellar market grows strongly with expanding smart home integration across residential settings. Consumers increasingly seek connected appliances that offer convenience and precise control over wine preservation. Smart wine systems featuring Wi-Fi and app-based management align with modern living preferences. Companies such as LG Electronics and Haier integrate advanced sensors and AI-driven monitoring, enabling users to adjust storage conditions remotely. This trend supports sustained demand among urban households investing in premium home automation ecosystems.
- For instance, Haier’s smart wine cellars integrate app-based management, enabling homeowners to receive real-time alerts and control storage conditions from anywhere, supporting both residential and commercial use with reliable remote monitoring and automated climate adjustments.
Increasing Wine Consumption and Premiumization
Global wine consumption continues to rise, especially in urban and high-income populations. The demand for premium wines and collectors’ editions drives the need for advanced storage solutions. Smart wine cellars ensure optimal conditions for flavor retention and aging, making them essential for enthusiasts. Manufacturers like EuroCave and Liebherr focus on offering temperature-zoned cabinets to preserve multiple wine types. Growing awareness of wine quality preservation supports market expansion in both residential and hospitality sectors.
- For instance, Liebherr’s WTes 5972 model provides dual temperature zones independently adjustable between +5°C and +20°C, allowing storage of both red and white wines at ideal drinking temperatures.
Rising Luxury Hospitality and Retail Expansion
Luxury hotels, restaurants, and wine bars increasingly deploy smart wine storage systems to enhance service quality and visual appeal. These establishments use digital management systems to track inventory, regulate conditions, and improve energy efficiency. Integration with digital wine lists and automated refill alerts enhances operational convenience. The trend is evident in high-end hospitality regions across Europe and North America, where connected storage solutions align with luxury service standards and sustainability goals.
Key Trends & Opportunities
Integration of Artificial Intelligence and IoT
AI and IoT technologies redefine how users interact with wine cellars. AI algorithms predict ideal preservation conditions and detect anomalies in real time. IoT connectivity allows seamless linking with smart assistants and home automation hubs. For instance, AI-enabled wine cabinets from Dometic and Electrolux offer adaptive temperature control based on wine type and usage patterns. This convergence of smart technologies provides strong opportunities for innovation and premium user experiences.
- For instance, Electrolux Professional wine cellars, such as the 720010 model, offer multi-zone temperature settings with an operating range of 5°C to 22°C, effective humidity control, and a vibration reduction system to ensure optimal conditions for up to 170 bottles.
Sustainability and Energy-Efficient Designs
Manufacturers emphasize energy-efficient and eco-friendly smart wine cellar systems to meet green building standards. Features like inverter compressors, eco-mode operation, and low-emission refrigerants reduce power consumption and carbon footprint. Sustainable design appeals to environmentally conscious consumers and commercial buyers. Companies such as Haier and Liebherr develop recyclable materials and low-noise cooling systems, creating opportunities for differentiation and regulatory compliance in developed markets focused on sustainability.
- For instance, Haier’s WS-137GDAI wine cellar incorporates an intelligently designed interior LED lighting system that consumes less energy and emits minimal heat to help maintain the optimal ambient temperature.
Key Challenges
High Initial Cost and Limited Accessibility
The high purchase and installation cost of smart wine cellars restricts adoption in price-sensitive markets. Advanced technologies such as multi-zone cooling, AI monitoring, and digital control interfaces increase manufacturing expenses. This limits access to affluent consumers and commercial users in premium hospitality segments. Limited distribution channels in emerging regions further hinder market penetration, slowing growth in developing economies despite growing interest in connected home appliances.
Integration and Compatibility Issues
Compatibility with existing smart home systems remains a significant challenge for many brands. Inconsistent software standards and connectivity protocols create operational inefficiencies, affecting user experience. Some Wi-Fi-enabled systems face connectivity dropouts or limited app interoperability across platforms. Manufacturers must invest in universal interface development and robust firmware support. Addressing these issues is essential to ensure seamless integration, enhance customer satisfaction, and strengthen long-term adoption across diverse consumer bases.
Regional Analysis
North America
North America holds the largest share of 34% in the smart wine cellar market, supported by strong consumer spending on luxury home appliances and smart home integration. The U.S. leads regional demand due to the rising number of wine collectors and expanding premium real estate projects. Advanced connectivity solutions from brands such as LG Electronics and Dometic Group further accelerate adoption. The hospitality sector, including upscale restaurants and wine lounges, increasingly invests in automated storage systems. Sustainable product innovations and AI-enabled monitoring features continue to drive steady market expansion across the region.
Europe
Europe accounts for 29% of the global market, driven by a long-established wine culture and high adoption of energy-efficient cooling technologies. France, Italy, and Germany dominate regional sales owing to growing smart kitchen installations and eco-labeled appliance demand. Leading European manufacturers like EuroCave and Liebherr strengthen the market with advanced cellar designs offering precision temperature zones. The commercial wine storage segment gains traction in luxury hotels and fine-dining venues. Government energy efficiency regulations and consumer preference for connected appliances continue to reinforce regional growth.
Asia-Pacific
Asia-Pacific captures a 23% share, emerging as the fastest-growing region due to urbanization, rising income levels, and lifestyle modernization. Countries such as China, Japan, and South Korea lead adoption through smart home expansion and hospitality investments. Brands including Haier Electronics and Electrolux AB focus on compact and affordable smart cellar models for urban households. The region’s growing wine-drinking culture, especially among millennials, fuels steady demand. Increasing e-commerce penetration and awareness of proper wine preservation also contribute to the rapid growth of connected wine storage solutions.
Latin America
Latin America holds a 7% market share, led by Brazil, Argentina, and Chile—nations with robust wine production and consumption patterns. The growing number of premium restaurants and boutique wineries drives smart cellar adoption. Rising urban affluence and interest in home automation further support regional expansion. Local distributors collaborate with global brands to introduce energy-efficient, app-controlled storage units. However, high import costs and limited smart home infrastructure continue to constrain broader penetration, leaving substantial untapped potential for international manufacturers in the medium term.
Middle East & Africa
The Middle East & Africa region accounts for 7% of the global smart wine cellar market, fueled by luxury hospitality growth and premium residential projects. Countries such as the UAE, Saudi Arabia, and South Africa witness increasing adoption in hotels, resorts, and high-end homes. Consumers prefer Wi-Fi-enabled and climate-controlled cellars suited to hot climates. Partnerships between European manufacturers and regional distributors strengthen supply networks. Although market growth remains moderate due to cultural and regulatory factors, expanding tourism and investment in luxury real estate drive consistent long-term opportunities.
Market Segmentations:
By Product Type
- Smart Wine Cabinets
- Smart Wine Coolers
- Smart Wine Racks
- Smart Wine Cellar Systems
By Connectivity
- Wi-Fi Enabled
- Bluetooth Enabled
- Other Connectivity Options
By Application
- Residential
- Commercial
- Industrial
By Storage Capacity
- Small Capacity (Up to 50 Bottles)
- Medium Capacity (51-200 Bottles)
- Large Capacity (201+ Bottles)
By Technology
- Temperature Control Technology
- Humidity Control Technology
- Smart Sensors & Monitoring
- App Integration
By Region
- North America
- Europe
- Germany
- France
- U.K.
- Italy
- Spain
- Rest of Europe
- Asia Pacific
- China
- Japan
- India
- South Korea
- South-east Asia
- Rest of Asia Pacific
- Latin America
- Brazil
- Argentina
- Rest of Latin America
- Middle East & Africa
- GCC Countries
- South Africa
- Rest of the Middle East and Africa
Competitive Landscape
The competitive landscape of the smart wine cellar market features leading players such as LG Electronics, EuroCave, Haier Electronics Group, Liebherr-International Deutschland GmbH, Electrolux AB, Dometic Group, La Sommeliere, Caveasy, Avast Solutions, and Cellar Solutions. The market remains moderately consolidated, with global brands focusing on innovation, design aesthetics, and smart connectivity integration to strengthen their portfolios. Companies emphasize advanced technologies like AI-driven temperature control, humidity sensors, and mobile app synchronization to improve user convenience. Partnerships with home automation firms and hospitality chains expand distribution reach. European players lead in premium design and sustainability features, while Asian brands target affordability and compactness for urban homes. Continuous investment in R&D, energy-efficient components, and multi-zone systems allows manufacturers to cater to residential and commercial buyers. Competitive differentiation relies on innovation speed, customization capabilities, and after-sales service quality across major markets worldwide.
Key Player Analysis
- LG Electronics
- EuroCave
- La Sommeliere
- Haier Electronics Group
- Liebherr-International Deutschland GmbH
- Electrolux AB
- Dometic Group
- Caveasy
- Avast Solutions
- Cellar Solutions
Recent Developments
- In October 2024, Haier Smart Home Co., Ltd. completed the acquisition of Carrier Commercial Refrigeration in a deal valued at nearly USD 775 million.
- In 2024, Haier Smart Home Co., Ltd. introduced a connected wine cabinet with natural air‑circulation and light‑control tech.
- In February 2024, Vinotemp launched its Vinoglow™ line of wine and beverage coolers, including 41‑bottle and 188‑bottle models.
Shape Your Report to Specific Countries or Regions & Enjoy 30% Off!
Report Coverage
The research report offers an in-depth analysis based on Product Type, Connectivity, Application, Storage Capacity, Technology and Region. It details leading market players, providing an overview of their business, product offerings, investments, revenue streams, and key applications. Additionally, the report includes insights into the competitive environment, SWOT analysis, current market trends, as well as the primary drivers and constraints. Furthermore, it discusses various factors that have driven market expansion in recent years. The report also explores market dynamics, regulatory scenarios, and technological advancements that are shaping the industry. It assesses the impact of external factors and global economic changes on market growth. Lastly, it provides strategic recommendations for new entrants and established companies to navigate the complexities of the market.
Future Outlook
- Growing integration of AI and IoT will enhance automation and predictive temperature control features.
- Manufacturers will focus on energy-efficient designs to meet sustainability and regulatory standards.
- Expansion of smart home ecosystems will increase connectivity compatibility with voice assistants and mobile apps.
- Luxury real estate developments will continue to drive demand for built-in smart wine storage solutions.
- Rising wine consumption among millennials will boost residential adoption across urban regions.
- Hospitality and retail sectors will adopt advanced wine cellars to improve customer experience and inventory management.
- Collaborations between appliance makers and smart home platform providers will accelerate innovation.
- Compact and modular wine cellars will gain popularity among apartment owners and small-space users.
- E-commerce growth will strengthen product accessibility and direct-to-consumer sales for premium brands.
- Continuous R&D investments will lead to the development of multi-zone and self-learning wine storage systems.


