
Market Overview
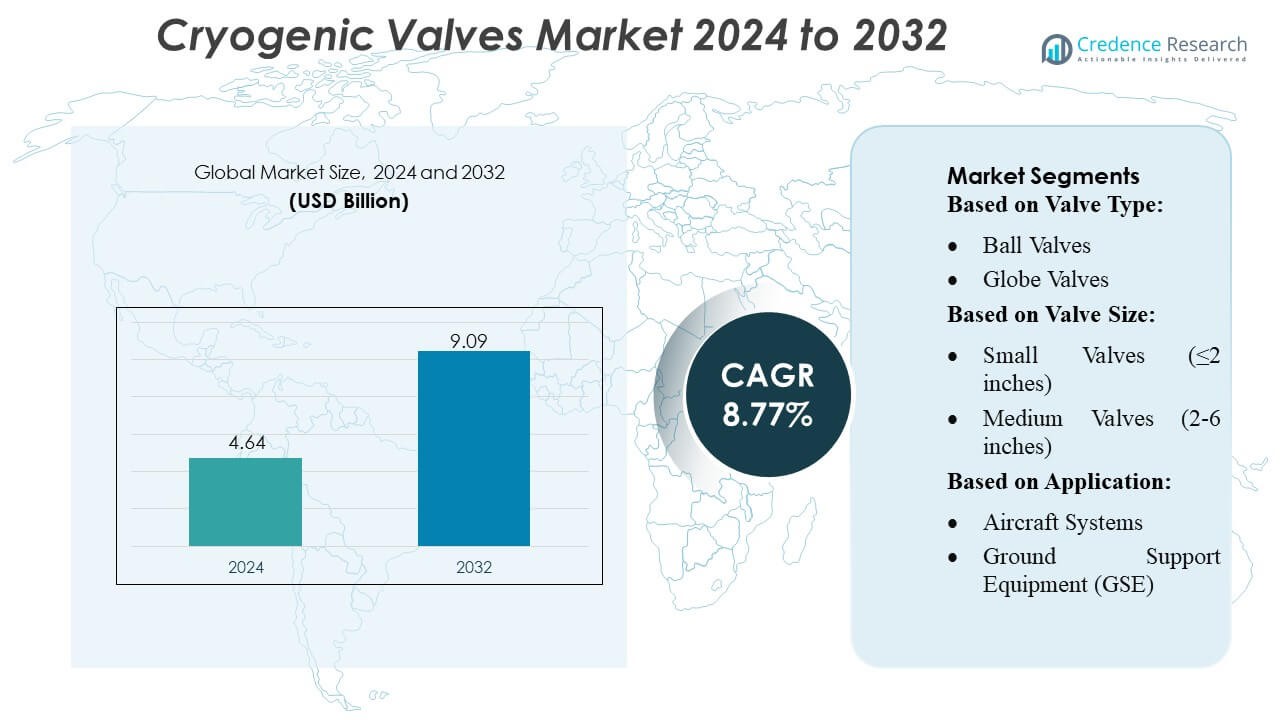
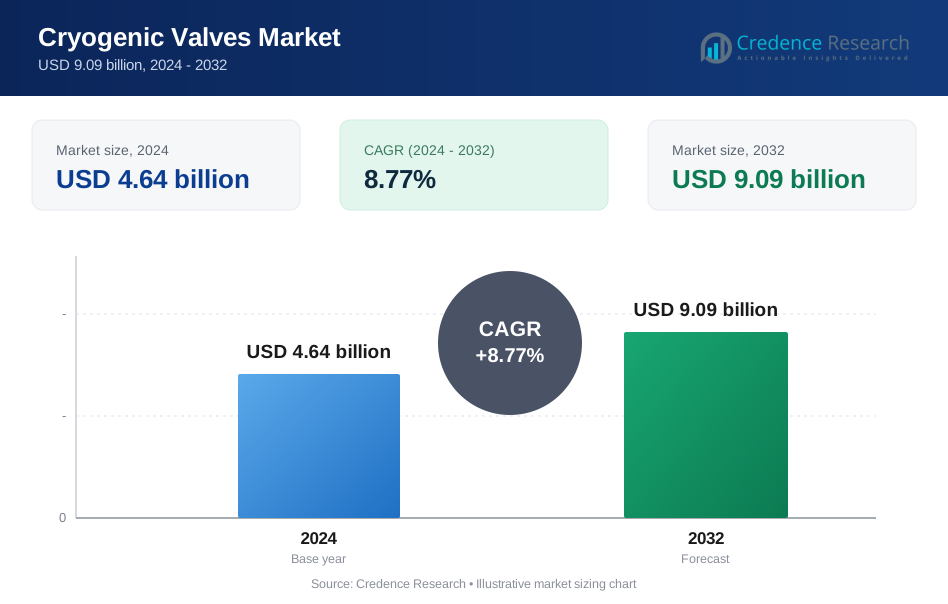
Cryogenic Valves Market size was valued USD 4.64 billion in 2024 and is anticipated to reach USD 9.09 billion by 2032, at a CAGR of 8.77% during the forecast period.
| REPORT ATTRIBUTE | DETAILS |
|---|---|
| Historical Period | 2020-2023 |
| Base Year | 2024 |
| Forecast Period | 2025-2032 |
| Cryogenic Valves Market Size 2024 | USD 4.64 Billion |
| Cryogenic Valves Market, CAGR | 8.77% |
| Cryogenic Valves Market Size 2032 | USD 9.09 Billion |
The Cryogenic Valves Market features a strong competitive landscape shaped by globally established manufacturers that focus on advanced sealing technologies, high-precision machining, and robust performance in ultra-low-temperature environments. Companies continuously invest in automation, digital monitoring, and material innovation to enhance reliability for LNG, hydrogen, aerospace, and industrial gas applications. Strategic partnerships with EPC contractors and energy developers further strengthen their market presence. Asia-Pacific leads the global market with an estimated 32–34% share, driven by rapid industrialization, expanding LNG import infrastructure, and significant advancements in space and hydrogen energy programs that boost long-term demand for cryogenic valve solutions.
Market Insights
- The Cryogenic Valves Market was valued at USD 4.64 billion in 2024 and is projected to reach USD 9.09 billion by 2032, registering a CAGR of 8.77% during the forecast period.
- Strong market drivers include rising LNG trade, expanding hydrogen infrastructure, and increasing use of cryogenic gases across aerospace, industrial manufacturing, and energy applications.
- Key market trends involve rapid adoption of smart valve monitoring systems, integration of digital controls, and growing demand for lightweight alloys and advanced sealing materials.
- Competitive activity remains intense as global manufacturers invest in automation, precision machining, and EPC partnerships, while restraints include high production costs, stringent certification requirements, and technical challenges in achieving zero leakage at ultra-low temperatures.
- Asia-Pacific leads the market with 32–34% regional share, while small valve sizes (≤2 inches) hold the largest segment share due to widespread use in aerospace systems, industrial gas distribution, and compact LNG applications.
Market Segmentation Analysis:
By Valve Type
Ball valves dominate the cryogenic valves market with an estimated 32–34% share, driven by their tight shutoff capability, low torque requirements, and strong suitability for LNG transfer, storage, and aerospace fueling systems. Their quarter-turn design enhances operational efficiency in extreme low-temperature conditions, making them preferred in continuous-duty environments. Globe valves and gate valves follow, supported by extensive use in throttling and isolation functions across industrial gas and space propulsion systems. Check and butterfly valves gain traction in secondary flow control roles, while specialty valve types serve niche low-leakage and ultra-high-purity applications.
- For instance, Parker Hannifin’s own cryogenic‑ball valves (under its “Bestobell” line) are designed to be about 30 % lighter than equivalent full‑bore ball valves - which reduces pipe load and facilitates easier installation in LNG or gas‑handling plants.
By Valve Size
Small valves (≤2 inches) hold the dominant position with 38–40% market share, supported by their widespread integration in precision aerospace assemblies, cryogenic transfer lines, research laboratories, and compact LNG distribution systems. Their lightweight construction, high reliability, and ease of installation drive adoption across applications requiring rapid actuation and tight flow regulation. Medium-sized valves (2–6 inches) show steady demand in mid-scale industrial gas distribution, while large (6–12 inches) and extra-large (>12 inches) valves cater to LNG terminals, storage tanks, and heavy-duty defense platforms where high flow capacity is essential.
- For instance, Habonim’s cryogenic ball‑valve series such as the “C28” supports diameters from ¼‑inch (DN8) up to 8‑inch (DN200), covering the small‑valve domain, with temperature ratings from –269 °C up to +200 °C and pressure class up to ANSI Class 2500 (414 bar / 6000 psi) under full certification.
By Application
Aerospace manufacturing and testing emerges as the leading application with 30–32% share, driven by extensive use of cryogenic valves in rocket propulsion testing, upper-stage fuel systems, leak-testing modules, and high-purity liquid oxygen (LOX) and liquid hydrogen (LH2) handling. The segment benefits from rising space launch activities, private spaceflight investments, and expanding cryogenic test infrastructure. Aircraft systems and GSE contribute significantly through their dependence on low-temperature fuel management and environmental control systems, while defense and military applications leverage cryogenic valves for missile propulsion, surveillance platforms, and strategic fuel storage networks.
Key Growth Drivers
1. Rising LNG Trade and Infrastructure Expansion
Global LNG consumption continues to accelerate as countries transition toward cleaner energy, driving substantial investment in liquefaction plants, regasification terminals, and cryogenic storage networks. This expansion significantly increases demand for high-performance cryogenic valves that can withstand extreme temperatures while ensuring leak-tight operation. Large-scale LNG carriers, floating storage units, and city-gas distribution networks rely heavily on ball, gate, and check valves designed for high flow and safety-critical environments. The growth of cross-border LNG trade further strengthens long-term adoption across marine, industrial, and utility sectors.
- For instance, Flowserve’s McCANNA Cryogenic Ball Valve is rated for operation down to –196 °C (–320 °F), making it suitable for LNG liquefaction, transport, and regasification applications - including carriers, storage, and regas facilities.
2. Growing Space Exploration and Satellite Launch Activities
Rapid advancements in commercial spaceflight, satellite deployment, and rocket propulsion technologies sharply elevate the need for cryogenic valves used in handling liquid oxygen, liquid hydrogen, and other ultra-low-temperature propellants. Aerospace manufacturers and testing facilities require highly reliable, precision-engineered valves to support fuel loading, ground support equipment, engine ignition systems, and high-pressure test stands. With private space agencies scaling launch frequencies and emerging countries investing in space missions, demand for cryogenic valves with precision flow control, low leakage, and robust failure tolerance continues to rise.
- For instance, Velan’s small-forged steel cryogenic valves (both globe and gate types) cover size range NPS ¼ to 2 (DN 8–50), and support pressure classes from ASME 150 up to 2500 - enabling them to operate under very high-pressure cryogenic service conditions often required for liquid hydrogen or oxygen storage and transfer.
3. Increasing Adoption of Industrial Gases Across Manufacturing
Industries such as chemicals, food processing, pharmaceuticals, electronics, and metallurgy increasingly depend on cryogenic gases like nitrogen, oxygen, and argon for cooling, preservation, and controlled-atmosphere operations. This trend fuels sustained demand for cryogenic valves that ensure safe containment and precise regulation of low-temperature gases across pipelines, transport tanks, and on-site storage. The shift toward automation and remote monitoring further supports adoption of advanced valve designs with enhanced durability, better sealing materials, and compatibility with high-purity applications, strengthening market growth across industrial and commercial sectors.
Key Trends & Opportunities
1. Growing Integration of Smart and Automated Cryogenic Valve Systems
Digitalization across energy, aerospace, and industrial sectors is creating strong opportunities for smart cryogenic valves equipped with sensors, automated actuators, and real-time diagnostics. These systems improve operational safety, detect early leakage, support predictive maintenance, and integrate seamlessly with SCADA and IoT-based monitoring platforms. As end users prioritize efficiency and reliability, opportunities are rising for manufacturers offering valves with embedded electronics, remote operation capabilities, and self-adjusting control mechanisms. Adoption is especially strong in LNG terminals, cryogenic labs, and aerospace testing facilities seeking enhanced operational intelligence.
- For instance, BAC offers cryogenic ball valves rated to –196 °C (–320 °F), capable of handling LNG / LPG / cryogenic gases with full‑bore or reduced-bore designs.
2. Expansion of Hydrogen Economy and Cryogenic Fuel Applications
Growing investments in green hydrogen production, fueling infrastructure, and hydrogen-powered mobility create significant opportunities for ultra-low-temperature valves capable of handling liquid hydrogen (LH2). As countries establish hydrogen corridors, refueling stations, and large-scale storage facilities, demand for high-integrity cryogenic valves increases across transport, industrial use, and power generation. Hydrogen’s stringent safety requirements drive adoption of valves with superior sealing, low permeation materials, and precision actuation. This emerging energy ecosystem positions cryogenic valve manufacturers to benefit from long-term growth tied to global decarbonization.
- For instance, Powell Valves manufactures cryogenic valves that are rated for service temperatures as low as –423 °F (–253 °C). This temperature range is relevant for handling liquid hydrogen (LH2), and the company offers these valves in a wide size range from ½" up to 60" pipe size.
3. Rising Use of Lightweight and Advanced Alloys in Valve Manufacturing
A shift toward lightweight, corrosion-resistant materials such as stainless steel, aluminum alloys, and nickel-based superalloys is creating new opportunities in aerospace and LNG applications. These advanced materials reduce valve weight, enhance durability, and improve thermal shock resistance, making them ideal for cryogenic environments. Manufacturers increasingly invest in improved machining, additive manufacturing, and advanced coating technologies to produce high-reliability components. This trend supports broader adoption in compact aircraft systems, space vehicles, and portable gas transport systems where weight and thermal stability are critical performance factors.
Key Challenges
1. High Cost of Materials, Testing, and Certification
Cryogenic valves require premium materials, precision machining, and rigorous quality testing to ensure safe operation at ultra-low temperatures. These processes significantly increase production costs, particularly for valves used in aerospace, LNG transport, and hydrogen systems where failure tolerance is extremely low. Compliance with stringent standards-such as ISO, API, and aerospace-specific certifications-adds further expense and complexity. These cost pressures challenge small and mid-sized manufacturers while limiting adoption in cost-sensitive markets, especially in developing regions with budget constraints for cryogenic infrastructure.
2. Technical Complexity and Risk of Leakage in Extreme Conditions
Achieving zero-leakage performance and long-term reliability in cryogenic environments remains a major challenge due to thermal contraction, rapid temperature cycling, and seal degradation at −196°C and below. Even minor design flaws can lead to operational failures, safety hazards, and costly downtime. Maintaining valve integrity for high-pressure cryogenic fluids like LNG and LH2 requires advanced sealing technologies, precise assembly, and robust material selection. These technical complexities increase failure risks, demand specialized expertise, and require continuous R&D investment to meet evolving application requirements.
Regional Analysis
North America
North America holds approximately 33–35% of the cryogenic valves market, supported by strong LNG infrastructure, advanced aerospace programs, and expanding hydrogen development initiatives. The U.S. leads adoption through extensive investments in LNG export terminals, industrial gas production facilities, and space launch operations driven by NASA and commercial space companies. The region’s mature petrochemical base and rising demand for liquid nitrogen and oxygen across healthcare, electronics, and food processing further strengthen market growth. Strict safety standards, robust valve manufacturing capabilities, and increasing adoption of automated valve technologies enhance the region’s competitive positioning in high-performance cryogenic applications.
Europe
Europe accounts for nearly 28–30% of global market share, driven by strong activity in industrial gases, space exploration programs, and the region’s leadership in the hydrogen economy. Countries such as Germany, France, the U.K., and the Netherlands invest heavily in cryogenic storage, green hydrogen production, and LNG import infrastructure. The European Space Agency’s propulsion and testing programs contribute to consistent demand for precision-engineered valves capable of ultra-low-temperature performance. Regulatory emphasis on energy transition and carbon reduction accelerates adoption of hydrogen-compatible cryogenic valves, while growth in pharmaceuticals and food preservation further supports regional market expansion.
Asia-Pacific
Asia-Pacific leads in growth momentum and holds 32–34% share, driven by rapid industrialization, LNG import expansion, and aerospace advancements across China, Japan, India, and South Korea. The region’s large-scale investments in petrochemicals, electronics manufacturing, and cold-chain logistics significantly boost demand for cryogenic valves used in oxygen, nitrogen, and argon handling. China’s expanding space exploration initiatives and Japan’s strong hydrogen mobility programs further accelerate adoption. Growing LNG consumption, urbanization-led industrial gas usage, and rising presence of global valve manufacturers strengthen Asia-Pacific’s position as the fastest-growing market for high-capacity and precision cryogenic valve systems.
Latin America
Latin America represents around 6–8% of the market, supported by increasing LNG import activities, expanding industrial gas usage, and emerging hydrogen demonstration projects. Brazil, Mexico, and Argentina lead adoption due to rising demand for nitrogen and oxygen in chemicals, steel, healthcare, and food industries. LNG terminal development and cleaner energy initiatives create new opportunities for cryogenic valves in marine transport and regasification facilities. While the region’s aerospace sector is comparatively smaller, growing involvement in satellite integration and testing supports niche demand. Regulatory modernization and increasing foreign investments continue to strengthen market penetration across key economies.
Middle East & Africa
The Middle East & Africa region holds 5–7% market share, primarily driven by LNG liquefaction projects, industrial gas production, and rising hydrogen economy initiatives in the Gulf states. The UAE, Qatar, and Saudi Arabia invest heavily in cryogenic infrastructure for LNG exports and emerging green hydrogen supply chains, generating significant demand for high-performance valves. Africa’s adoption is supported by growing medical oxygen requirements, mining industry expansion, and gradual development of LNG-based power generation. Although aerospace applications remain limited, increasing industrialization and energy diversification initiatives progressively expand the region’s role in the global cryogenic valves market.
Market Segmentations:
By Valve Type:
- Ball Valves
- Globe Valves
By Valve Size:
- Small Valves (≤2 inches)
- Medium Valves (2-6 inches)
By Application:
- Aircraft Systems
- Ground Support Equipment (GSE)
By Geography
- North America
- U.S.
- Canada
- Mexico
- Europe
- Germany
- France
- U.K.
- Italy
- Spain
- Rest of Europe
- Asia Pacific
- China
- Japan
- India
- South Korea
- South-east Asia
- Rest of Asia Pacific
- Latin America
- Brazil
- Argentina
- Rest of Latin America
- Middle East & Africa
- GCC Countries
- South Africa
- Rest of the Middle East and Africa
Competitive Landscape
The competitive landscape of the Cryogenic Valves Market includes major players such as Parker Hannifin Corporation, Habonim Valve Solutions, Flowserve, Velan Inc., BAC Valves, Powell Valves, Herose GmbH, L&T, Emerson Electric Co., and Bray International, Inc. the Cryogenic Valves Market is defined by a mix of global valve manufacturers, specialized cryogenic engineering companies, and emerging technology providers focused on high-performance flow control for ultra-low-temperature applications. Competitors differentiate themselves by investing in advanced sealing materials, precision machining capabilities, and rigorous cryogenic testing to ensure reliability in LNG, industrial gas, hydrogen, aerospace, and defense environments. Market players emphasize innovation in automated actuation, digital monitoring, and IoT-enabled valve diagnostics to support predictive maintenance and improve safety. Many companies are expanding manufacturing footprints near LNG terminals and industrial gas hubs, enabling faster delivery and enhanced customization. Strategic partnerships with EPC contractors, space agencies, and hydrogen infrastructure developers strengthen market positions. The push toward lighter alloys, improved corrosion resistance, and compatibility with liquid hydrogen opens new opportunities, while strict performance certifications and rising customer expectations continue to intensify competition across global and regional markets.
Key Player Analysis
- Parker Hannifin Corporation
- Habonim Valve Solutions
- Flowserve
- Velan Inc.
- BAC Valves
- Powell Valves
- Herose GmbH
- L&T
- Emerson Electric Co.
- Bray International, Inc.
Recent Developments
- In September 2025, Ohio Valve Company opens Valve World Headquarters in Houston, aiming to be a global hub for innovation, operational excellence, and industry leadership in valve manufacturing.
- In June 2025, KITZ Corporation has been entrusted with the development of valves crucial to the life support of astronauts in the International Habitation module (I-Hab). This contract highlights KITZ Corporation's expertise in cryogenic valve applications for space exploration.
- In January 2025, InflowControl launched the Gas Autonomous Inflow Control Valve (Gas AICV), the first autonomous flow control valve designed specifically for gas reservoirs. This technology aims to improve gas production efficiency by automatically preventing water from entering the flow path when water breakthrough occurs, while allowing gas and condensate to continue flowing.
- In January 2025, Baker Hughes won a contract from Bechtel to supply gas-technology equipment, including eight main refrigeration compressors, for two liquefaction trains totaling 11 MTPA in Louisiana.
Report Coverage
The research report offers an in-depth analysis based on Valve Type, Valve Size, Application and Geography. It details leading market players, providing an overview of their business, product offerings, investments, revenue streams, and key applications. Additionally, the report includes insights into the competitive environment, SWOT analysis, current market trends, as well as the primary drivers and constraints. Furthermore, it discusses various factors that have driven market expansion in recent years. The report also explores market dynamics, regulatory scenarios, and technological advancements that are shaping the industry. It assesses the impact of external factors and global economic changes on market growth. Lastly, it provides strategic recommendations for new entrants and established companies to navigate the complexities of the market.
Future Outlook
- The market will expand steadily as LNG infrastructure grows across import, export, and storage facilities.
- Adoption of cryogenic valves will rise with accelerating investments in hydrogen production, transport, and fueling networks.
- Aerospace and space exploration programs will increase demand for high-precision valves handling liquid oxygen and liquid hydrogen.
- Manufacturers will focus on smart, automated valve systems equipped with sensors and digital monitoring capabilities.
- Material innovation will advance, with lightweight alloys and enhanced sealing technologies gaining wider use.
- Industrial gas consumption in chemicals, healthcare, and electronics will continue strengthening long-term valve demand.
- Emerging economies will invest more in cryogenic storage and distribution, expanding regional market opportunities.
- Sustainability goals will drive adoption of energy-efficient valves with lower leakage and improved thermal performance.
- Partnerships among valve producers, EPC contractors, and energy developers will intensify for large-scale projects.
- Regulatory emphasis on safety and performance standards will push manufacturers toward more rigorous testing and certification.
Request a Free Sample
Fill in your details and we'll send you a free sample report.
- Sample data tables & charts
- Research methodology
Need a Custom Version of This Report?
Tailor the scope, geography, or segments to your exact requirements.
- Custom geography or segment scope
- Direct access to our analyst team
Frequently Asked Questions
What is the current market size for the Cryogenic Valves Market, and what is its projected size in 2032?
At what Compound Annual Growth Rate is the Cryogenic Valves Market projected to grow between 2025 and 2032?
Which Cryogenic Valves Market segment held the largest share in 2024?
What are the primary factors fueling the growth of the Cryogenic Valves Market?
Who are the leading companies in the Cryogenic Valves Market?
Which region commanded the largest share of the Cryogenic Valves Market in 2024?
Table of Content
Chapter 1. Report Introduction
- 1.1 Report Description & Purpose
- 1.1.1 Report Title & Market Definition
- 1.1.2 Unique Selling Propositions (USP) & Key Differentiators
- 1.1.3 Value Proposition for Stakeholders
- 1.2 Research Objectives
- 1.2.1 Market Sizing Objectives (Volume & Revenue) (Volume Where Applicable)
- 1.2.2 Segmentation Objectives
- 1.2.3 Competitive Intelligence Objectives
- 1.2.4 Forecast & Scenario Objectives
- 1.3 Report Scope
- 1.3.1 Cryogenic Valves Scope – Segments & Subsegments Covered
- 1.3.2 Geographic Scope – Regions & Countries Covered
- 1.3.3 Historical Period, Base Year & Forecast Period (2024; forecast to 2032)
- 1.3.4 Inclusions & Exclusions
- 1.4 Industry Classification & Applicable Codes
- 1.5 Currency, Measurement Units & Valuation Basis
- 1.6 Target Stakeholders
- 1.7 Limitations & Assumptions
Chapter 2. Executive Summary
- 2.1 Global Cryogenic Valves Market Snapshot
- 2.1.1 Market Size – Historical (2024) & Forecast (2024-2032) (2024: USD 4.64 billion → 2032: USD 9.09 billion)
- 2.1.2 Volume & Revenue – Global Totals (Volume Where Applicable)
- 2.1.3 Key Market Highlights – Top Five Facts
- 2.2 Cryogenic Valves Market Segmentation Snapshot
- 2.2.1 Market Split by Region – 2024 vs. 2032
- 2.3 Competitive Snapshot
- 2.3.1 Top 10 Players by Revenue Share – 2024
- 2.3.2 Top 10 Players by Volume Share – 2024 (Volume Where Applicable)
- 2.3.3 Recent Strategic Developments (18-Month Summary)
- 2.4 Key Investment Highlights & Strategic Conclusions
Chapter 3. Cryogenic Valves Market Dynamics & Industry Analysis
- 3.1 Market Overview & Context
- 3.1.1 Cryogenic Valves Market Position in the Broader Industry Value Chain
- 3.1.2 Demand Structure & Purchasing Dynamics
- 3.1.3 Market Maturity & Development Stage by Region
- 3.2 Cryogenic Valves Market Drivers
- 3.3 Cryogenic Valves Market Restraints & Challenges
- 3.4 Cryogenic Valves Market Opportunities
- 3.5 Porter's Five Forces Analysis
- 3.5.1 Threat of New Entrants
- 3.5.2 Bargaining Power of Suppliers
- 3.5.3 Bargaining Power of Buyers
- 3.5.4 Threat of Substitutes
- 3.5.5 Competitive Rivalry – Intensity Assessment
- 3.6 Cryogenic Valves Value Chain Analysis
- 3.6.1 Upstream – Key Inputs, Resources & Suppliers
- 3.6.1.1 Key Input/Resource 1
- 3.6.1.2 Key Input/Resource 2
- 3.6.1.3 Key Input/Resource 3
- 3.6.2 Midstream – Core Operations & Value Creation
- 3.6.2.1 Operating Model & Process Overview
- 3.6.2.2 Key Operating Locations & Capabilities by Company
- 3.6.3 Downstream – Market Channels & End Users
- 3.6.3.1 Direct Sales & Customer Engagement Channels
- 3.6.3.2 Indirect Sales, Intermediaries & Partner Channels
- 3.6.4 Value Chain Profitability Analysis
- 3.6.1 Upstream – Key Inputs, Resources & Suppliers
- 3.7 PESTEL Analysis
- 3.7.1 Political Factors
- 3.7.2 Economic Factors
- 3.7.3 Social Factors
- 3.7.4 Technological Factors
- 3.7.5 Environmental Factors
- 3.7.6 Legal Factors
- 3.8 Cryogenic Valves Supply Chain Analysis
- 3.8.1 Critical Input & Resource Availability Risk Assessment
- 3.8.2 Supplier & Operational Concentration Risk (Geographic Exposure)
- 3.8.3 Supply & Service Disruption Impact Analysis
- 3.9 Regulatory & Policy Landscape
Note: The regulatory and policy landscape section covers regulations based on their applicability to the market, Cryogenic Valves category, geography, and scope of the study. Only regulatory frameworks with a material impact on operations, compliance, trade, sustainability, or market access are analyzed in detail.
Chapter 4. Key Investment Pockets & Opportunity Analysis
- 4.1 Cryogenic Valves Market Attractiveness Analysis
- 4.1.1 By Region – Investment Attractiveness Matrix (Market Size × CAGR)
- 4.2 Absolute Revenue Growth Opportunity
- 4.2.1 By Region – Absolute Revenue Growth Through 2032
- 4.3 Incremental Demand Opportunity
- 4.3.1 By Region – Incremental Demand Through 2032
- 4.3.2 Segment – Incremental Demand
- 4.4 Emerging Submarket Opportunity Deep Dive (Subject to Applicability)
- 4.5 Priority Market Opportunity Scorecards
- 4.5.1 United States
- 4.5.2 Europe
- 4.5.3 Asia
- 4.5.4 Middle East & Africa
Note: Priority market opportunity scorecards reflect the geographic scope and strategic relevance of the study. Listed markets are indicative and may be adapted to the industry.
Chapter 5. Cryogenic Valves Cross-Border Trade & Market Access Analysis
- 5.1 International Trade & Cross-Border Activity Overview
- 5.1.1 Global Export Value by Country (2024)
- 5.1.2 Global Export Volume by Country (2024) (Volume Where Applicable)
- 5.1.3 Global Import Value by Country (2024)
- 5.1.4 Global Import Volume by Country (2024) (Volume Where Applicable)
- 5.1.5 Net Trade Balance by Country (2024)
- 5.2 Export Analysis – Segment
- 5.2.1 Category 1 (Applicable Classification Code)
- 5.2.2 Category 2 (Applicable Classification Code)
- 5.2.3 Category 3 (Applicable Classification Code)
- 5.2.4 Category 4 (Applicable Classification Code)
- 5.2.5 Category 5 (Applicable Classification Code)
- 5.3 Import Analysis – Segment
- 5.3.1 Category 1 (Applicable Classification Code)
- 5.3.2 Category 2 (Applicable Classification Code)
- 5.3.3 Category 3 (Applicable Classification Code)
- 5.3.4 Category 4 (Applicable Classification Code)
- 5.3.5 Category 5 (Applicable Classification Code)
- 5.4 Cross-Border Pricing & Transaction Benchmarks
- 5.4.1 Export Pricing – Segment & Country
- 5.4.2 Import Pricing – Segment & Source Country
- 5.4.3 Price Trends (2024)
- 5.5 Key Cross-Border Trade & Delivery Routes
- 5.5.1 Cross-Border Trade/Delivery Route 1
- 5.5.2 Cross-Border Trade/Delivery Route 2
- 5.5.3 Cross-Border Trade/Delivery Route 3
- 5.5.4 Cross-Border Trade/Delivery Route 4
- 5.5.5 Cross-Border Trade/Delivery Route 5
- 5.6 Trade Policy & Market Access Impact Assessment
- 5.6.1 Tariff & Non-Tariff Barriers
- 5.6.2 Regional Trade & Economic Integration Frameworks
- 5.6.3 Bilateral & Multilateral Trade Agreements
- 5.6.4 Cross-Border Operating, Licensing & Localization Requirements
Note: This chapter applies where cross-border trade or delivery is relevant to Cryogenic Valves. Goods, services, and digital offerings are assessed using applicable classifications and transaction measures. Import-export volumes, trade balances, and route analyses are included only where meaningful to the market.
Chapter 6. Competitive Landscape & Company Benchmarking
- 6.1 Cryogenic Valves Market Concentration & Structure
- 6.1.1 Herfindahl-Hirschman Index (HHI) – the historical period vs. 2024
- 6.1.2 Leading, Mid-Sized & Emerging Player Structure
- 6.1.3 Global, Regional & Local Player Dynamics
- 6.2 Cryogenic Valves Market Share Analysis – 2024
- 6.2.1 Global Revenue Share by Company
- 6.2.2 Global Volume Share by Company (Volume Where Applicable)
- 6.2.3 Regional Revenue Share
- 6.2.4 Market Share Evolution (the historical period vs. 2024)
- 6.2.5 Company Market Share by Key Segment
- 6.2.6 Company Market Share by Customer Group
- 6.3 Operating Scale, Capacity & Infrastructure Analysis
- 6.3.1 Global Operating Scale & Supply Capacity
- 6.3.2 Resource Utilization & Operating Efficiency
- 6.3.3 Output, Service Delivery & Activity Metrics
- 6.3.4 Operating Footprint & Infrastructure Map
- 6.3.5 Planned Operational & Capacity Expansion
- 6.4 Cryogenic Valves Competitive Benchmarking Matrix
- 6.4.1 Revenue, Growth, Profitability & Operating Metric Comparison
- 6.4.2 Channel Revenue Mix
- 6.4.3 Geographic Revenue Exposure
- 6.4.4 R&D Intensity
- 6.4.5 Sustainability Maturity
- 6.5 Strategic Developments in Cryogenic Valves (Last 24 Months)
- 6.5.1 Mergers, Acquisitions & Divestments
- 6.5.2 New Products, Services & Solutions in Cryogenic Valves
- 6.5.3 Operational & Infrastructure Expansions
- 6.5.4 Strategic Alliances, Joint Ventures & Partnerships
- 6.5.5 Distribution Expansion & Market Entry
- 6.5.6 Sustainability & ESG Initiatives
- 6.6 Competitive Strategy Mapping
- 6.6.1 Leader, Challenger, Follower & Niche Classification
- 6.6.2 Pricing Strategy Comparison
- 6.6.3 Channel Strategy Matrix
Note: Strategic developments are included based on their materiality and the availability of reliable information.
Chapter 7. Global Cryogenic Valves Market – By Sales & Delivery Channel
- 7.1 Segment Overview
- 7.1.1 Volume & Revenue Split by Channel (2024 & 2032) (Volume Where Applicable)
- 7.1.2 Channel Mix Evolution (2024-2032)
Chapter 8. Regional Market Analysis – Global Overview
- 8.1 Global Regional Overview
- 8.1.1 Regional Volume Share (Volume Where Applicable)
- 8.1.2 Regional Revenue Share
- 8.1.3 Regional Volume by Region (Volume Where Applicable)
- 8.1.4 Regional Revenue by Region
- 8.1.5 Regional Forecast Through 2032
- 8.2 Cross-Regional Segment Analysis
- 8.2.1 By Sales & Delivery Channel
- 8.2.2 By Competitive Positioning & Price Tier
Chapter 9. North America Cryogenic Valves Market
- 9.1 United States
- 9.2 Canada
- 9.3 Mexico
Chapter 10. Europe Cryogenic Valves Market
- 10.1 Germany
- 10.2 France
- 10.3 Italy
- 10.4 United Kingdom
- 10.5 Spain
- 10.6 Poland
- 10.7 Russia
- 10.8 Netherlands
- 10.9 Belgium
- 10.10 Sweden
- 10.11 Denmark
- 10.12 Norway
- 10.13 Rest of Europe
Chapter 11. Asia Pacific Cryogenic Valves Market
- 11.1 China
- 11.2 India
- 11.3 Japan
- 11.4 South Korea
- 11.5 Thailand
- 11.6 Indonesia
- 11.7 Vietnam
- 11.8 Malaysia
- 11.9 Australia
- 11.10 Rest of Asia Pacific
Chapter 12. Latin America Cryogenic Valves Market
- 12.1 Brazil
- 12.2 Argentina
- 12.3 Colombia
- 12.4 Chile
- 12.5 Rest of Latin America
Chapter 13. Middle East Cryogenic Valves Market
- 13.1 Saudi Arabia
- 13.2 United Arab Emirates
- 13.3 Turkey
- 13.4 Israel
- 13.5 Iran
- 13.6 Rest of the Middle East
Chapter 14. Africa Cryogenic Valves Market
- 14.1 South Africa
- 14.2 Egypt
- 14.3 Nigeria
- 14.4 Morocco
- 14.5 Rest of Africa
Chapter 15. Cryogenic Valves Company Profiles
- 15.1 [Company 01]
- 15.1.1 Company Overview
- 15.1.2 Key Management Personnel
- 15.1.3 Products & Services Portfolio
- 15.1.4 Financial Performance
- 15.1.5 Key Market Focus & Geographic Presence
- 15.1.6 Recent Developments & Strategic Initiatives
Note: The company profile list is preliminary and may change based on research findings, market developments, data availability, and client requirements.
Chapter 16. Appendices
- Appendix A – List of Abbreviations & Acronyms
- Appendix B – Industry Classification Code Reference – Full Series
- Appendix C – Supply, Output & Operating Capacity Data Tables
- Appendix D – End-Use & Demand Base Tables
- Appendix E – Demand, Adoption & Usage Assumptions
- Appendix F – Pricing & Revenue Metric Reference Tables
- Appendix G – Company Operations & Infrastructure Database
- Appendix H – Cross-Border Trade & Activity Data Tables (Where Applicable)
- Appendix I – Regulatory Summary Tables
- Appendix J – Primary Research Participant List (Anonymized)
- Appendix K – Primary Research Questionnaire Framework
- Appendix L – Data Sources & Bibliography
- Appendix M – Market Size Divergence & Source Comparison
Chapter 17. Research Methodology
- 17.1 Research Framework & Philosophy
- 17.2 Secondary Research – Sources, Hierarchy & Data Extraction
- 17.3 Data Modeling – Bottom-Up & Top-Down Market Sizing
- 17.4 Primary Research – Stakeholder Framework, LOI & Sample Sizes
- 17.5 Forecast Methodology – Regression, Scenario & Sensitivity Analysis
- 17.6 Quality Control – Four-Layer Validation Framework
- 17.7 Limitations & Standard Assumptions
- 17.8 Disclaimer
