
Market Overview:
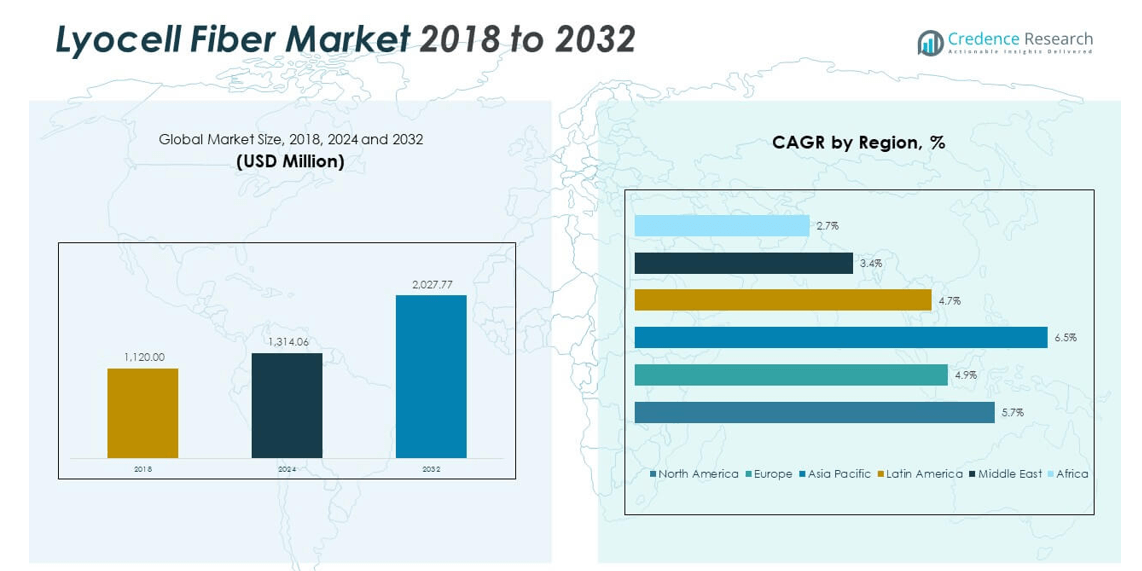
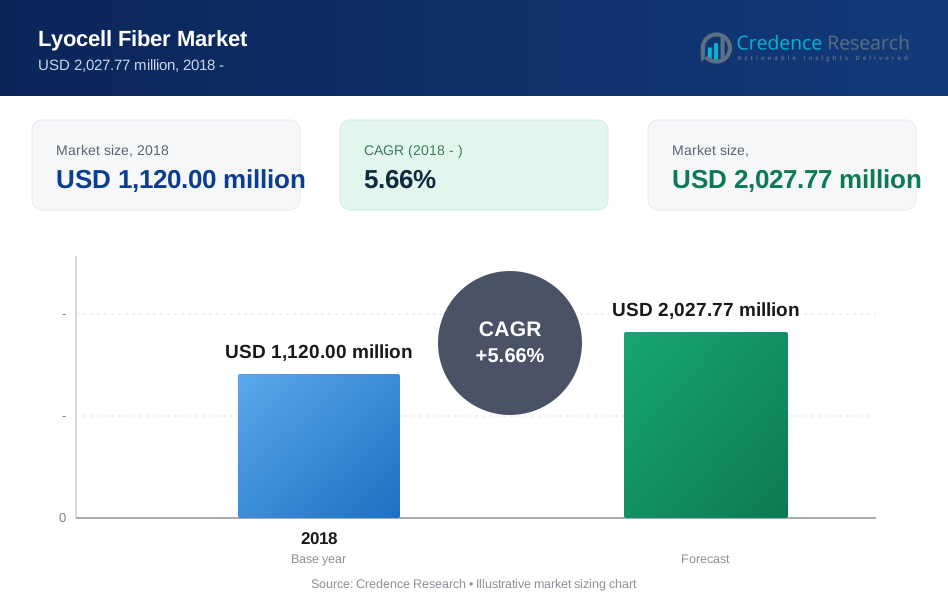
The GLOBAL LYOCELL FIBER MARKET size was valued at USD 1,120.00 million in 2018 to USD 1,314.06 million in 2024 and is anticipated to reach USD 2,027.77 million by 2032, at a CAGR of 5.66% during the forecast period.
| REPORT ATTRIBUTE | DETAILS |
|---|---|
| Historical Period | 2020-2023 |
| Base Year | 2024 |
| Forecast Period | 2025-2032 |
| Lyocell Fiber Market Size 2024 | USD 1,314.06 million |
| Lyocell Fiber Market, CAGR | 5.66% |
| Lyocell Fiber Market Size 2032 | USD 2,027.77 million |
Rising adoption of intelligent building systems drives stronger uptake across commercial and industrial sites. Companies integrate IoT sensors and automated control platforms to cut operational waste and improve asset reliability. Facility teams shift to predictive tools that support faster decisions and reduce downtime. Smart platforms offer real-time visibility that helps operators maintain safer and more productive spaces. Cloud dashboards support remote oversight for multi-site enterprises. Demand strengthens across new construction and retrofit activities.
The GLOBAL LYOCELL FIBER MARKET gains momentum across mature regions with high adoption of digital infrastructure. North America leads due to strong penetration of connected building systems and advanced energy-management tools. Europe follows with active government support for sustainability and smart-city programs. Asia Pacific emerges as the fastest-growing region due to rapid urban development and expanding commercial assets. Middle East markets grow through large-scale infrastructure upgrades and modern business districts. Latin America advances with rising investment in automation and security solutions. Each region adopts smart facility tools based on building maturity and digital readiness.
Market Insights:
- The GLOBAL LYOCELL FIBER MARKET was USD 1,120.00 million in 2018, reached USD 1,314.06 million in 2024, and is projected to hit USD 2,027.77 million by 2032 at a CAGR of 5.66%.
- Asia Pacific leads with 00% due to strong textile production; Europe follows with 25.43% driven by sustainability rules; North America holds 23.85% supported by high adoption of advanced manufacturing systems.
- Asia Pacific is the fastest-growing region with 00%, supported by expanding apparel exports, rising eco-fiber demand, and large-scale manufacturing capacity.
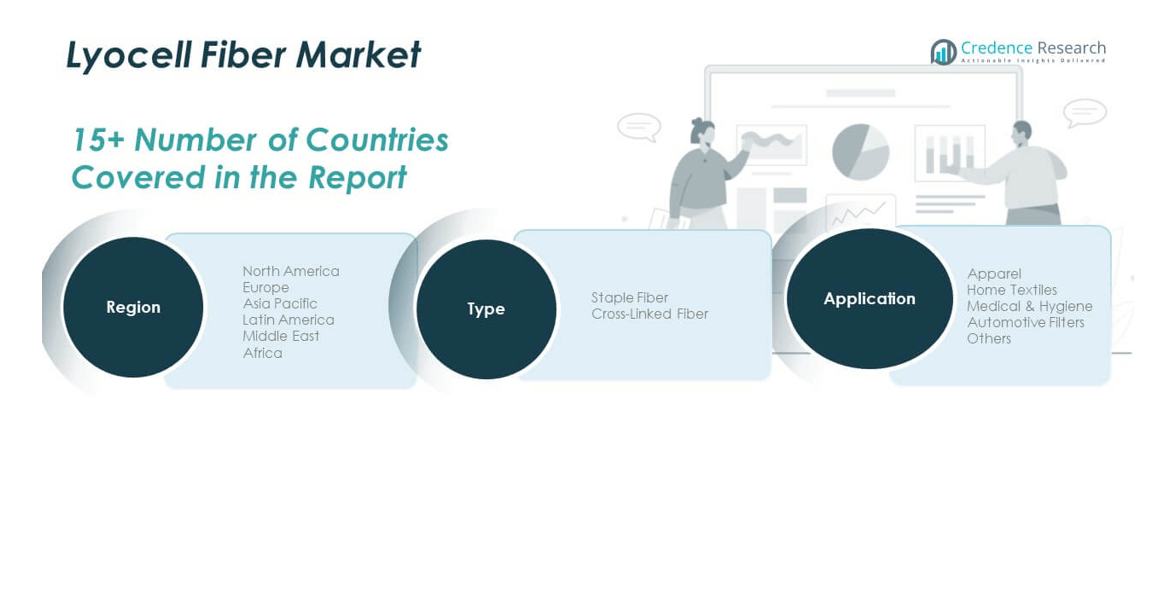
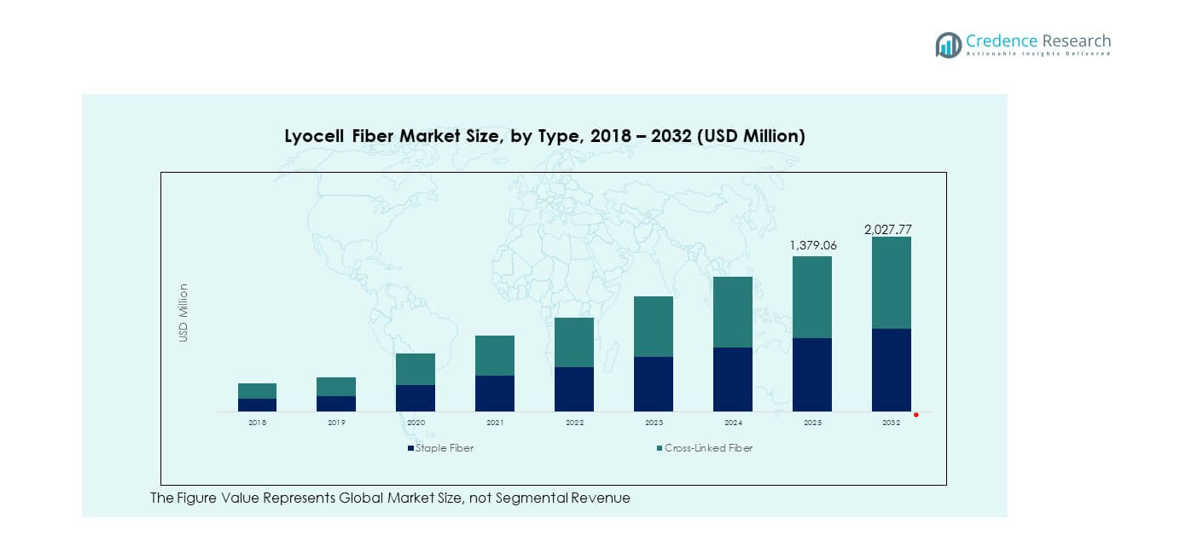
- Staple Fiber holds the larger share in the chart, reflecting its high-volume use across apparel and home textiles.
- Cross-Linked Fiber shows a smaller but steady share, driven by rising demand in durable industrial and hygiene applications.
Market Drivers:
Growing Demand for Intelligent Building Automation
The GLOBAL LYOCELL FIBER MARKET expands due to strong interest in automated systems that improve speed and accuracy across operations. Building owners invest in smart controls that support safer spaces and better energy use. Predictive tools give teams insight into faults before disruptions arise. IoT sensors help staff track equipment life and set timely tasks for field teams. Cloud dashboards support remote supervision for multi-site networks. Facility leaders adopt real-time alerts that guide fast response during critical events. Smart workflows cut manual errors and improve overall productivity. Companies continue shifting toward integrated platforms that unify key building functions.
- For instance, Siemens’ Desigo CC platform integrates more than 2,000 device points in large facilities and supports AI-based fault detection features deployed across global enterprise sites.
Rising Focus on Energy Efficiency and Cost Control
Growing operational pressure drives enterprises toward solutions that lower long-term spending. Smart meters track energy patterns and highlight areas that need improvement. Automation tools reduce unnecessary loads and support better use of HVAC assets. Predictive analytics helps leaders schedule maintenance before failures damage key systems. Smart lighting keeps spaces efficient through occupancy patterns and daylight inputs. Real-time monitoring supports faster corrections that lift operational discipline. It encourages higher compliance with green standards and industry rules. Organizations across public and private sectors adopt energy-focused systems to gain stable savings.
- For instance, Schneider Electric’s EcoStruxure Building solution has delivered energy savings of up to 30% across commercial buildings and manages more than 42 million connected assets worldwide.
Expansion of Connected Devices Across Commercial Spaces
Rapid use of IoT devices increases demand for smarter facility networks. Connected sensors deliver real-time data that helps managers detect anomalies. Automated ticketing systems guide technicians toward tasks with higher urgency. Remote access platforms allow supervisors to track asset health across regions. Smart workplace tools improve resource planning and workforce productivity. AI-driven insights support more accurate predictions for critical equipment. User-friendly dashboards help staff understand performance gaps. Facility owners move to scalable systems that grow with digital expansion.
Growing Shift Toward Predictive and Proactive Maintenance Models
Predictive models reduce downtime and strengthen equipment reliability across facilities. AI platforms study past patterns to guide precise maintenance schedules. Automated alerts help teams fix minor issues before larger failures occur. Digital twins offer simulations that improve decision-making accuracy. Smart tools support tech teams by providing live benchmarks for asset behavior. Better planning reduces emergency repairs that strain budgets. It encourages broader adoption of continuous monitoring tools across sectors. Enterprises choose proactive models to safeguard uptime and protect capital assets.
Market Trends:
Increasing Adoption of Integrated Facility Experience Platforms
The GLOBAL LYOCELL FIBER MARKET observes rising preference for unified platforms that connect multiple building functions. Integrated systems combine security, HVAC, lighting, and maintenance into one workflow. Centralized dashboards improve visibility and reduce navigation time for staff. Mobile-first interfaces give teams access to insights from any location. Smart workplace apps enhance user comfort and ensure smoother daily operations. Integration also cuts duplication across software assets. AI modules strengthen personalization for workspace users. Enterprises invest in experience-focused tools that support flexible work environments.
- For instance, Honeywell’s Forge platform manages more than 100 million building data points per day and supports unified control across over 10,000 global sites.
Growth of Autonomous and Robotics-Based Facility Operations
Autonomous service robots gain wider use in cleaning, inspection, and logistics tasks. Robotics supports safer work by reducing direct contact in high-risk zones. Automated navigation improves consistency during repetitive duties. Smart mapping tools direct robots to cover large areas efficiently. AI systems allow machines to adjust routes based on real-time obstacles. Robotics helps teams maintain reliability during labor shortages. It also reduces delays caused by manual workloads. Large campuses deploy robots to strengthen service quality and daily performance.
- For instance, SoftBank Robotics’ Whiz cleaning robot operates with HEPA filtration and has logged over 8 million kilometers of autonomous cleaning across corporate facilities worldwide.
Rise of Cybersecure Facility Ecosystems
Growing digital exposure drives demand for enhanced cyber protection across facility systems. Organizations secure connected devices through encrypted channels and strict authentication. Monitoring tools detect unusual patterns faster and help prevent disruptions. Zero-trust frameworks support safer exchanges within building networks. Regular updates keep systems aligned with emerging threats. Smart platforms feature built-in protections that shield vital assets. Risk teams use real-time logs to track suspicious events. Operators prioritize cyber health to maintain trust during digital expansion.
Expansion of Remote Operations and Virtual Facility Support
Remote facility control expands due to flexible work and multi-site operations. Virtual monitoring tools help teams track performance without physical presence. Live dashboards improve accuracy during decision tasks. Remote troubleshooting reduces travel time for technicians. Augmented-reality support tools guide field teams during complex repairs. Cloud-based systems keep data secure during remote sessions. It helps teams maintain operational continuity during workforce shifts. Companies invest in virtual facility models to reduce disruptions and raise efficiency.
Market Challenges Analysis:
High Integration Complexity and Limited Interoperability Across Systems
Implementation in the GLOBAL LYOCELL FIBER MARKET becomes difficult when legacy systems fail to align with modern tools. Organizations struggle to merge old assets with newer IoT modules. Fragmented device networks create delays in data flow and maintenance tasks. Vendors often use different communication standards that restrict scalability. Operators need trained teams to handle complex deployments. Budget limits delay upgrades across large properties. Interoperability gaps lead to errors that reduce performance. Enterprises face long deployment cycles that slow transformation.
Cybersecurity Risks, Skill Shortages, and Resistance to System Modernization
Cyber threats increase concerns around connected facilities in many regions. Security gaps expose systems to unauthorized access and operational damage. Enterprises lack skilled workers who manage both technical and physical infrastructure. Training demands rise as systems become more automated. Many organizations show resistance toward replacing legacy tools that feel familiar. Budget limits block rapid upgrades that improve building safety. It forces operators to delay essential modernization steps. Companies balance risk, cost, and workforce capability during digital adoption.
Market Opportunities:
Growing Investment in Smart Infrastructure Programs and Digital Building Upgrades
The GLOBAL LYOCELL FIBER MARKET gains new prospects from rising national and corporate smart infrastructure plans. Governments support modernization through advanced digital frameworks and sustainability targets. Enterprises shift budgets toward intelligent building upgrades to meet new standards. Expanding IoT networks open room for scalable deployments across sectors. Cloud-first platforms improve collaboration between dispersed teams. AI-driven tools help owners gain better forecasting capabilities. It encourages broader adoption across commercial, industrial, and public assets. Integrated modernization creates long-term value for new entrants and established firms.
Rapid Expansion of Smart Workplaces, Green Buildings, and Predictive Ecosystems
Demand for smart workplaces gives vendors strong entry opportunities across high-growth regions. Enterprises adopt tools that enhance user comfort and reduce energy stress. Green building programs promote wider investments in digital systems. Predictive models help owners manage assets with higher precision. Rising sustainability rules increase interest in resource-efficient technologies. Remote work strengthens preference for flexible facility systems. It opens growth prospects for developers who offer secure, adaptive solutions. Companies use modern ecosystems to lift overall building performance.
Market Segmentation Analysis:
By Type
The GLOBAL LYOCELL FIBER MARKET shows structured adoption across major type categories. Staple fiber supports bulk deployment in large facilities due to its balance of strength and cost. Cross-linked fiber offers higher durability for environments that require stable performance under frequent operational cycles. Filament fiber gains traction in premium applications where precision and uniform texture improve functional outcomes. Specialty variants cover niche solutions that address unique facility demands in controlled settings. Each type group supports growth through specific strength profiles that meet performance and sustainability needs.
- For instance, Lenzing’s TENCEL filament yarn is produced using precision spinning technology and demonstrates tensile strength improvements of over 15% compared with standard regenerated fibers.
By Application
Apparel remains a strong demand generator led by casual wear, sportswear, innerwear, and formal wear, where comfort and breathability guide usage. Home textiles strengthen uptake across bed linen, towels, and curtains due to rising focus on soft-touch material. Medical and hygiene applications grow through wipes, hygiene pads, and bandages that support strict purity norms in sensitive environments. Industrial demand expands across filters, automotive textiles, and nonwoven industrial fabrics that require stability under heavy loads. Other niche uses help extend adoption into smaller specialty streams. Application diversity broadens the market reach, and it supports balanced development across consumer and industrial sectors.
- For instance, Aditya Birla’s TENCEL fibers are used in over 200 global apparel brands and demonstrate moisture management rates up to 50% higher than conventional cotton.
Segmentation:
- By Type
- Staple Fiber
- Cross-linked Fiber
- Filament Fiber
- Others (Specialty Variants)
- By Application
- Apparel
- Casual Wear
- Sportswear
- Innerwear
- Formal Wear
- Home Textiles
- Bed Linen
- Towels
- Curtains
- Medical & Hygiene
- Wipes
- Hygiene Pads
- Bandages
- Industrial
- Filters
- Automotive Textiles
- Nonwoven Industrial Fabrics
- Others (Niche Uses)
- By Region
- North America
- U.S.
- Canada
- Europe
- Germany
- U.K.
- France
- Italy
- Spain
- Rest of Europe
- Asia Pacific
- China
- India
- Japan
- South Korea
- Southeast Asia
- Rest of APAC
- Latin America
- Brazil
- Mexico
- Argentina
- Rest of LATAM
- Middle East
- GCC
- South Africa
- Rest of Middle East
- Africa
- South Africa
- Nigeria
- Rest of Africa
Regional Analysis:
North America
The North America GLOBAL LYOCELL FIBER MARKET size was valued at USD 272.16 million in 2018 to USD 313.53 million in 2024 and is anticipated to reach USD 482.82 million by 2032, at a CAGR of 5.7% during the forecast period. North America holds 23.85% of the global share. North America records strong adoption due to high digital maturity across enterprise buildings. The GLOBAL LYOCELL FIBER MARKET gains steady traction through rapid integration of IoT and automation. Large companies upgrade control platforms to strengthen remote supervision and predictive maintenance. It benefits from structured sustainability programs that push energy optimization across major cities. Regulatory bodies encourage efficient building operations to reduce long-term costs. Facility managers deploy cloud tools that improve decision speed and service reliability. Demand grows across healthcare, education, and commercial infrastructure. Vendors expand offerings that support hybrid workplace models across major corporate hubs.
Europe
The Europe GLOBAL LYOCELL FIBER MARKET size was valued at USD 296.24 million in 2018 to USD 334.13 million in 2024 and is anticipated to reach USD 487.18 million by 2032, at a CAGR of 4.9% during the forecast period. Europe holds 25.43% of the global share. Europe sees steady growth driven by strict sustainability regulations and advanced building standards. The GLOBAL LYOCELL FIBER MARKET moves forward as enterprises adopt intelligent systems to meet green compliance needs. Energy rules encourage installation of smart HVAC and occupancy-based automation. It expands through strong investments in smart city initiatives across major economies. Predictive models support efficient building operations and cost control for large campuses. Cloud and IoT tools help facility teams reduce downtime. Public buildings integrate digital tools to improve service delivery and operational planning. Europe maintains growth through active modernization of aging infrastructure.
Asia Pacific
The Asia Pacific GLOBAL LYOCELL FIBER MARKET size was valued at USD 435.68 million in 2018 to USD 525.42 million in 2024 and is anticipated to reach USD 864.44 million by 2032, at a CAGR of 6.5% during the forecast period. Asia Pacific holds 40.00% of the global share. Asia Pacific advances quickly due to rising construction of commercial towers, industrial parks, and digital campuses. The GLOBAL LYOCELL FIBER MARKET benefits from strong investment in connected systems across high-growth economies. Demand for real-time building intelligence increases across corporate spaces. It gains momentum through rapid expansion of smart city projects. Automation platforms support safety, compliance, and workforce productivity. Predictive maintenance tools attract interest from manufacturing and logistics hubs. Cloud-driven solutions improve scalability for multisite enterprises. Asia Pacific continues to lead in growth due to aggressive digital adoption.
Latin America
The Latin America GLOBAL LYOCELL FIBER MARKET size was valued at USD 69.78 million in 2018 to USD 81.06 million in 2024 and is anticipated to reach USD 115.93 million by 2032, at a CAGR of 4.7% during the forecast period. Latin America holds 6.17% of the global share. Latin America records gradual adoption supported by modernization of commercial complexes and public infrastructure. The GLOBAL LYOCELL FIBER MARKET benefits from interest in energy-saving systems across urban centers. Companies adopt automation tools to improve service quality in large properties. It gains traction as businesses look for cost-efficient maintenance solutions. IoT platforms help reduce operational risk across industrial sites. Digital control systems support better visibility of utilities and asset performance. Vendors expand footprints through partnerships with regional integrators. Growth remains stable due to rising awareness of smart facility benefits.
Middle East
The Middle East GLOBAL LYOCELL FIBER MARKET size was valued at USD 27.44 million in 2018 to USD 29.03 million in 2024 and is anticipated to reach USD 37.73 million by 2032, at a CAGR of 3.4% during the forecast period. The Middle East holds 2.21% of the global share. The Middle East progresses through increasing investment in modern infrastructure and large commercial developments. The GLOBAL LYOCELL FIBER MARKET gains support from high-end projects that require advanced automation. Smart building systems improve operational efficiency across new business districts. It advances due to rising demand for centralized monitoring across corporate towers. Energy-focused tools reduce load across facilities operating in warm climates. Predictive tools help owners maintain uptime across critical assets. Governments focus on digital transformation in line with national development plans. Growth remains tied to expanding construction and technology integration.
Africa
The Africa GLOBAL LYOCELL FIBER MARKET size was valued at USD 18.70 million in 2018 to USD 30.89 million in 2024 and is anticipated to reach USD 39.68 million by 2032, at a CAGR of 2.7% during the forecast period. Africa holds 2.35% of the global share. Africa observes emerging adoption as urban areas modernize public and private facilities. The GLOBAL LYOCELL FIBER MARKET grows through gradual integration of automation across commercial properties. Smart systems improve energy use and operational planning in large buildings. It benefits from rising interest in cost-efficient maintenance and monitoring tools. IoT-based solutions support better resource management across infrastructure projects. Cloud tools help organizations strengthen remote oversight of distributed assets. Vendors explore local partnerships to increase market presence. Growth remains driven by infrastructure expansion and digital readiness.
Key Player Analysis:
- Lenzing AG
- Aditya Birla Group
- Baoding Swan Fiber Co., Ltd.
- Chonbang Co., Ltd.
- Weiqiao Textile Company Limited
- Zhejiang Yaojiang Industrial Group Limited
- China Populus Textile Ltd.
- Acegreen Eco-Material Technology Co., Ltd.
- Smartfiber AG
- Nien Foun Fiber Co., Ltd.
- Acelon Chemicals & Fiber Corporation
- Grasim Industries Limited
- Sateri Holdings Limited
Competitive Analysis:
The GLOBAL LYOCELL FIBER MARKET shows strong competition driven by continuous technology upgrades and expanding service portfolios. Vendors focus on IoT integration, predictive platforms, and cloud-based oversight to gain operational advantage. It attracts global and regional companies that invest in scalable systems supporting large corporate environments. Key players strengthen product depth through analytics, workplace automation, and energy optimization tools. Partnerships between software firms and facility service providers increase access to enterprise clients. Leading brands compete on interoperability, cybersecurity strength, and platform reliability. Vendors also expand AI-driven features that support remote supervision and workflow automation. The market remains active due to steady digital adoption across commercial, industrial, and public facilities.
Recent Developments:
- October 2025 - Partnership with OceanSafe for Next-Generation Performance Textiles: In October 2025, Lenzing announced a strategic partnership with OceanSafe, an innovator in novel textile materials, to launch next-generation performance textiles. This collaboration synergizes Lenzing's wood-based TENCEL™ Lyocell A100 fibers with OceanSafe's high-performance, biodegradable co-polyester known as naNea, creating an innovative yarn that combines advanced functionality with environmental responsibility. The new product was unveiled at Performance Days in Munich on October 29-30, 2025, in Hall A2, followed by presentations at the Functional Fabric Fair in Portland in November, targeting manufacturers and brands seeking to transition to circular and biodegradable fiber materials.
- November 2024 - Expansion of LENZING™ Lyocell Dry Fiber Portfolio: In November 2024, Lenzing , a leading supplier of regenerated cellulose fibers, announced the expansion of its LENZING™ Lyocell Dry fiber portfolio with two innovative new cellulosic fibers designed to address diverse application requirements. The company introduced a fine dry fiber that delivers both strength and softness, enabling customers to produce nonwoven fabrics with higher density compared to the standard LENZING™ Lyocell Dry fiber, with up to 30% more cellulosic fibers in the same space suitable for hygiene applications such as diapers and sanitary pads. Alongside this, Lenzing launched a coarse dry fiber which provides enhanced liquid and air flow capabilities, allowing for more air or liquid to flow through the material, making it particularly suitable for the acquisition and distribution layer in hygiene products and industrial filtration applications.
Report Coverage:
The research report offers an in-depth analysis based on By Type and By Application. It details leading market players, providing an overview of their business, product offerings, investments, revenue streams, and key applications. Additionally, the report includes insights into the competitive environment, SWOT analysis, current market trends, as well as the primary drivers and constraints. Furthermore, it discusses various factors that have driven market expansion in recent years. The report also explores market dynamics, regulatory scenarios, and technological advancements that are shaping the industry. It assesses the impact of external factors and global economic changes on market growth. Lastly, it provides strategic recommendations for new entrants and established companies to navigate the complexities of the market.
Future Outlook:
- AI-driven facility intelligence will gain stronger demand in large enterprise buildings.
- Cloud-native platforms will support broader remote supervision across dispersed locations.
- Predictive maintenance will become a core investment priority for asset-heavy industries.
- Cybersecure automation frameworks will see higher adoption across regulated sectors.
- Smart workplace solutions will evolve to support dynamic occupancy and hybrid use cases.
- Vendors will introduce interoperable systems that improve data exchange across platforms.
- Sustainable building programs will push greater use of energy optimization technologies.
- Robotics and autonomous services will expand into cleaning and inspection tasks.
- Digital twins will support stronger planning accuracy in complex facility environments.
- Regional markets will accelerate adoption based on infrastructure maturity and digital readiness.
Request a Free Sample
Fill in your details and we'll send you a free sample report.
- Sample data tables & charts
- Research methodology
Need a Custom Version of This Report?
Tailor the scope, geography, or segments to your exact requirements.
- Custom geography or segment scope
- Direct access to our analyst team
Frequently Asked Questions
What is the current market size for Global Lyocell Fiber Market, and what is its projected size in 2032?
At what Compound Annual Growth Rate is the Global Lyocell Fiber Market projected to grow between 2025 and 2032?
Which segment held the largest share of the GLOBAL LYOCELL FIBER MARKET in 2024?
What are the primary factors fueling the growth of the Global Lyocell Fiber Market?
Who are the leading companies in the Global Lyocell Fiber Market?
Table of Content
Chapter 1. Report Introduction
- 1.1 Report Description & Purpose
- 1.1.1 Report Title & Market Definition
- 1.1.2 Unique Selling Propositions (USP) & Key Differentiators
- 1.1.3 Value Proposition for Stakeholders
- 1.2 Research Objectives
- 1.2.1 Market Sizing Objectives (Volume & Revenue)
- 1.2.2 Segmentation Objectives
- 1.2.3 Competitive Intelligence Objectives
- 1.2.4 Forecast & Scenario Objectives
- 1.3 Report Scope
- 1.3.1 Lyocell Fiber Scope – Types & Subtypes Covered
- 1.3.2 Geographic Scope – Regions & Countries Covered
- 1.3.3 Historical Period, Base Year & Forecast Period (2018; forecast to the forecast period)
- 1.3.4 Inclusions & Exclusions
- 1.4 HS Code & Classification Framework
- 1.5 Currency, Units & Pricing Basis
- 1.6 Target Stakeholders
- 1.7 Limitations & Assumptions
Chapter 2. Executive Summary
- 2.1 Global Lyocell Fiber Market Snapshot
- 2.1.1 Market Size – Historical (2018) & Forecast (the forecast period) (2018: USD 1,120.00 million → forecast year: USD 2,027.77 million)
- 2.1.2 Volume & Revenue – Global Totals
- 2.1.3 Key Market Highlights – Top Five Facts
- 2.2 Lyocell Fiber Market Segmentation Snapshot
- 2.2.1 Market Split by Region – 2018 vs.
- 2.3 Competitive Snapshot
- 2.3.1 Top 10 Players by Revenue Share – 2018
- 2.3.2 Top 10 Players by Volume Share – 2018
- 2.3.3 Recent Strategic Developments (18-Month Summary)
- 2.4 Key Investment Highlights & Strategic Conclusions
Chapter 3. Lyocell Fiber Market Dynamics & Industry Analysis
- 3.1 Market Overview & Context
- 3.1.1 Lyocell Fiber Market Position in the Broader Automotive Value Chain
- 3.1.2 OEM vs. Replacement Market Dynamics
- 3.1.3 Market Maturity & Development Stage by Region
- 3.2 Lyocell Fiber Market Drivers
- 3.3 Lyocell Fiber Market Restraints & Challenges
- 3.4 Lyocell Fiber Market Opportunities
- 3.5 Porter's Five Forces Analysis
- 3.5.1 Threat of New Entrants
- 3.5.2 Bargaining Power of Suppliers
- 3.5.3 Bargaining Power of Buyers
- 3.5.4 Threat of Substitutes
- 3.5.5 Competitive Rivalry – Intensity Assessment
- 3.6 Lyocell Fiber Value Chain Analysis
- 3.6.1 Upstream – Raw Material/Input Suppliers
- 3.6.1.1 Raw Material/Input 1
- 3.6.1.2 Raw Material/Input 2
- 3.6.1.3 Raw Material/Input 3
- 3.6.2 Midstream – Production/Manufacturing/Service Delivery
- 3.6.2.1 Production/Process Overview
- 3.6.2.2 Key Facility Locations & Capacity by Manufacturer
- 3.6.3 Downstream – Distribution & End Consumer
- 3.6.3.1 Primary Channel – B2B/OEM
- 3.6.3.2 Secondary Channels – Dealer, Retail, Online, Direct
- 3.6.4 Value Chain Profitability Analysis
- 3.6.1 Upstream – Raw Material/Input Suppliers
- 3.7 PESTEL Analysis
- 3.7.1 Political Factors
- 3.7.2 Economic Factors
- 3.7.3 Social Factors
- 3.7.4 Technological Factors
- 3.7.5 Environmental Factors
- 3.7.6 Legal Factors
- 3.8 Lyocell Fiber Supply Chain Analysis
- 3.8.1 Raw Material/Input Supply Risk Assessment
- 3.8.2 Manufacturing Concentration Risk (Geographic Exposure)
- 3.8.3 Trade Disruption Impact Analysis
- 3.9 Regulatory & Policy Landscape
Note: The regulatory and policy landscape section covers regulations based on their applicability to the market, Lyocell Fiber category, geography, and scope of the study. Only regulatory frameworks with a material impact on operations, compliance, trade, sustainability, or market access are analyzed in detail.
Chapter 4. Key Investment Pockets & Opportunity Analysis
- 4.1 Lyocell Fiber Market Attractiveness Analysis
- 4.1.1 By Region – Investment Attractiveness Matrix (Volume × CAGR)
- 4.2 Absolute Revenue Growth Opportunity
- 4.2.1 By Region – Absolute USD Growth Through the forecast period
- 4.3 Incremental Volume Opportunity
- 4.3.1 By Region – Incremental Volume Through the forecast period
- 4.3.2 Segment – Incremental Volume
- 4.4 Emerging Submarket Opportunity Deep Dive (Subject to Applicability)
- 4.5 Emerging Market Opportunity Scorecards
- 4.5.1 United States
- 4.5.2 Europe
- 4.5.3 Asia
- 4.5.4 Middle East & Africa
Note: Emerging Market Opportunity Scorecards will be included based on relevance and strategic importance. Regions listed are indicative and may vary depending on data availability and market dynamics.
Chapter 5. Lyocell Fiber Import-Export Analysis & Trade Flows
- 5.1 Global Trade Overview
- 5.1.1 Global Export Value by Country (2018)
- 5.1.2 Global Export Volume by Country (2018)
- 5.1.3 Global Import Value by Country (2018)
- 5.1.4 Global Import Volume by Country (2018)
- 5.1.5 Net Trade Balance by Country (2018)
- 5.2 Export Analysis – Segment
- 5.2.1 Type 1 (HS Code)
- 5.2.2 Type 2 (HS Code)
- 5.2.3 Type 3 (HS Code)
- 5.2.4 Type 4 (HS Code)
- 5.2.5 Type 5 (HS Code)
- 5.3 Import Analysis – Segment
- 5.3.1 Type 1 (HS Code)
- 5.3.2 Type 2 (HS Code)
- 5.3.3 Type 3 (HS Code)
- 5.3.4 Type 4 (HS Code)
- 5.3.5 Type 5 (HS Code)
- 5.4 Average Unit Trade Prices
- 5.4.1 Average Export Price – Segment & Country
- 5.4.2 Average Import Price – Segment & Source Country
- 5.4.3 Price Trends (2018)
- 5.5 Key Trade Route Analysis
- 5.5.1 Trade Route 1
- 5.5.2 Trade Route 2
- 5.5.3 Trade Route 3
- 5.5.4 Trade Route 4
- 5.5.5 Trade Route 5
- 5.6 Trade Policy Impact Assessment
- 5.6.1 US Anti-Dumping & Section 301 Tariffs
- 5.6.2 EU Customs Union Impact
- 5.6.3 Major Free Trade Agreements
- 5.6.4 USMCA Rules of Origin
Note: Trade policy analysis will be included only where relevant to the Lyocell Fiber market.
Chapter 6. Competitive Landscape & Company Benchmarking
- 6.1 Lyocell Fiber Market Concentration & Structure
- 6.1.1 Herfindahl-Hirschman Index (HHI) – vs. 2018
- 6.1.2 Tier 1, Tier 2 & Tier 3 Market Structure
- 6.1.3 Global, Regional & Local Player Dynamics
- 6.2 Lyocell Fiber Market Share Analysis – 2018
- 6.2.1 Global Revenue Share by Company
- 6.2.2 Global Volume Share by Company
- 6.2.3 Regional Revenue Share
- 6.2.4 Market Share Evolution ( vs. 2018)
- 6.2.5 OEM Segment Share by Company
- 6.2.6 Replacement Segment Share by Company
- 6.3 Production/Delivery Capacity & Facility Analysis
- 6.3.1 Global Installed Capacity
- 6.3.2 Capacity Utilization Rates
- 6.3.3 Production/Output Volume
- 6.3.4 Facility Locations & Capacity Map
- 6.3.5 Planned Capacity Additions
- 6.4 Lyocell Fiber Competitive Benchmarking Matrix
- 6.4.1 Revenue, Volume, CAGR & Profitability Comparison
- 6.4.2 Channel Revenue Mix
- 6.4.3 Geographic Revenue Exposure
- 6.4.4 R&D Intensity
- 6.4.5 Sustainability Maturity
- 6.5 Strategic Developments in Lyocell Fiber (Last 24 Months)
- 6.5.1 Mergers, Acquisitions & Divestments
- 6.5.2 New Lyocell Fiber Launches
- 6.5.3 Facility Expansions
- 6.5.4 Strategic Alliances, Joint Ventures & Partnerships
- 6.5.5 Distribution Expansion & Market Entry
- 6.5.6 Sustainability & ESG Initiatives
- 6.6 Competitive Strategy Mapping
- 6.6.1 Leader, Challenger, Follower & Niche Classification
- 6.6.2 Pricing Strategy Comparison
- 6.6.3 Channel Strategy Matrix
Note: Strategic developments are included based on their materiality and the availability of reliable information.
Chapter 7. Global Lyocell Fiber Market – By Distribution Channel
- 7.1 Segment Overview
- 7.1.1 Volume & Revenue Split by Channel (2018 & )
- 7.1.2 Channel Mix Evolution (the forecast period)
Chapter 8. Regional Market Analysis – Global Overview
- 8.1 Global Regional Overview
- 8.1.1 Regional Volume Share
- 8.1.2 Regional Revenue Share
- 8.1.3 Regional Volume by Region
- 8.1.4 Regional Revenue by Region
- 8.1.5 Regional Forecast Through the forecast period
- 8.2 Cross-Regional Segment Analysis
- 8.2.1 By Distribution Channel
- 8.2.2 By Brand/Price Tier
Chapter 9. North America Lyocell Fiber Market
- 9.1 United States
- 9.2 Canada
- 9.3 Mexico
Chapter 10. Europe Lyocell Fiber Market
- 10.1 Germany
- 10.2 France
- 10.3 Italy
- 10.4 United Kingdom
- 10.5 Spain
- 10.6 Poland
- 10.7 Russia
- 10.8 Netherlands
- 10.9 Belgium
- 10.10 Sweden
- 10.11 Denmark
- 10.12 Norway
- 10.13 Rest of Europe
Chapter 11. Asia Pacific Lyocell Fiber Market
- 11.1 China
- 11.2 India
- 11.3 Japan
- 11.4 South Korea
- 11.5 Thailand
- 11.6 Indonesia
- 11.7 Vietnam
- 11.8 Malaysia
- 11.9 Australia
- 11.10 Rest of Asia Pacific
Chapter 12. Latin America Lyocell Fiber Market
- 12.1 Brazil
- 12.2 Argentina
- 12.3 Colombia
- 12.4 Chile
- 12.5 Rest of Latin America
Chapter 13. Middle East Lyocell Fiber Market
- 13.1 Saudi Arabia
- 13.2 United Arab Emirates
- 13.3 Turkey
- 13.4 Israel
- 13.5 Iran
- 13.6 Rest of the Middle East
Chapter 14. Africa Lyocell Fiber Market
- 14.1 South Africa
- 14.2 Egypt
- 14.3 Nigeria
- 14.4 Morocco
- 14.5 Rest of Africa
Chapter 15. Lyocell Fiber Company Profiles
- 15.1 [Company 01]
- 15.1.1 Company Overview
- 15.1.2 Key Management Personnel
- 15.1.3 Products & Services Portfolio
- 15.1.4 Financial Performance
- 15.1.5 Key Market Focus & Geographic Presence
- 15.1.6 Recent Developments & Strategic Initiatives
Note: The company profile list is preliminary and may change based on research findings, market developments, data availability, and client requirements.
Chapter 16. Appendices
- Appendix A – List of Abbreviations & Acronyms
- Appendix B – Industry Classification Code Reference – Full Series
- Appendix C – Production & Capacity Data Tables
- Appendix D – End-Use & Demand Base Tables
- Appendix E – Consumption & Replacement Rate Assumptions
- Appendix F – ASP Reference Tables
- Appendix G – Manufacturing & Facility Database
- Appendix H – Import-Export Data Tables
- Appendix I – Regulatory Summary Tables
- Appendix J – Primary Research Participant List (Anonymized)
- Appendix K – Primary Research Questionnaire Framework
- Appendix L – Data Sources & Bibliography
- Appendix M – Market Size Divergence & Source Comparison
Chapter 17. Research Methodology
- 17.1 Research Framework & Philosophy
- 17.2 Secondary Research – Sources, Hierarchy & Data Extraction
- 17.3 Data Modeling – Bottom-Up & Top-Down Market Sizing
- 17.4 Primary Research – Stakeholder Framework, LOI & Sample Sizes
- 17.5 Forecast Methodology – Regression, Scenario & Sensitivity Analysis
- 17.6 Quality Control – Four-Layer Validation Framework
- 17.7 Limitations & Standard Assumptions
- 17.8 Disclaimer
