Bubble tea spending in Malaysia follows store networks
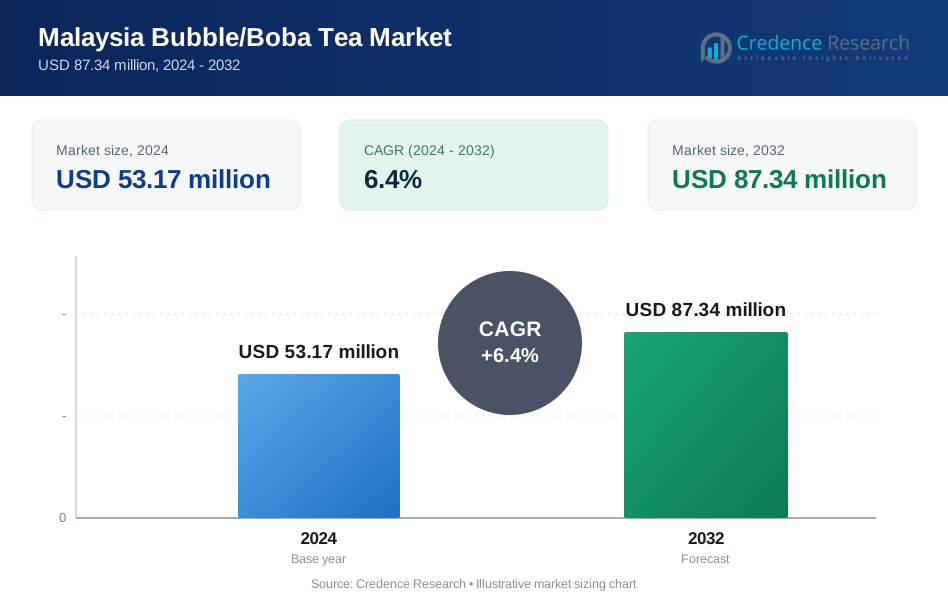
The Malaysia bubble/boba tea market was valued at USD 351.0 million in 2025 and is projected to increase from USD 373.5 million in 2026 to USD 652.7 million by 2035, registering a CAGR of 6.40% during 2026–2035. Demand comes from young urban buyers who treat a cup as a daily treat, and from chains that have placed stores in malls, transit hubs and suburban strips across the peninsula. Klang Valley held the largest regional share, 42.0% in 2025, because Selangor and Kuala Lumpur together host the densest food and beverage premises in the country. Johor Bahru is the fastest-growing region at 6.98% a year, helped by cross-border traffic and the Johor-Singapore rail link due to start passenger service in February 2027. The main commercial change is the arrival of Chinese chains, with Mixue near 700 outlets by December 2025 and Chagee opening its 200th Malaysian store in October 2025, which has pushed Tealive and other established brands to refresh menus and defend store economics.
What counts as bubble tea spending in Malaysia, and who sells it?
The estimate counts freshly prepared tea drinks sold to consumers through tea shops, kiosks and delivery apps, with or without toppings, at the price the buyer pays. Boba tea and pearl milk tea fall inside this definition, so the same figure answers searches for either name.
Bottled ready-to-drink tea, 3-in-1 sachets, coffee-led chains and kopitiam teh tarik are excluded. The value chain runs from imported tapioca starch and tea leaf, through chain commissaries and franchisees, to the counter. Tealive, Mixue and Chagee are the three brands with the largest disclosed outlet counts in the country.
Malaysia Bubble/Boba Tea Market Insights
- The market stands at USD 351.0 million in 2025 and reaches USD 652.7 million by 2035, a 6.40% CAGR built on store sales rather than packaged drinks.
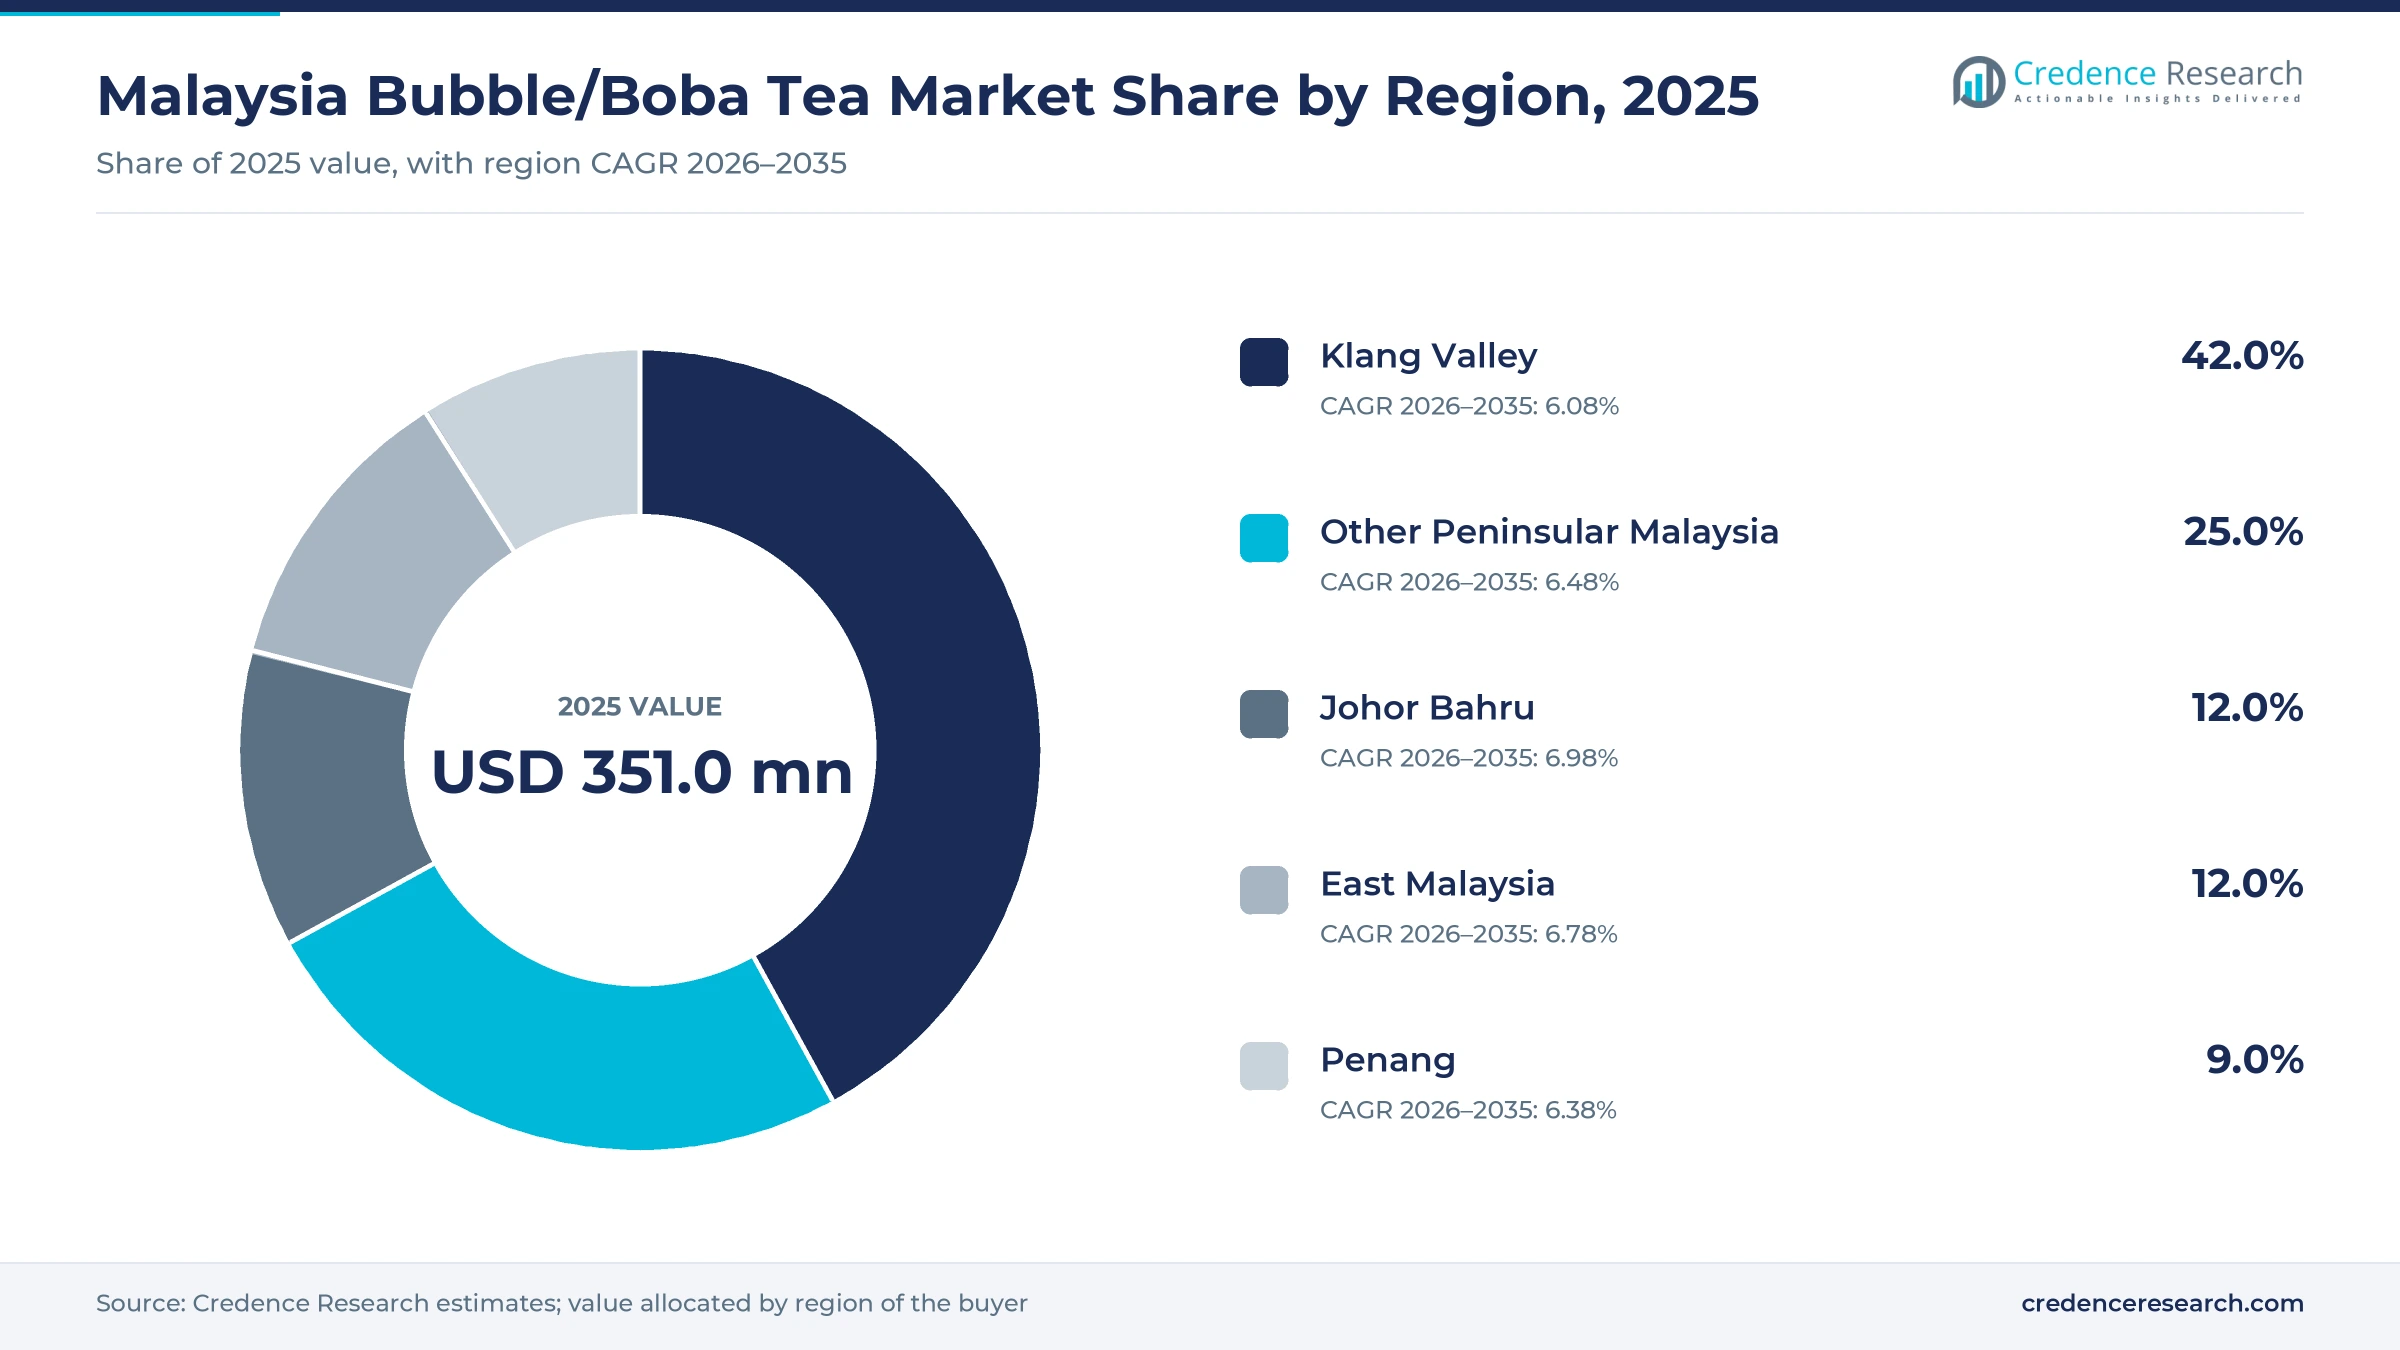
- Klang Valley took 42.0% of 2025 value, while Johor Bahru grows fastest at 6.98% a year as cross-border traffic builds toward the February 2027 rail link.
- Milk tea accounted for 58.0% of 2025 value, and tapioca pearls remained the leading topping with 62.0% of value in the same year.
- Chagee earned the Health Ministry Healthier Dining logo in 2025, with certified drinks capped at 5 grams of sugar per 100 milliliters, signaling how menus will change.
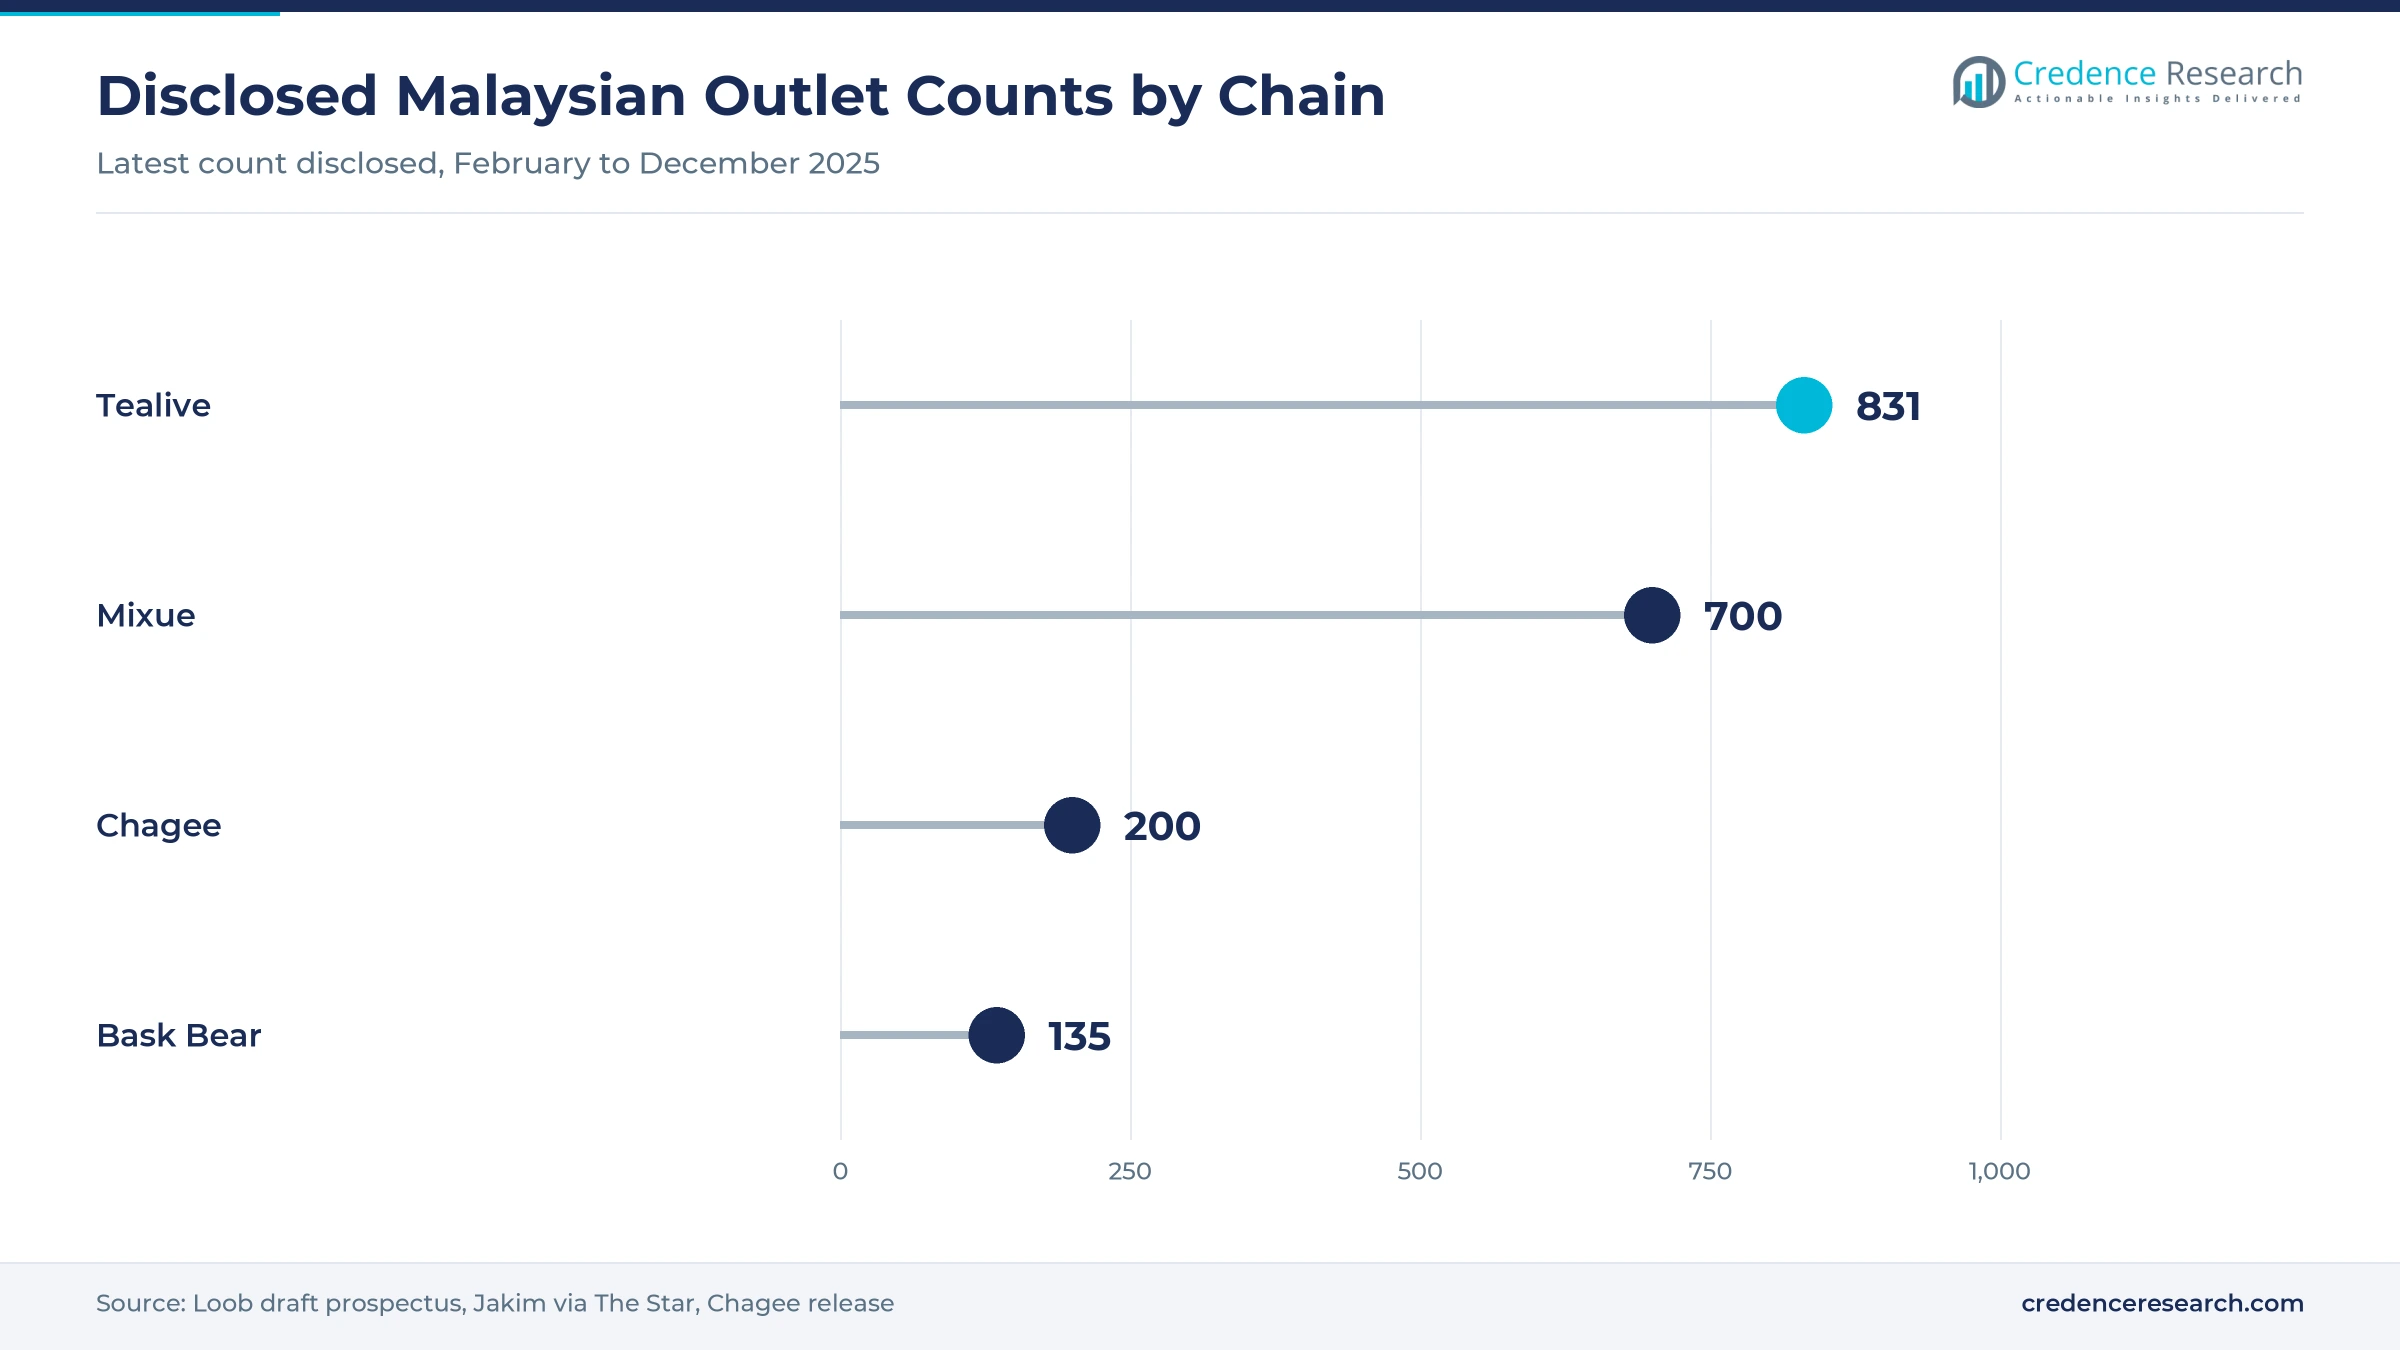
- Tealive had 831 Malaysian stores in February 2025, yet Mixue reached about 700 by December 2025, so scale is no longer a single-brand advantage.
Milk bases and tapioca pearls hold the largest cup share
Why does milk tea still outsell fruit and specialty drinks?
Based on type, the market is categorized into milk tea, fruit tea and specialty tea. Milk Tea led with 58.0% of 2025 value because it anchors every major menu, and Chagee alone reported serving over 800,000 cups a month across 70 Malaysian outlets in September 2023, according to Sinar Daily. Tealive also gave milk tea three of its nine sachet flavors in June 2025. Specialty Tea grows fastest at 7.39% a year, as Chagee now lists separate Brew Tea and Iced Oriental Tea menus on its Malaysian site and Tealive added Da Hong Pao tea in its June 2025 menu refresh.
Do tapioca pearls keep their lead as toppings diversify?
Based on toppings, the market is categorized into tapioca pearls, jelly, popping boba and pudding. Tapioca Pearls led with 62.0% of 2025 value because pearls define the drink, and Tridge trade data show Malaysia imported USD 112.97 million of tapioca starch in 2023, with Thailand supplying the largest share in 2024. Daboba and Tiger Sugar both build their menus around pearls, and related starch derivatives draw on the same crop. Popping Boba grows fastest at 7.29% a year, as brands test lighter chews, such as the seaweed-extract Pin Ball that Pin Tea sells.
Which tea base is gaining as premium chains expand?
Based on base tea type, the market is categorized into black tea, green tea, oolong tea and herbal tea. Black Tea led with 46.0% of 2025 value because it suits local taste for strong sweet tea, and Malay Mail reported in July 2024 that BOH, the largest Malaysian producer, makes 2.8 million kilograms a year. Oolong Tea grows fastest at 7.31% a year, as Tealive introduced Da Hong Pao, a Chinese rock oolong, in June 2025. Chagee also pushes lighter profiles, and its BO·YA Jasmine Green Milk Tea won a 2025 World Beverage Innovation Award.
| Segment Group | Leading Sub-segment | Share, 2025 | Fastest-growing Sub-segment | CAGR, 2026–2035 |
|---|---|---|---|---|
| By Type | Milk Tea | 58.0% | Specialty Tea | 7.39% |
| By Toppings | Tapioca Pearls | 62.0% | Popping Boba | 7.29% |
| By Base Tea Type | Black Tea | 46.0% | Oolong Tea | 7.31% |
Request a Free Sample
Fill in your details and we'll send you a free sample report.
- Sample data tables & charts
- Research methodology
Store counts, low price points and halal status lift sales
How much do store networks add to reach?
Store density is the strongest driver because bubble tea is an impulse purchase made within a short walk. Tealive had 831 stores in Malaysia in February 2025, and its draft prospectus described the chain as the largest tea shop operator by store count in 2024. Jakim official Muhyiddin Haji Aziz put Mixue at about 700 Malaysian outlets in December 2025, according to The Star. Chagee, which had 70 outlets in 2023, opened its 200th in October 2025. These networks sit in a country where World Bank data put the urban share at 76.9% in 2024, so most of the 35.6 million residents live near a mall or commercial strip. As a result, chain sales concentrate where these stores cluster most tightly, in Selangor and Kuala Lumpur.
Why do lower price points widen the buyer base?
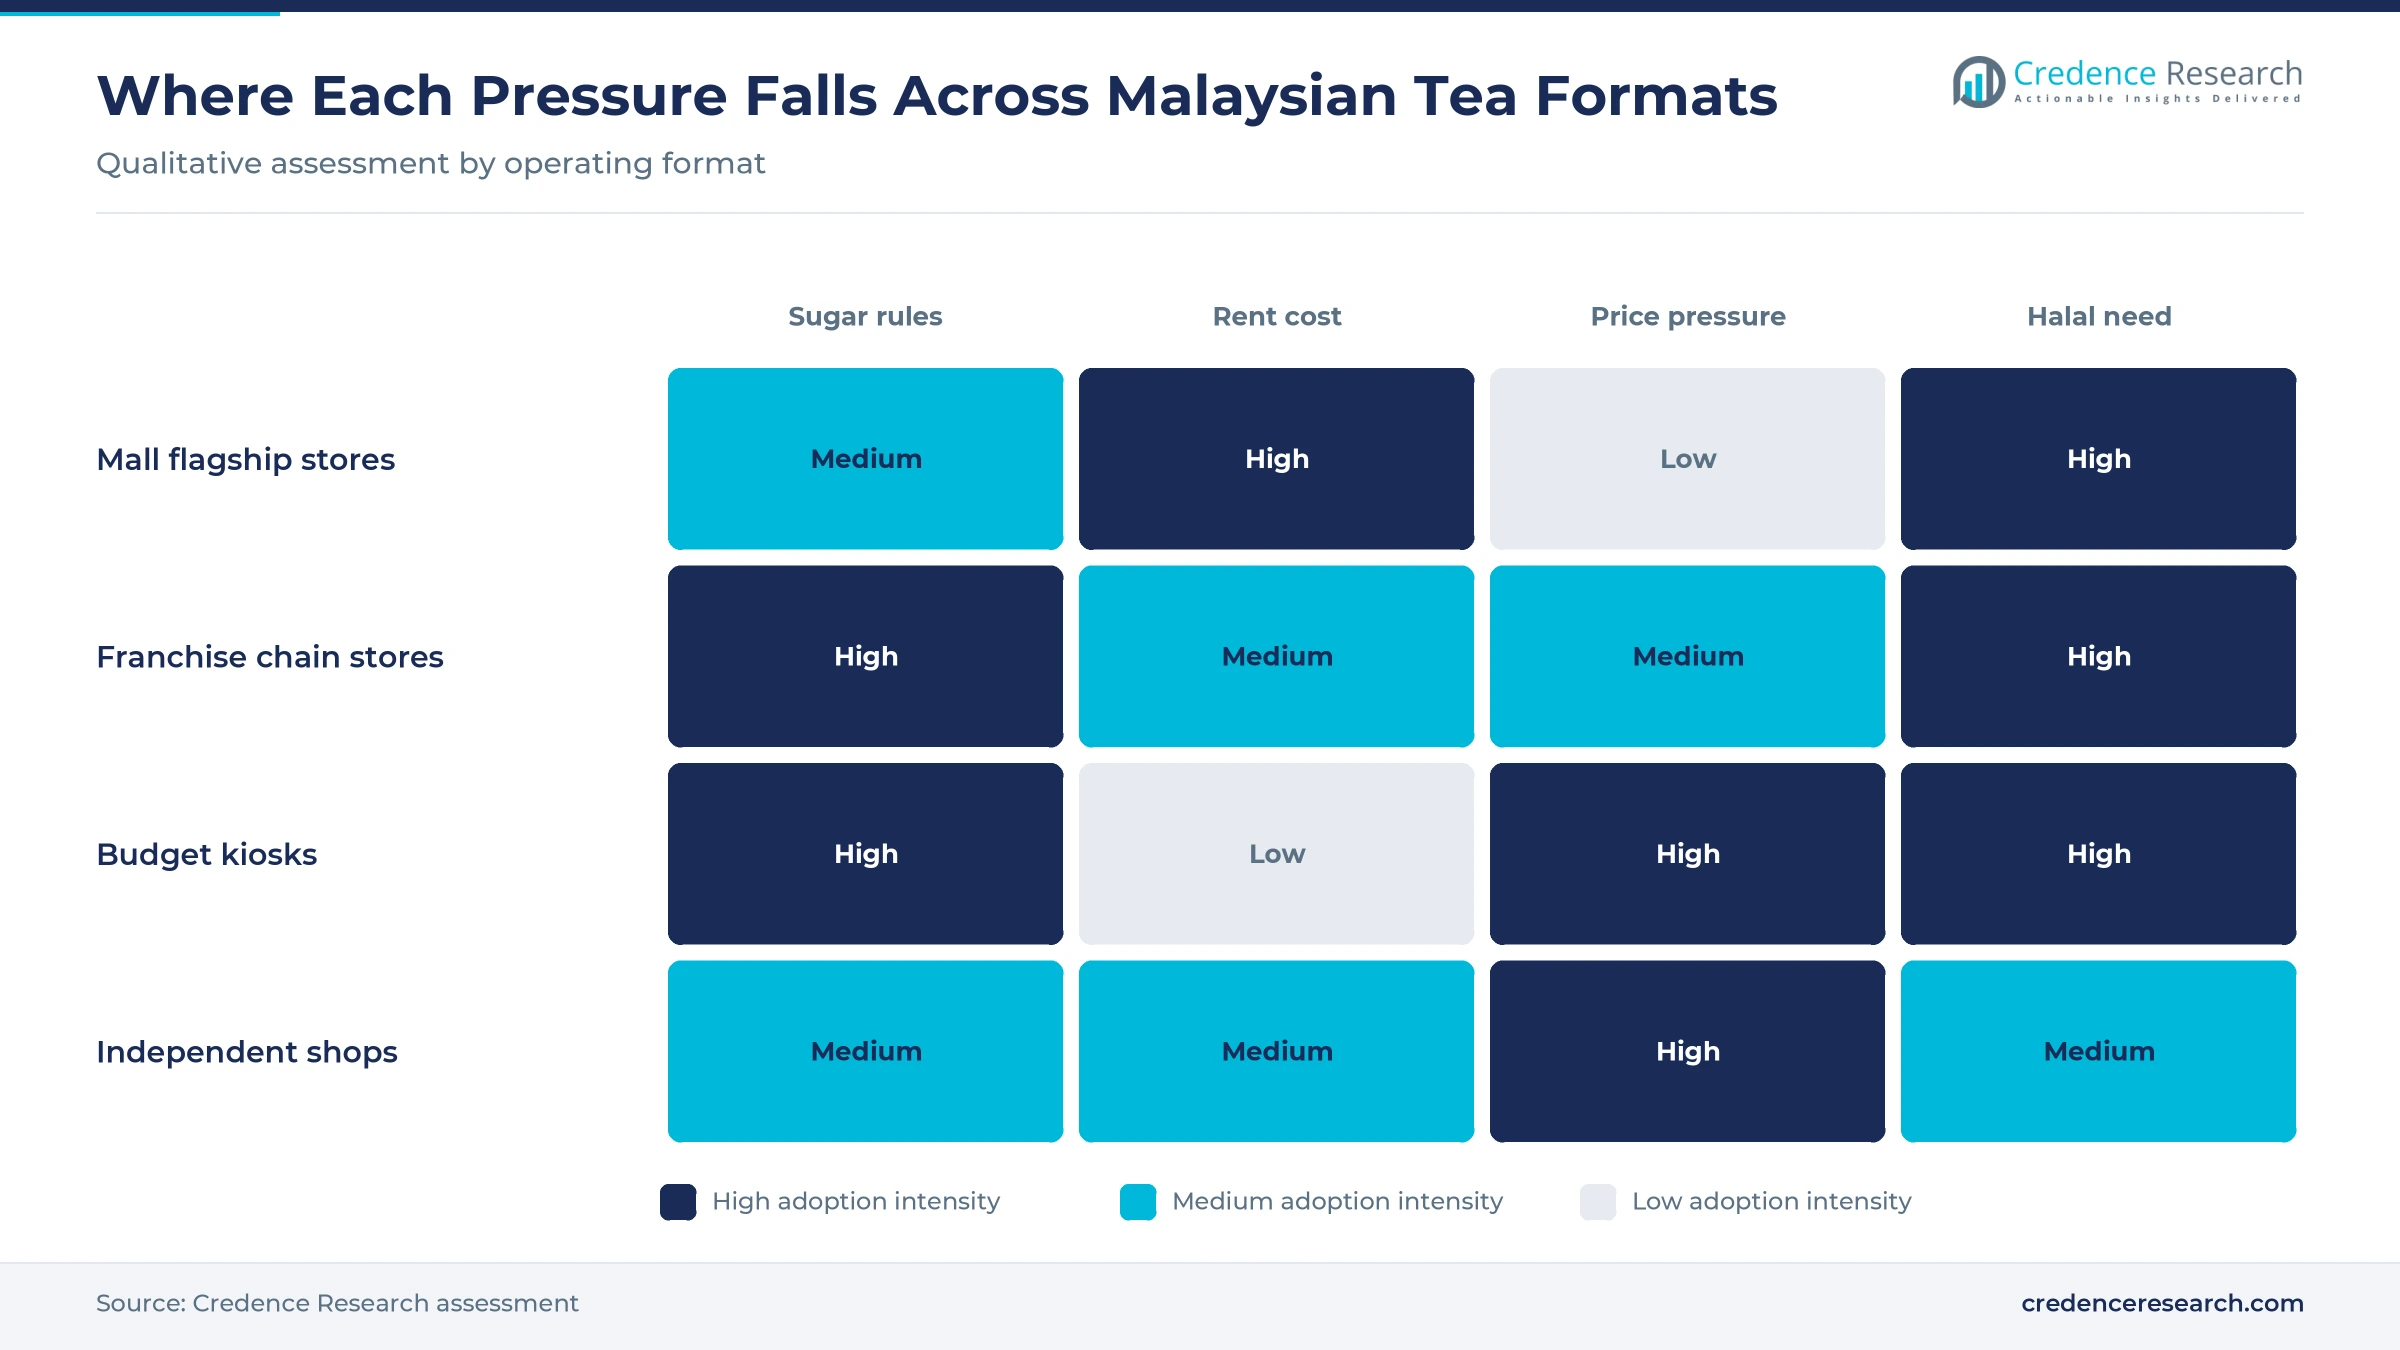
A wider price ladder has turned bubble tea from an occasional treat into a routine purchase for students and lower-income households. WargaBiz reported in January 2025 that a typical Mixue bubble tea cost RM5.50, far below established brands. Restaurant-technology vendor Eats365 places quality brands at RM9 to RM17 a cup and specialty coffee at RM15 to RM22, which leaves tea with room above and below. Entry costs follow the same ladder, with a Tealive franchise near RM880,000 and budget kiosks under RM300,000, according to the same Eats365 review. Because kiosks need little floor space, this pricing reaches suburbs that premium chains skip. In turn, the ladder supports market growth through volume, not only through higher prices per cup.
What does halal certification change for chains?
Halal certification opens the Muslim majority to chains that once relied on urban Chinese buyers, so it directly enlarges the addressable market. Jakim recognized more than 100 Mixue outlets at a Dec. 13, 2025, ceremony in Petaling Jaya, according to The Star. Mixue said in a February 2026 release that 157 stores had been certified, which leaves most of its network still to complete the process. Chagee received its first Jakim certificate for five outlets in September 2023, according to Sinar Daily, and Eats365 lists halal status among the core strengths of Tealive. As a result, certification has become a basic entry requirement for mall leases and for reaching buyers in states far beyond Selangor and Kuala Lumpur.
How do young buyers and brand tie-ins lift repeat visits?
Young buyers visit often and share drinks online, which gives chains free reach and a reason to launch limited menus. The Star reported in March 2026 that 61% of Chagee members in Asia Pacific were under 30 by the end of 2025. Its September 2025 Green Grape Milk Tea tie-in with POP MART reached a record launch-day cup share in Malaysia, according to a December 2025 Chagee release. Tealive followed a similar route in June 2025, pairing its menu refresh with limited merchandise from Malaysian brands. These campaigns matter most for milk tea, which held 58.0% of 2025 value, because the base recipe stays familiar while the packaging and flavor change each season.
Lower sugar menus and Chinese chains reshape the counter
The shift toward lower sugar menus
Menus are shifting toward lower sugar because regulators are making sweetness a visible commercial risk. The Health Ministry told Parliament in November 2025 that it would not tax freshly made drinks and would instead promote its Healthy Dining Programme, which covered 12 operators and 147 menu items by September 2025, according to Newswav. Chagee became the first freshly prepared tea chain to earn that logo, with certified drinks capped at 5 grams of sugar per 100 milliliters, and the ministry recognized it at a June 5, 2026, ceremony in Melaka. Tealive added light milk teas to its range in June 2025. This shift also supports Specialty Tea, which grows at 7.39% a year as less sweet recipes gain shelf space.
The rise of Chinese chains across Malaysian malls
Chinese chains have moved from novelty to the main competitive force in Malaysian tea retail within about five years. Caixin Global reported in March 2026 that more than 60 Chinese food and beverage brands ran over 6,100 Southeast Asian outlets at the end of 2024. Malaysia sits at the center of that push, with Mixue near 700 outlets, and the Chagee release of December 2025 calls the country its flagship international market. The Edge reported in January 2026 that Loob, the Tealive owner, had put its listing plan on hold amid stiff competition from these brands, although founder Bryan Loo called it a timing issue. As a result, local chains now compete on both ends of the ladder, against Mixue on price and Chagee on quality.
Opportunity in grocery sachets and home kits
Grocery shelves offer established brands a second income stream that does not need rent or counter staff. Tealive launched nine 3-in-1 flavors on June 5, 2025, at RM12.90 a box, first through AEON and its own stores, according to its launch release. It then added 3+1 Fun Packs at Jaya Grocer on Feb. 13, 2026, according to Malaysian Foodie, and BOH has sold instant tea mixes for over a decade. The same buyers already understand instant premix sachets and at-home drink kits, since Tealive sold a DIY kit during the pandemic. Sachet sales sit outside this estimate, but they keep each brand visible when shoppers are away from malls.
Opportunity in Johor and underserved east coast states
Geographic white space remains, because outlet maps still show large gaps outside the Klang Valley. A Google Maps count by analyst Zahier Nasrudin found 141 Mixue stores in Selangor and none in Kelantan or Terengganu on Feb. 21, 2025. Johor offers a larger near-term prize, with 15,727 food and beverage premises in 2022 according to the Department of Statistics Malaysia. The Johor-Singapore rail link will also start service in February 2027 with peak capacity of 10,000 passengers an hour in each direction, according to New Straits Times. This explains why Johor Bahru is the fastest of the five regions in the Credence Research model, even from a smaller 2025 share of Malaysia bubble/boba tea spending.
Sugar rules, rent and price wars squeeze tea shop margins
Will Nutri-Grade labels reach freshly made drinks?
Sugar regulation is the largest policy risk because the Health Ministry plans Nutri-Grade labels that would ban advertising for drinks above 10 grams of sugar per 100 milliliters. Packaged drinks come first, but freshly prepared drinks follow in a later phase. The Consumers Association of Penang cited a study finding about 92 grams of sugar in a 500-milliliter brown sugar boba drink. Chains therefore face costly recipe changes, and early reformulation is the practical defense.
How much does expanded service tax add to rent?
Rent has become more expensive since the expanded sales and service tax began on July 1, 2025. The Malaysia Retail Chain Association told The Star in September 2025 that rent often makes up 20% to 30% of monthly overheads, and that an 8% levy adds RM4,000 to a RM50,000 lease. Mall-based tea shops feel this most, since prime units carry the highest rents. Operators are responding by testing smaller kiosks, renegotiating leases and closing weaker stores.
Is there now too much capacity at the budget end?
Store openings have outrun buyer spending in some formats, and that weakens pricing across the category. The Star reported in September 2025 that takeaway kiosks and stalls fell 8.1% in the second quarter of 2025 from a year earlier. A Malaysian Food and Beverage Executives Association official also told The Sun that 30% to 35% of new ventures close within 12 to 18 months. Smaller independents are most exposed, so they need clearer differentiation than price.
How do wages and imported inputs affect each cup?
Labor and imported ingredients leave little margin at low price points, particularly for brands selling near RM5.50 a cup. The monthly minimum wage now stands at RM1,700, according to The Sun, and tea counters need several staff per shift. Tapioca starch is also largely imported, with Tridge data showing USD 100.49 million arriving from Thailand in 2024. Operators with commissary supply and bulk buying contracts can absorb these costs better than single-store owners.
Klang Valley leads as Johor and Borneo gain outlets
| Region | Value, 2025 (USD million) | Share, 2025 | CAGR, 2026–2035 |
|---|---|---|---|
| Klang Valley | 147.4 | 42.0% | 6.08% |
| Other Peninsular Malaysia | 87.8 | 25.0% | 6.48% |
| Johor Bahru | 42.1 | 12.0% | 6.98% |
| East Malaysia | 42.1 | 12.0% | 6.78% |
| Penang | 31.6 | 9.0% | 6.38% |
Klang Valley sets the pace for new brands and formats
Klang Valley held a 42.0% share of 2025 value and grows at 6.08% a year, slower than the national rate because it is already crowded. Selangor had 24,625 food and beverage premises and Kuala Lumpur 13,849 in 2022, together more than a quarter of the national total. New brands usually open here first, as Chagee did with its 200th store at Bukit Bintang WOLO in October 2025. High traffic among restaurant and cafe operators also keeps competition for mall units intense.
Other Peninsular Malaysia offers suburban and east coast room
Other Peninsular Malaysia held a 25.0% share of 2025 value and grows at 6.48% a year across Perak, Negeri Sembilan, Melaka, Pahang, Kedah and the east coast. Demand here depends on lower-priced formats, and kiosks costing under RM300,000 to open suit smaller towns. Chagee chose Melaka for its June 2026 health recognition event, which shows the attention these states now receive. Kelantan and Terengganu had no Mixue stores in February 2025, so the east coast remains the clearest gap.
Johor Bahru gains from cross-border spending
Johor Bahru held a 12.0% share of 2025 value and grows at 6.98% a year, the fastest pace in the country. Johor had 15,727 food and beverage premises in 2022, the second-highest state total, and Johor Bahru district alone holds about 1.8 million people, according to the Department of Statistics Malaysia. The rail link due in February 2027 should bring more Singapore visitors into the city center. Because ringgit prices look low to those visitors, chains can hold prices here more easily than elsewhere.
East Malaysia grows from a smaller store base
East Malaysia, covering Sabah and Sarawak, held a 12.0% share of 2025 value and grows at 6.78% a year. Distance from peninsular commissaries favors local licensees over company stores, and this model has a long record in the region. The Borneo Post reported in May 2018 that the fourth Tealive outlet in Sarawak had opened at Aeon Kuching Mall, with Nucoz as Kuching master licensee. Budget formats now have room to follow, which keeps growth above the national rate.
Penang stays a dense student and tourist market
Penang held a 9.0% share of 2025 value and grows at 6.38% a year, close to the national rate. The state is small, but density is high, with Timur Laut district recording 4,748 people per square kilometer in the 2025 estimates of the Department of Statistics Malaysia. This density favors walk-in counters near campuses and the George Town tourist core. Sugar debate is also louder here, since the Consumers Association of Penang has criticized boba drinks since July 2019.
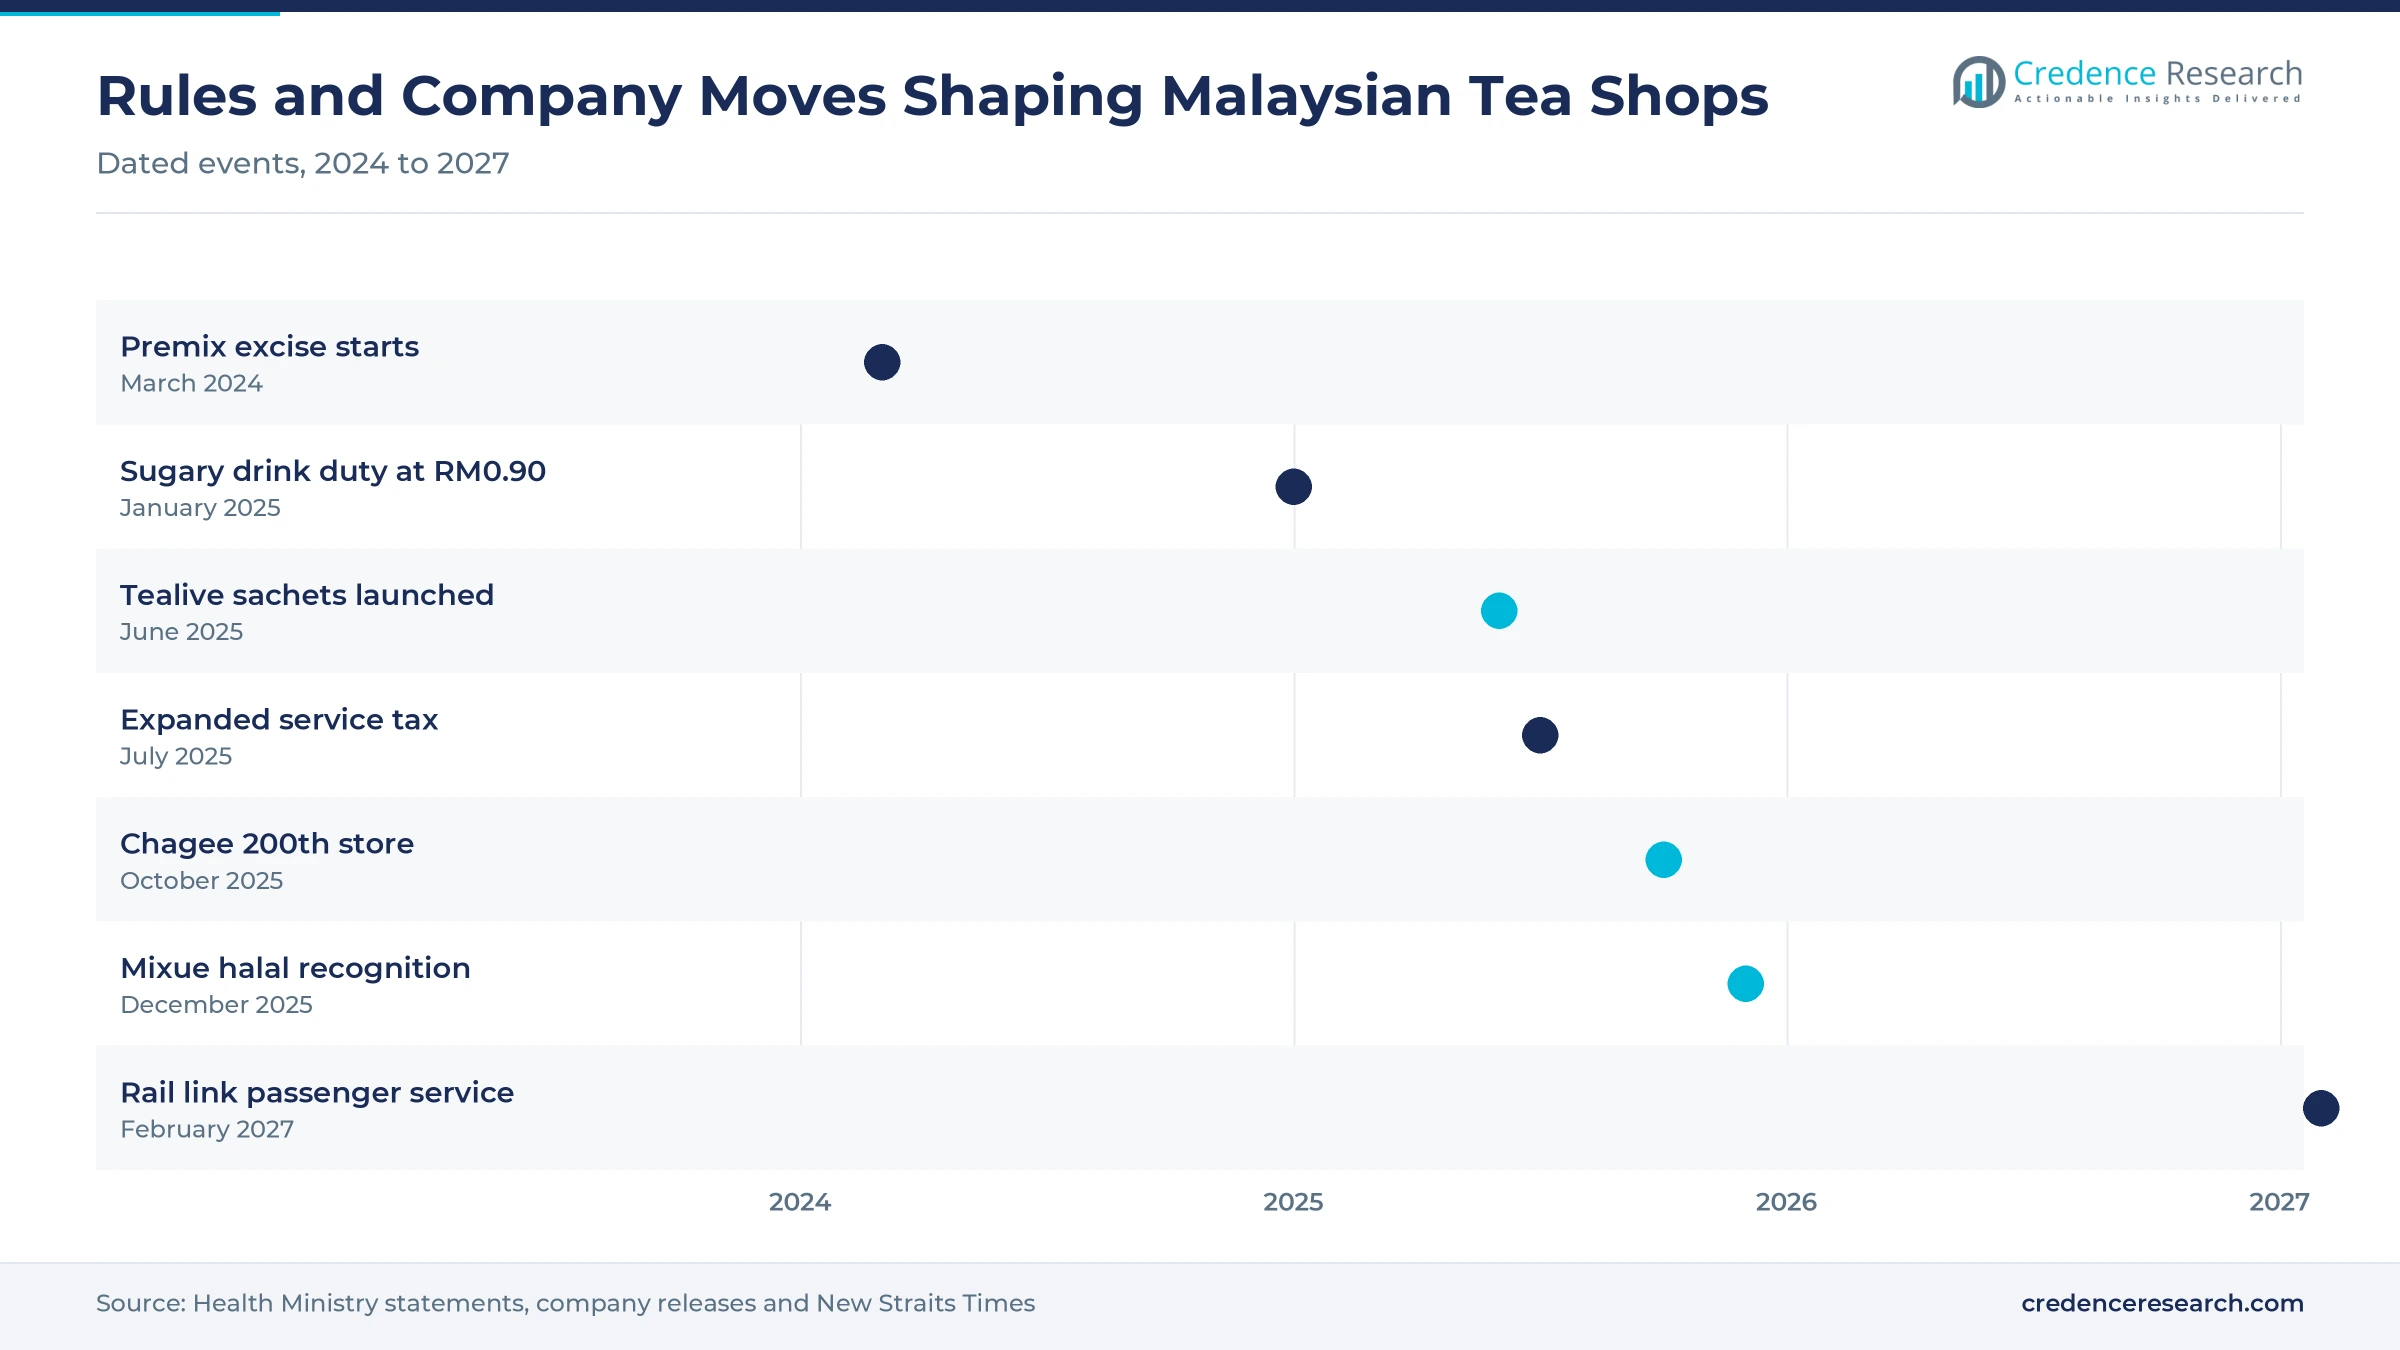
Dated moves by chains and regulators, 2024 to 2027
| Development | Status and market relevance |
|---|---|
| In June 2025, Tealive launched nine 3-in-1 flavors at RM12.90 a box and refreshed its store menu with light milk teas and Da Hong Pao tea. | Launched; extended to Jaya Grocer in February 2026 |
| In June 2025, Loob, the owner of Tealive, filed a draft prospectus for a Bursa Malaysia Main Market listing. | Listing timing not confirmed as of January 2026, The Edge reported |
| In October 2025, Chagee opened its 200th Malaysian store at Bukit Bintang WOLO in Kuala Lumpur. | Open; Malaysia is its flagship international market |
| In October 2025, the Health Ministry detailed a Nutri-Grade plan that would ban advertising for drinks above 10 grams of sugar per 100 milliliters. | Awaiting amendments to food regulations |
| In December 2025, Jakim recognized more than 100 Mixue outlets as halal-certified at a ceremony in Petaling Jaya. | Mixue reported 157 certified stores in February 2026 |
How operating formats are changing behind the counter
- Sugar grading is pushing chains to publish sweetness levels and rewrite recipes before labeling rules reach freshly made drinks.
- Halal audits now shape supplier selection, because Jakim certification covers ingredients and handling at each certified outlet.
- Kiosk formats cut floor space and opening costs, which lets budget chains enter suburban strips that could not support a full store.
- Sachet lines give store brands a packaged format with national grocery reach, since Tealive began selling through AEON in June 2025.
Need a Custom Version of This Report?
Tailor the scope, geography, or segments to your exact requirements.
- Custom geography or segment scope
- Direct access to our analyst team
A local leader faces budget and premium Chinese rivals
Competition in Malaysia bubble/boba tea is split into three distinct price tiers. Tealive is the local leader, with 831 Malaysian stores in February 2025 and more than 950 outlets across all its markets by January 2026, according to The Edge. Mixue attacks from below with drinks near RM5.50 and a franchise network that includes over 300 local store owners, according to its February 2026 release. Chagee attacks from above with fresh milk teas and a health positioning, and it reached 200 Malaysian stores in October 2025. Gong Cha and Chatime hold the mid-tier franchise range, where Eats365 estimates investment of RM400,000 to RM700,000 per outlet. Daboba, Tiger Sugar and Xing Fu Tang compete on signature pearls and in-store preparation. Bask Bear, also owned by Loob, and other coffee chains compete for the same afternoon visit. As a result, brands now compete on halal status, sugar options and store economics rather than only on flavor.
Companies profiled and their roles in this market
| Company | Type | Role in the market |
|---|---|---|
| Tealive | Local chain | Largest tea shop operator by store count in 2024, with 831 Malaysian stores in February 2025 |
| Mixue | Chinese budget chain | About 700 Malaysian outlets in December 2025, low-price franchised model |
| Chagee | Chinese premium chain | 200th Malaysian store in October 2025, first tea chain with the Healthier Dining logo |
| Gong Cha | International franchise | Mid-tier pearl and milk tea menu sold through Malaysian franchise outlets |
| Chatime | International franchise | Taiwanese brand operating in the mid-tier franchise range |
| Daboba | Local mid-premium chain | Known for honey golden pearls and roasted brown sugar fresh milk |
| Tiger Sugar | International specialty chain | Brown sugar drinks using large and small tapioca pearls |
| Xing Fu Tang | International specialty chain | Hand-shaken brown sugar pearl drinks, listed among Malaysian brands by Eats365 |
Credence Research view on who wins the next decade
Credence Research's view is that store count will stop being a reliable predictor of share in Malaysia bubble/boba tea. Tealive and Mixue together hold about 1,500 outlets, so new stores increasingly take sales from existing ones. Winners will be the chains that keep sugar options credible before labeling reaches fresh drinks, complete Jakim certification across all stores and hold rents below the level that makes a kiosk unprofitable. The Credence Research estimate therefore assumes volume growth slows after 2030, with the 6.40% rate increasingly dependent on higher prices for specialty and oolong recipes.
How Credence Research built the Malaysia estimate
The report uses 2025 as the base year, with 2026 as the first forecast year and 2035 as the final year. Market value comes from the Credence Research model, built bottom-up from disclosed outlet counts for the largest chains, estimated sales per store and an allowance for independent shops. This edition replaces the much lower value in earlier versions of this page, because disclosed store networks showed that value was too small. Per-store sales, segment shares and regional splits are Credence Research estimates. Sources used are government statistics, regulator statements, company releases, trade data and news reports. No interviews or surveys were conducted for this Malaysia bubble/boba tea estimate.
Outlet quality matters more than outlet count to 2035
Through 2035, the market grows from USD 373.5 million in 2026 to USD 652.7 million, with growth depending more on recipe and price mix than on new doors. Klang Valley stays largest, although Johor Bahru and East Malaysia gain share as rail links and franchise partners extend reach. Milk tea keeps its lead, while specialty and oolong recipes take a growing portion of premium spending. The main risk is the extension of Nutri-Grade rules to fresh drinks, which could shrink the highest-sugar recipes, although chains that reformulate early would lose little volume.
Frequently Asked Questions
How big is the Malaysia bubble tea market?
What is the largest bubble tea brand in Malaysia?
How many bubble tea outlets do the main brands have in Malaysia?
How much does boba tea cost in Malaysia?
Is bubble tea in Malaysia halal?
Are freshly made bubble teas subject to sugar tax in Malaysia?
Which region leads the Malaysia boba tea market?
What are the key bubble tea trends in Malaysia?
Table of Content
Chapter 1 Market Segmentation
- 1.1 Segmentation Framework
- 1.1.1 Product and Service Classification
- 1.1.2 Application and End-Use Classification
- 1.1.3 Technology and Solution Classification
- 1.1.4 Customer and Distribution Channel Classification
- 1.1.5 Geographic Segmentation
- 1.1.6 Market Segment Definitions and Boundaries
- 1.2 By Type
- 1.2.1 Milk Tea
- 1.2.2 Fruit Tea
- 1.2.3 Specialty Tea
- 1.3 By Toppings
- 1.3.1 Tapioca Pearls
- 1.3.2 Jelly
- 1.3.3 Popping Boba
- 1.3.4 Pudding
- 1.4 By Base Tea Type
- 1.4.1 Black Tea
- 1.4.2 Green Tea
- 1.4.3 Oolong Tea
- 1.4.4 Herbal Tea
Chapter 2 Introduction
- 2.1 Report Objectives and Scope
- 2.2 Product Definition and Industry Terminology
- 2.3 Market Inclusions and Exclusions
- 2.4 Research Process
- 2.4.1 Primary Research and Expert Interviews
- 2.4.2 Secondary Research and Source Review
- 2.4.3 Top-Down and Bottom-Up Estimation
- 2.4.4 Data Triangulation and Verification
- 2.5 Market Size Measurement Basis
- 2.5.1 2025: USD 351.0 million → 2035: USD 652.7 million
- 2.6 Historical and Forecast Reference Periods
- 2.6.1 Historical Period: 2018-2025
- 2.6.2 Base Year: 2025
- 2.6.3 Forecast Period: 2025-2035
- 2.7 Research Assumptions and Limitations
Chapter 3 Executive Summary
- 3.1 Market Snapshot and Key Findings
- 3.2 Base-Year Market Size, 2025
- 3.3 Forecast Market Size, 2035
- 3.4 Revenue and Volume Growth Outlook
- 3.5 Key Demand and Supply Indicators
- 3.6 Leading Market Segments
- 3.7 Fastest-Growing Market Opportunities
- 3.8 Regional Performance Highlights
- 3.9 Technology and Industry Transformation
- 3.10 Competitive Landscape Summary
- 3.11 Analyst View and Strategic Implications
Chapter 4 Malaysia Bubble/Boba Tea Market Trends and Developments
- 4.1 Historical Industry Development, 2018-2025
- 4.2 Recent Market Trends and Developments
- 4.3 Demand and Customer Behavior Trends
- 4.4 Technology and Product Innovation
- 4.5 Artificial Intelligence, Automation and Digitalization
- 4.6 Local Manufacturing and Supply Chain Realignment
- 4.7 Industry Partnerships, Mergers and Acquisitions
- 4.8 Sustainability and Circular Economy Developments
- 4.9 Government and Private Sector Investment Trends
- 4.10 Emerging Business Models and Commercialization
- 4.11 Industry Developments and Announcements
Chapter 5 Malaysia Bubble/Boba Tea Market Production, Supply and Demand Analysis
- 5.1 Demand Trend and Consumption Analysis, 2018-2025
- 5.2 Demand Forecast, 2025-2035
- 5.3 Production and Output Trend, 2018-2025
- 5.4 Production and Output Forecast, 2025-2035
- 5.5 Installed Capacity and Capacity Utilization
- 5.6 Company-Wise Production Plants and Statistics
- 5.6.1 Installed Production Capacity
- 5.6.2 Actual Production
- 5.6.3 Planned Capacity and Expansion Targets
- 5.7 Supply Chain Structure and Procurement Trends
- 5.8 Supply-Demand Gap and Bottlenecks
- 5.9 Import Dependence and Sourcing Structure
- 5.10 Contract Manufacturing and Outsourcing
- 5.11 Regional Supply and Demand Concentration
Chapter 6 Malaysia Bubble/Boba Tea Market Pricing Analysis
- 6.1 Pricing Structure and Measurement
- 6.2 Historical Pricing Trends, 2018-2025
- 6.3 Pricing Outlook, 2025-2035
- 6.4 Average Selling Price and Unit Economics
- 6.5 Pricing by Product and Market Segment
- 6.6 Geographic Pricing Differences
- 6.7 Key Input, Energy, Labor and Logistics Costs
- 6.8 Contract Pricing and Purchasing Models
- 6.9 Pricing Sensitivity and Competitive Positioning
- 6.10 Price, Margin and Profitability Implications
Chapter 7 Malaysia Bubble/Boba Tea Market Dynamics
- 7.1 Market Growth Drivers
- 7.1.1 Demand-Side Drivers
- 7.1.2 Technology and Innovation Drivers
- 7.1.3 Infrastructure and Investment Drivers
- 7.1.4 Regulatory and Policy Drivers
- 7.2 Market Restraints
- 7.2.1 Cost and Affordability Constraints
- 7.2.2 Technology and Adoption Barriers
- 7.2.3 Supply Chain and Operational Constraints
- 7.3 Market Challenges
- 7.3.1 Competitive Pressure and Margin Erosion
- 7.3.2 Skills, Infrastructure and Implementation Gaps
- 7.4 Emerging Market Opportunities
- 7.5 Market Dynamics Impact and Time-Horizon Assessment
Chapter 8 Malaysia Bubble/Boba Tea Value Chain Analysis
- 8.1 Industry Value Chain Overview
- 8.2 Upstream Suppliers and Critical Inputs
- 8.3 Technology and Component Providers
- 8.4 Manufacturing or Service Delivery
- 8.5 Distribution, Channel Partners and Integrators
- 8.6 Downstream Applications and End Users
- 8.7 Value Addition and Profit Pools
- 8.8 Vertical Integration and Outsourcing
- 8.9 Supplier Concentration and Risk
- 8.10 Supply Chain Localization and Resilience
Chapter 9 Malaysia Bubble/Boba Tea Market Regulations and Policies
- 9.1 Relevant Laws, Standards and Compliance Frameworks
- 9.2 Product, Service, Safety and Quality Requirements
- 9.3 Government Policies, Incentives and Subsidies
- 9.4 Imports, Exports and Trade Barriers
- 9.5 Public Procurement and Local Content Requirements
- 9.6 Environmental and Sustainability Compliance
- 9.7 Upcoming Policy Changes and Market Implications
Chapter 10 Malaysia Bubble/Boba Tea Market Hotspots and Opportunities
- 10.1 Market Opportunity Mapping and Growth Hotspots
- 10.2 High-Growth Applications and Customer Groups
- 10.3 Underserved Markets and White-Space Opportunities
- 10.4 Emerging Technology and Product Opportunities
- 10.5 New Capacity and Investment Hotspots
- 10.6 Market Entry and Expansion Opportunities
- 10.7 Distribution and Partnership Opportunities
- 10.8 Near-Term and Long-Term Commercial Potential
- 10.9 Opportunity Attractiveness and Execution Risks
Chapter 11 Malaysia Bubble/Boba Tea Market Outlook, 2025-2035
- 11.1 Market Size and Analysis
- 11.1.1 Revenue (Market Measurement: 2025: USD 351.0 million → 2035: USD 652.7 million)
- 11.1.2 Market Volume and Quantity Sold
- 11.1.3 Historical Market Size, 2018-2025
- 11.1.4 Base-Year Market Size, 2025
- 11.2 Market Forecast, 2025-2035
- 11.2.1 Revenue Forecast to 2035
- 11.2.2 Volume Forecast to 2035
- 11.2.3 CAGR and Year-on-Year Growth
- 11.2.4 Incremental Revenue Opportunity
- 11.3 Forecast Assumptions and Scenario Analysis
- 11.3.1 Base-Case Forecast
- 11.3.2 Optimistic and Conservative Scenarios
- 11.3.3 Technology, Pricing and Policy Sensitivities
- 11.4 Market Attractiveness and Growth Outlook
Chapter 12 Malaysia Bubble/Boba Tea Market Segmentation and Outlook
- 12.1 Segmentation Summary and Market Shares, 2025
- 12.2 Largest and Fastest-Growing Segments
- 12.3 By Type - Market Size and Forecast, 2025-2035
- 12.3.1 Segment Definition and Scope
- 12.3.2 Historical Market Size, 2018-2025
- 12.3.3 Revenue Forecast, 2025-2035
- 12.3.4 Volume Forecast, 2025-2035
- 12.3.5 Base-Year Market Share, 2025
- 12.3.6 Segment CAGR and Growth Drivers
- 12.3.7 Subsegment Market Size and Forecast
- 12.3.7.1 Milk Tea
- 12.3.7.2 Fruit Tea
- 12.3.7.3 Specialty Tea
- 12.3.8 Subsegment Pricing and Adoption Trends
- 12.3.9 Leading Suppliers and Competition
- 12.3.10 Regional Demand and Opportunities
- 12.4 By Toppings - Market Size and Forecast, 2025-2035
- 12.4.1 Segment Definition and Scope
- 12.4.2 Historical Market Size, 2018-2025
- 12.4.3 Revenue Forecast, 2025-2035
- 12.4.4 Volume Forecast, 2025-2035
- 12.4.5 Base-Year Market Share, 2025
- 12.4.6 Segment CAGR and Growth Drivers
- 12.4.7 Subsegment Market Size and Forecast
- 12.4.7.1 Tapioca Pearls
- 12.4.7.2 Jelly
- 12.4.7.3 Popping Boba
- 12.4.7.4 Pudding
- 12.4.8 Subsegment Pricing and Adoption Trends
- 12.4.9 Leading Suppliers and Competition
- 12.4.10 Regional Demand and Opportunities
- 12.5 By Base Tea Type - Market Size and Forecast, 2025-2035
- 12.5.1 Segment Definition and Scope
- 12.5.2 Historical Market Size, 2018-2025
- 12.5.3 Revenue Forecast, 2025-2035
- 12.5.4 Volume Forecast, 2025-2035
- 12.5.5 Base-Year Market Share, 2025
- 12.5.6 Segment CAGR and Growth Drivers
- 12.5.7 Subsegment Market Size and Forecast
- 12.5.7.1 Black Tea
- 12.5.7.2 Green Tea
- 12.5.7.3 Oolong Tea
- 12.5.7.4 Herbal Tea
- 12.5.8 Subsegment Pricing and Adoption Trends
- 12.5.9 Leading Suppliers and Competition
- 12.5.10 Regional Demand and Opportunities
- 12.6 Segment Growth Comparison
- 12.7 Segment Attractiveness and Priority Matrix
Chapter 13 Malaysia Bubble/Boba Tea Geographic Market Outlook, 2025-2035
- 13.1 Domestic Market Distribution and Demand Clusters
- 13.2 State- or Province-Wise Market Size and Forecast, 2025-2035
- 13.3 City and Metropolitan Market Outlook
- 13.4 Industrial, Manufacturing and Commercial Clusters
- 13.5 Geographic Concentration of Key End Users
- 13.6 Local Pricing and Purchasing Differences
- 13.7 Domestic Production Facilities and Capacity Map
- 13.8 Local Infrastructure and Project Pipeline
- 13.9 State-Level Policy and Incentive Differences
- 13.10 Subnational Investment Hotspots and Opportunities
- 13.11 Distribution and Logistics Networks
- 13.12 Domestic Competitive Footprint
Chapter 14 Malaysia Bubble/Boba Tea Technology, Innovation and Sustainability Outlook
- 14.1 Technology Landscape and Maturity
- 14.2 Product, Process and Service Innovation
- 14.3 AI, Automation and Digital Tools in the Industry
- 14.4 Technology Adoption and Performance Benchmarking
- 14.5 Innovation Pipeline and R&D Investment
- 14.6 Patent and Intellectual Property Trends
- 14.7 Energy Efficiency and Resource Management
- 14.8 Sustainability, Recycling and Circularity
- 14.9 Technology Roadmap, 2025-2035
- 14.10 Risks of Obsolescence and Technology Substitution
Chapter 15 Malaysia Bubble/Boba Tea Market Key Strategic Imperatives
- 15.1 Growth and Market Entry Priorities
- 15.2 High-Return Products and Segments
- 15.3 Pricing, Profitability and Cost Optimization
- 15.4 Technology Investment and Product Differentiation
- 15.5 Supply Chain Localization and Resilience
- 15.6 Distribution and Customer Acquisition
- 15.7 Partnership, Acquisition and Capacity Strategy
- 15.8 Regional Expansion Priorities
- 15.9 Short-, Medium- and Long-Term Actions
Chapter 16 Competition Outlook
- 16.1 Industry Competition Characteristics
- 16.2 Market Structure and Concentration
- 16.3 Market Share and Competitive Positioning, 2025
- 16.4 Company-Wise Revenue and Product Benchmarking
- 16.5 Production and Service Capacity Benchmarking
- 16.6 Technology, Pricing and Differentiation
- 16.7 Regional Footprint and Distribution Strength
- 16.8 Mergers, Acquisitions and Strategic Alliances
- 16.9 New Entrants and Competitive Threats
- 16.10 Porter's Five Forces and Industry Attractiveness
- 16.11 Competitive Outlook, 2025-2035
Chapter 17 Company Profiles
- 17.1 Company Coverage and Selection Criteria
- 17.2 Tealive
- 17.2.1 Business Description
- 17.2.2 Company Ownership and Geographic Presence
- 17.2.3 Product and Service Portfolio
- 17.2.4 Manufacturing and Operating Footprint
- 17.2.5 Production Capacity and Expansion Plans
- 17.2.6 Financial Performance and Investment
- 17.2.7 Market Share and Competitive Position
- 17.2.8 Technology and Innovation Capabilities
- 17.2.9 Strategic Alliances or Partnerships
- 17.2.10 Recent Developments
- 17.2.11 Growth Strategy and Outlook
- 17.3 Mixue
- 17.4 Chagee
- 17.5 Gong Cha
- 17.6 Chatime
- 17.7 Daboba
- 17.8 Tiger Sugar
- 17.9 Xing Fu Tang
- 17.10 Other Relevant Market Participants
Note: Every listed company is profiled on the structure shown under the first company. The company list is preliminary and may change based on research findings, market developments, data availability and client requirements.
Chapter 18 Disclaimer
- 18.1 Research and Forecast Disclaimer
- 18.2 Data Source and Estimation Limitations
Note: The depth of individual sections depends on data availability for this market. Volume, capacity, trade and other unit-based metrics are included where applicable.