
Data halls and factories now outpace housing in work done
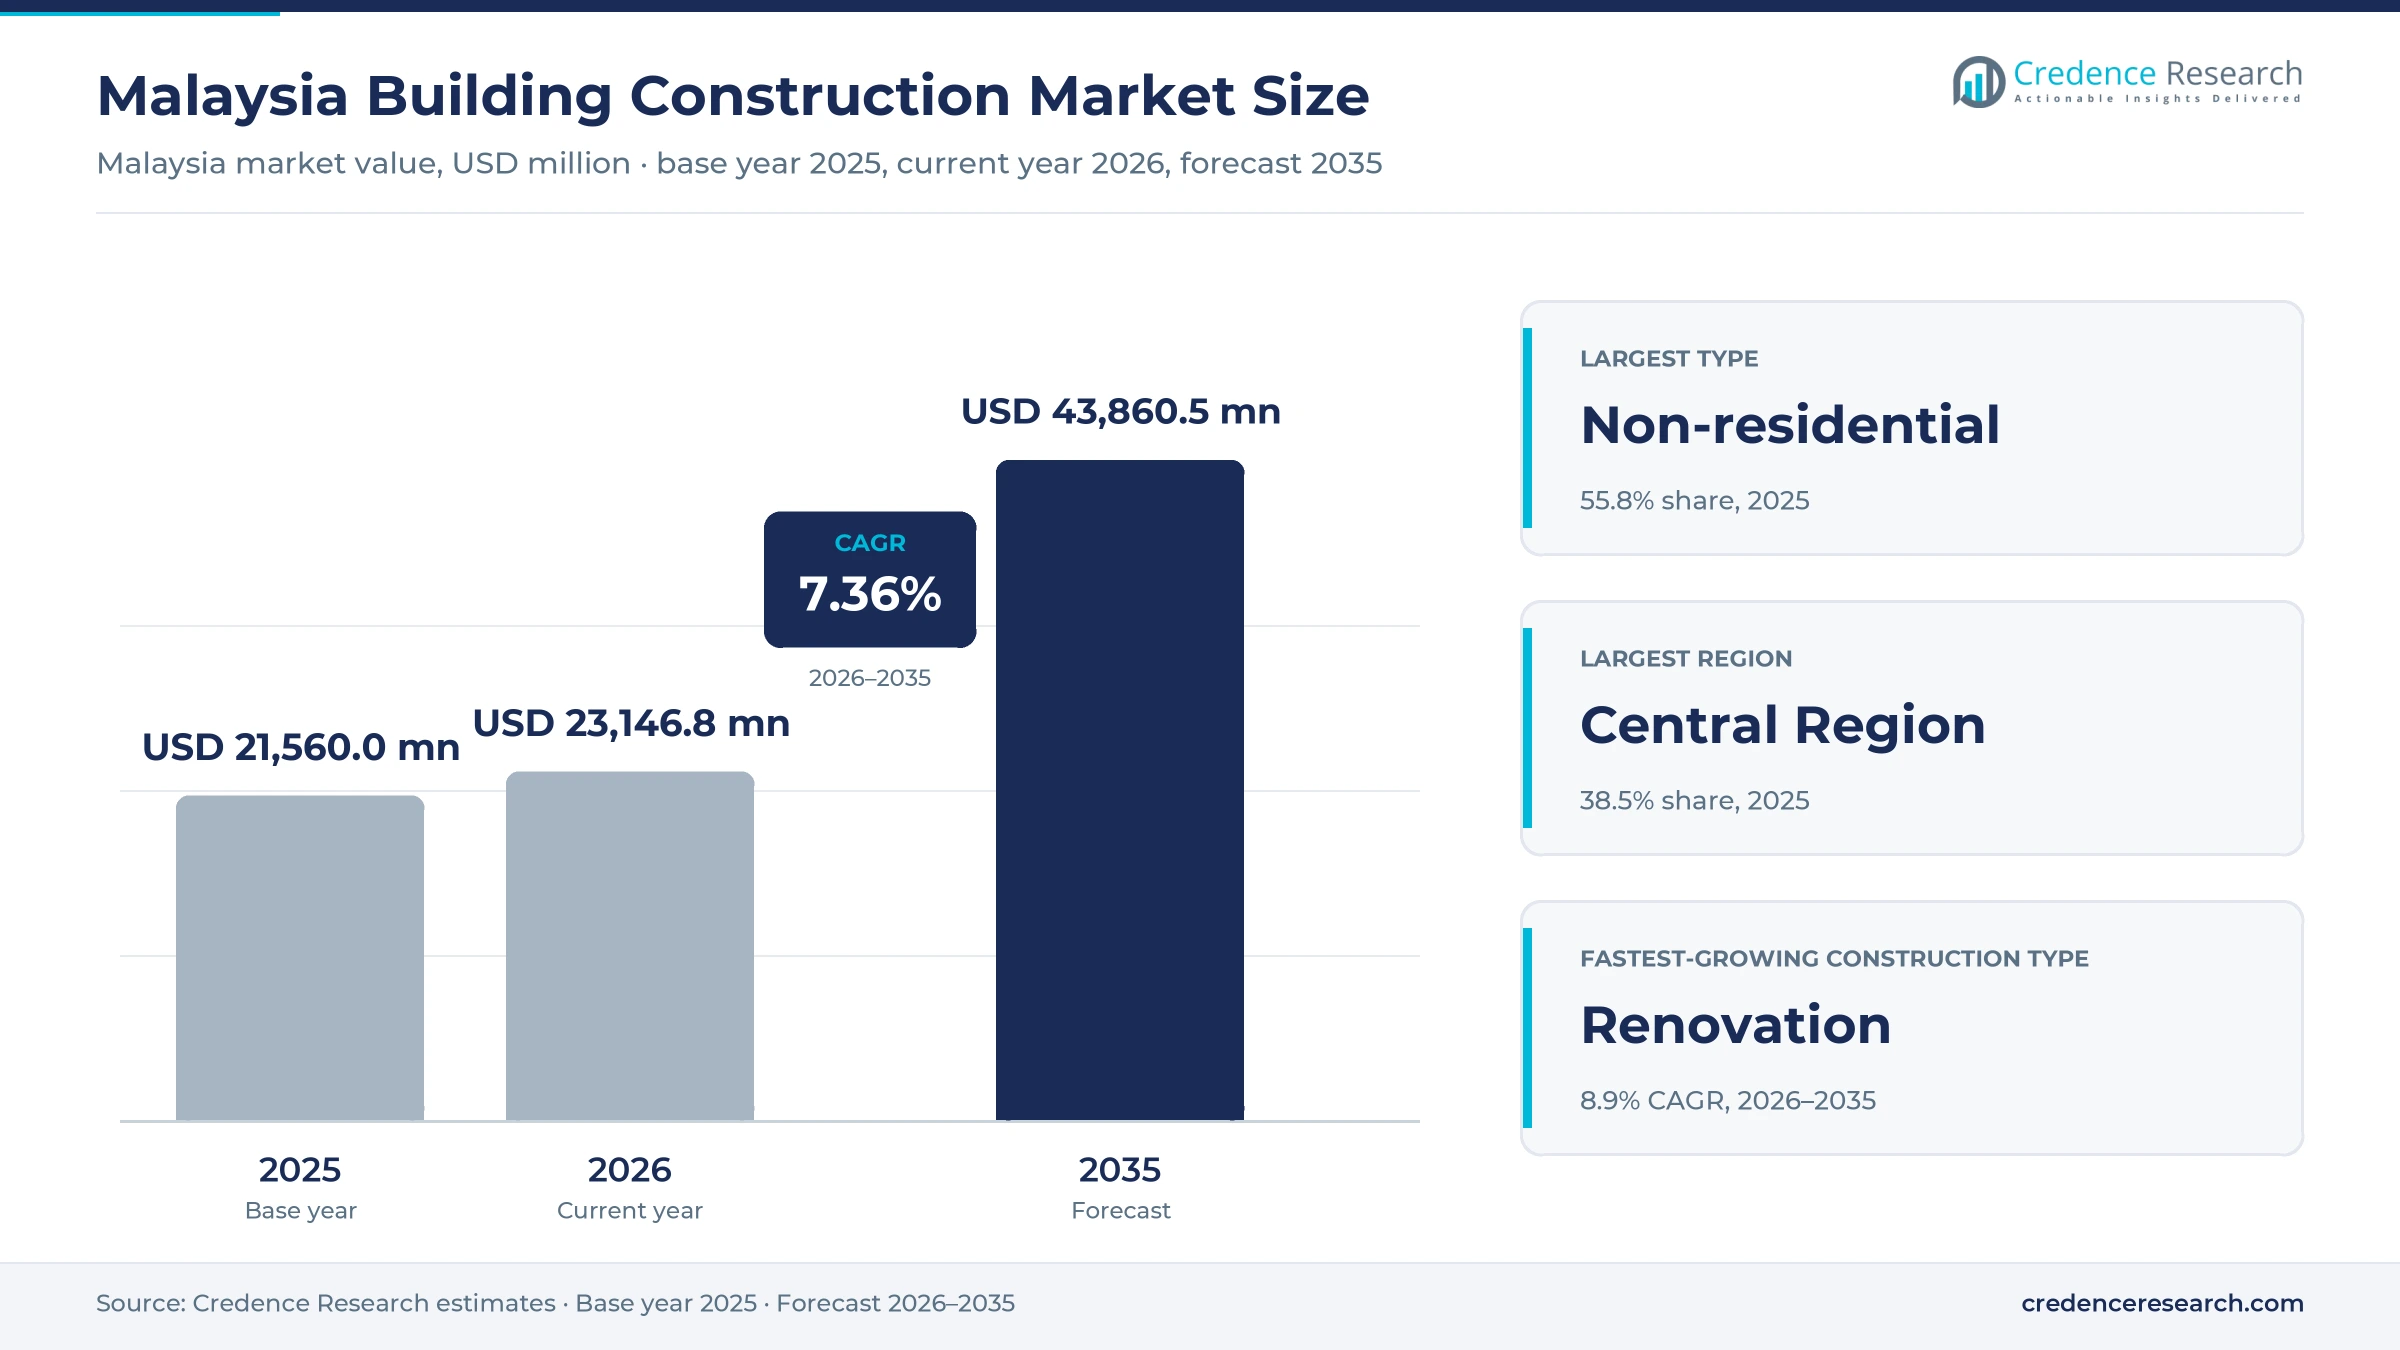
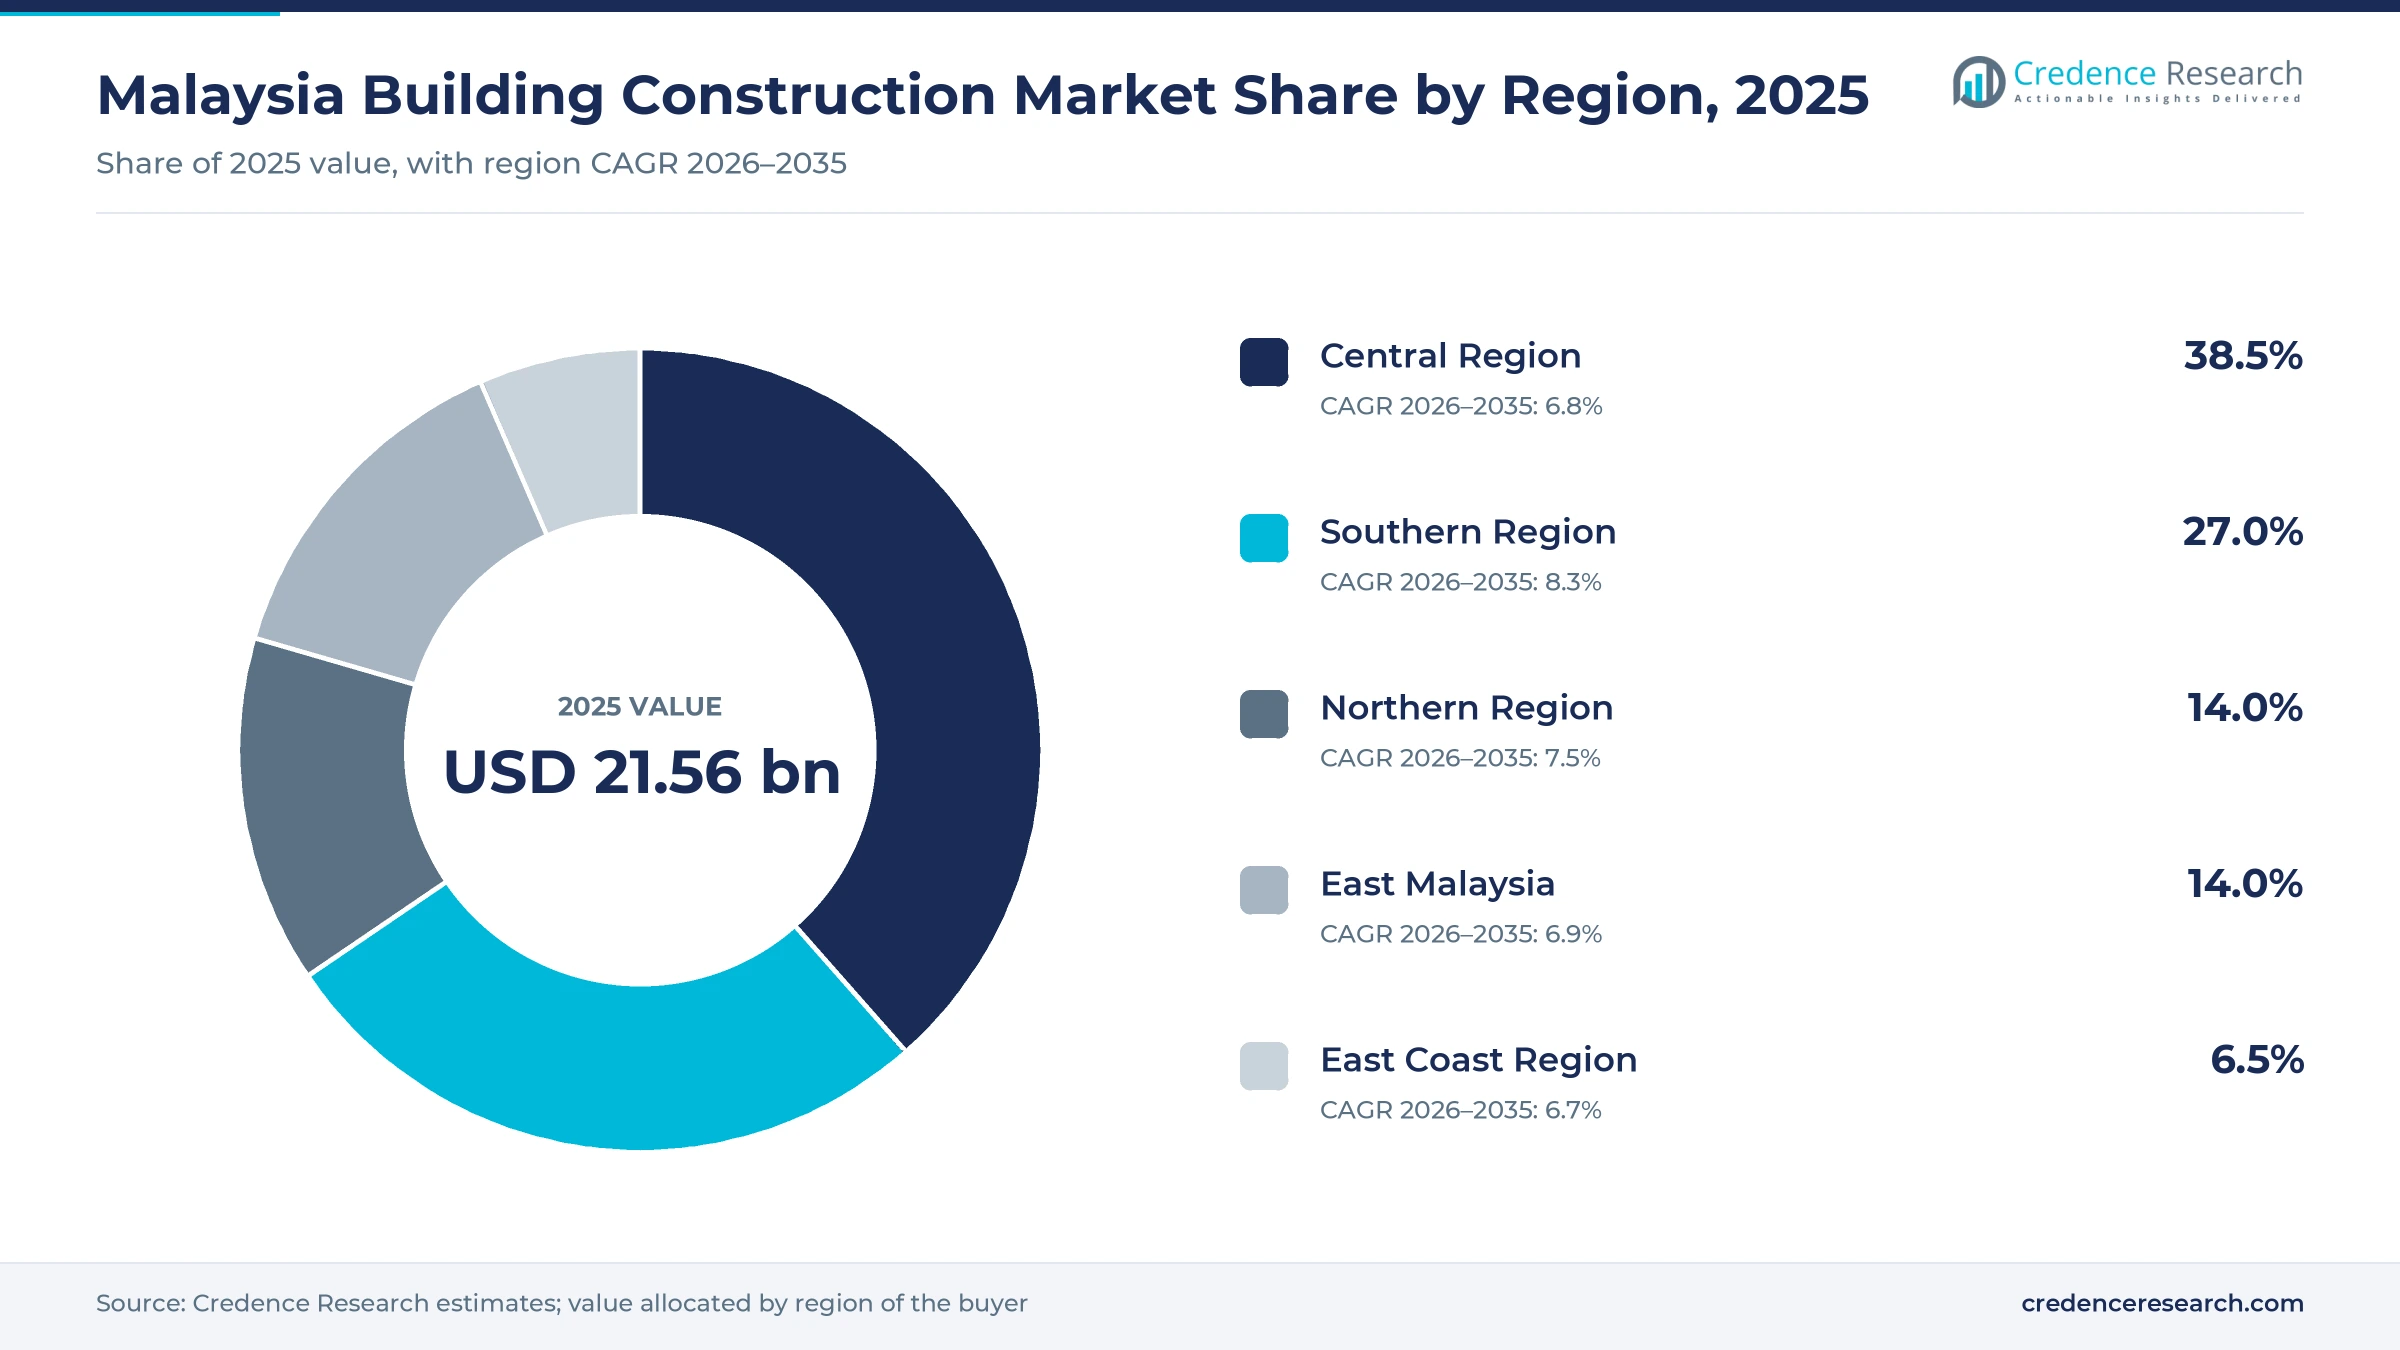
The Malaysia building construction market was valued at USD 21.56 billion in 2025 and is projected to increase from USD 23.15 billion in 2026 to USD 43.86 billion by 2035, registering a CAGR of 7.36% during 2026–2035. Work is commissioned by property developers, data centre operators, manufacturers expanding plants and federal and state agencies building schools, clinics and staff housing. The Central Region held the largest regional share, 38.5% in 2025, because Selangor, Kuala Lumpur and Putrajaya combine the densest housing demand with most corporate and government floor space. The Southern Region is the fastest-growing region at 8.3% a year, as hyperscale data halls in Johor and Negeri Sembilan move from approval to site work. The main commercial change is fiscal, since service tax on non-residential construction services took effect in July 2025, a charge that lifts the delivered cost of offices, factories and data halls but leaves housing contracts untouched.
Buildings make up just over half of construction work done
This report sizes the value of residential and non-residential building work done in the country each year, covering new buildings, extensions and repair work on houses, apartments, offices, shops, factories, warehouses, data centres, hospitals and schools. Official statistics put total construction work done at RM178.6 billion in 2025, up 12.5% on the year, and building work accounted for just over half of that total.
Civil engineering projects such as roads, railways and utility networks are excluded, as are stand-alone special trade jobs such as site preparation and electrical installation. Land, design fees and the value of building materials sold through dealers are also outside the estimate, although materials used on site are included in the value of the work.
Malaysia Building Construction Market Insights
- The Malaysia building construction market was worth USD 21.56 billion in 2025 and is forecast to reach USD 43.86 billion by 2035, growing at 7.36% a year during 2026–2035.
- The Central Region held 38.5% of 2025 building work, while the Southern Region grows fastest at 8.3% a year on data hall and industrial projects.
- Non-residential buildings made up 55.8% of 2025 building work, because data centres, factories and offices now absorb more contract value than housing.
- By mid-2026, Tenaga Nasional had signed electricity supply agreements for 59 data centre projects totaling about 8,300 MW, with Johor holding 68% of that capacity.
- Service tax of 6% on non-residential construction services took effect in July 2025, while residential buildings were excluded from the charge.
Non-residential work leads and private clients set the pace
Why do non-residential projects absorb most contract value?
Based on type, the market is categorized into residential and non-residential buildings. Non-residential work led with 55.8% of 2025 value, because data halls, factories and offices carry higher costs per square meter than housing, and official statistics show non-residential work of RM14.0 billion in the fourth quarter of 2025 against RM10.5 billion for residential work. Non-residential work also grows fastest at 7.7% a year, since non-residential output still rose 13.3% in the second quarter of 2026 while residential growth eased to 8.7%. Housing remains exposed to unsold stock, and that pressure holds its share down.
Why does new construction still outweigh renovation?
Based on construction type, the market is categorized into new construction and renovation. New Construction led with 82.0% of 2025 value, because greenfield data halls, industrial parks and high-rise apartments need full site works, while repair work is concentrated in public housing and older commercial buildings. Renovation grows fastest at 8.9% a year as aging public flats need upgrades, with RM143 million set aside in Budget 2026 for maintaining low- and medium-cost strata homes, including lift replacement. Official statistics do not split new and repair work, so this split carries more uncertainty than the others.
Why do private clients commission most buildings?
Based on end user, the market is categorized into private and public clients. Private clients led with 76.0% of 2025 building value, because developers, manufacturers and data centre operators fund most building projects, and private work grew 14.3% for non-residential and 13.4% for residential buildings in the third quarter of 2025. Private work also grows faster at 7.5% a year, as private work rose 11.4% in the second quarter of 2026 against 4.1% for public work. Public clients remain the steadier buyer when private launches slow.
| Segment Group | Leading Sub-segment | Share, 2025 | Fastest-growing Sub-segment | CAGR, 2026–2035 |
|---|---|---|---|---|
| By Type | Non-residential | 55.8% | Non-residential | 7.7% |
| By Construction Type | New Construction | 82.0% | Renovation | 8.9% |
| By End User | Private | 76.0% | Private | 7.5% |
Cement edges up while steel bars ease for contractors
Most building contracts in Malaysia are fixed lump-sum awards, so contractors carry the risk of material and labor costs moving after the tender. Cement and sand prices rose through 2025, with the cement price index up 2.0% to 6.1% a year across regions in December, while steel bar prices fell 3.2% to 7.1% over the same period. These opposite moves favor steel-framed industrial buildings and precast systems over cast-in-place concrete towers. The higher minimum wage and the new service tax on non-residential work raise delivered costs, which owners of factories and data halls absorb more easily than housing developers selling to price-sensitive buyers.
| Cost item | Typical price or fee | Basis |
|---|---|---|
| Ordinary Portland cement, December 2025 | About RM24.55 per 50 kg bag | Department of Statistics Malaysia, December 2025 |
| Mild steel round and Mycon 60 bars, December 2025 | About RM3,512 per metric ton | Department of Statistics Malaysia, December 2025 |
| Minimum monthly wage, from February 2025 | RM1,700 per month | Minimum Wage Order, effective Feb. 1, 2025 |
| Service tax on non-residential construction services | 6% from July 2025 | KPMG Malaysia summary, June 2025 |
| Data centre civil and structural works, Johor Bahru | About RM22,600 per square meter of floor area | Credence Research calculation from IJM release, August 2025 |
Request a Free Sample
Fill in your details and we'll send you a free sample report.
- Sample data tables & charts
- Research methodology
Data centres, record investment and housing aid lift work
Hyperscale data halls swell non-residential work
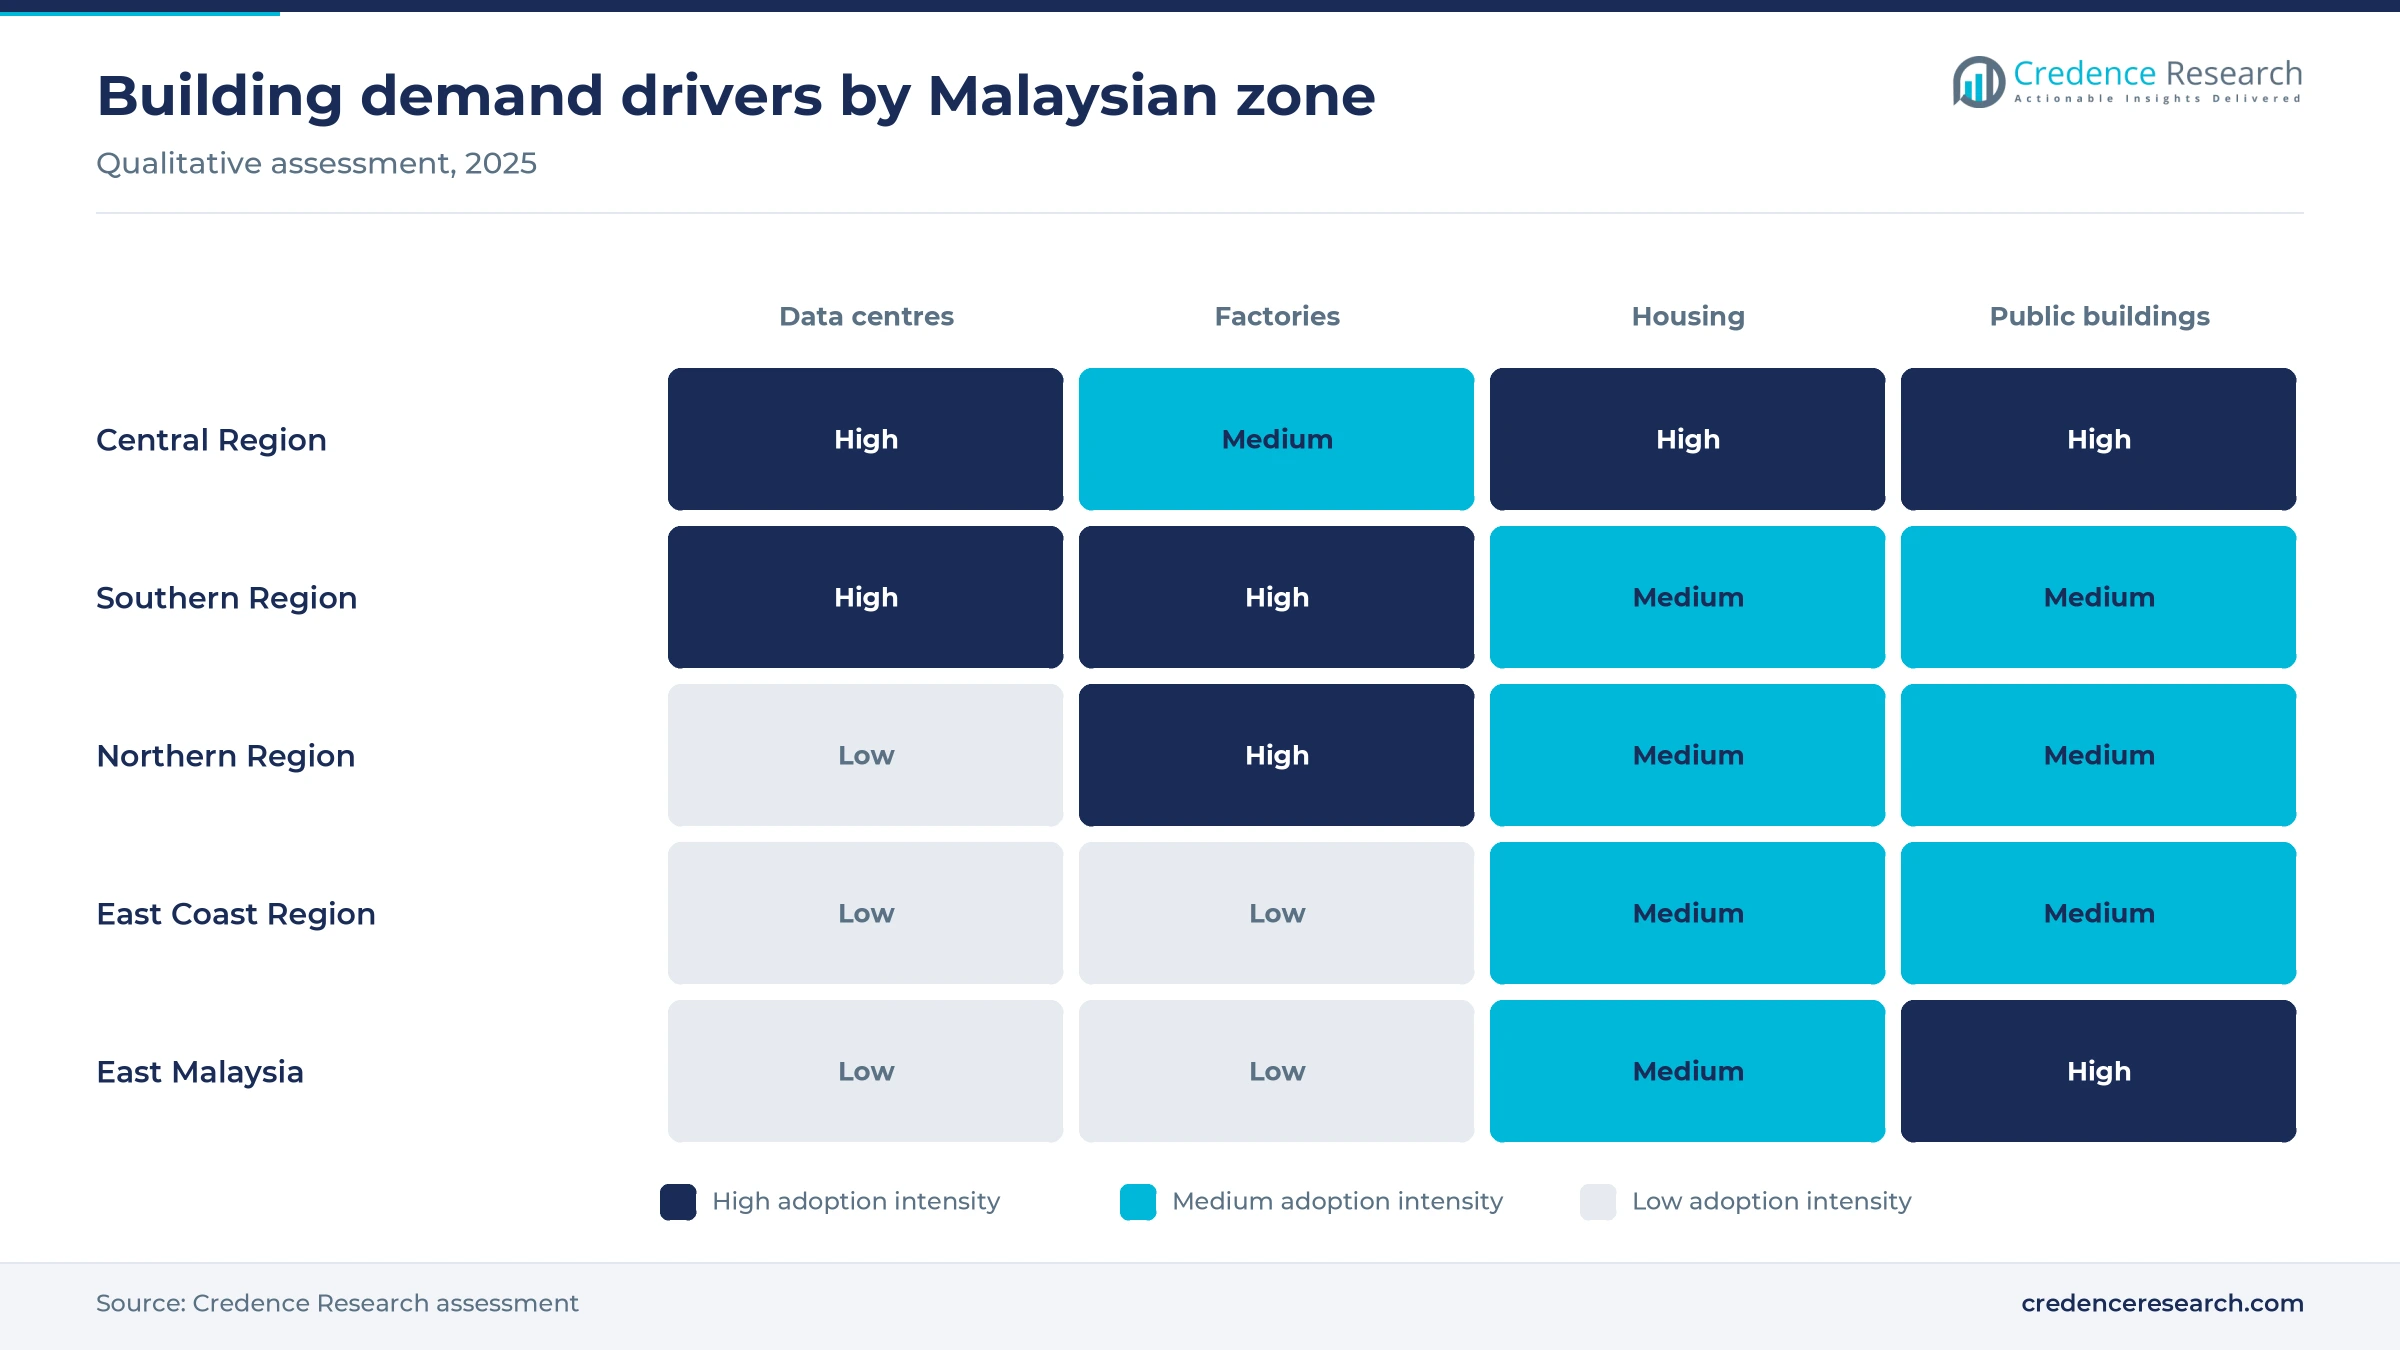
Data centres have become the largest single source of demand for new non-residential contracts, because each campus needs large concrete halls, substations and heavy mechanical fit-out within tight schedules. Tenaga Nasional has signed electricity supply agreements for 59 data centre projects with about 8,300 MW of capacity, of which 36 projects with 4,500 MW were completed, Business Today reported in July 2026. Johor accounted for 68% of that contracted capacity, the largest share of any state. The Johor state government said it approved 42 data centre construction projects in the second quarter of 2025 alone. Non-residential work grew 16.3% in 2025, faster than any building category, and contractors with data hall credentials collect most of these awards.
Record approved investment fills factory and office pipelines
Approved investment turns into factory, warehouse and office orders once investors move to site, which gives builders visible future work. MIDA reported record approved investments of RM426.7 billion in 2025, up 11.0% on the year, including RM131.3 billion in manufacturing across 1,354 projects. Penang alone approved RM22.4 billion of manufacturing investment in 2025, up 29%, across 232 projects, The Star reported in March 2026. Information and communication projects, which include data centres and cloud facilities, accounted for RM152.9 billion of the approved total. Industrial builders in Penang, Kedah, Selangor and Johor benefit first, while office contractors depend on tenant expansion in Kuala Lumpur.
Housing finance support keeps residential starts moving
Federal support for first-time buyers keeps developers launching projects even as unsold stock persists, because it widens the pool of buyers who qualify for loans. Budget 2026 doubled the housing credit guarantee scheme from RM10 billion to RM20 billion, which the government said would help 80,000 first-time buyers, including gig workers. The budget extended full stamp duty exemption for first homes priced up to RM500,000 until Dec. 31, 2027. It also allocated RM672 million to build homes under the Residensi Rakyat and Rumah Mesra Rakyat programs. Residential work grew 13.9% in 2025, and contractors focused on mid-priced apartments benefit most.
Public development spending sustains institutional building
Public budgets fund a steady stream of schools, clinics, quarters and sports facilities, which cushions contractors when private launches slow. Budget 2026 set federal development spending at RM81 billion, including RM2.2 billion to build, maintain and repair quarters for doctors, nurses, teachers, police and soldiers. Sabah received RM6.9 billion and Sarawak RM6 billion in development allocations, the highest among the states. The Kota Madani project in Precinct 19 of Putrajaya plans 10,000 homes, with 80% reserved for civil servants. Public-sector construction work, which includes roads and utilities as well as buildings, grew 13.4% in the fourth quarter of 2025, according to the Department of Statistics Malaysia, giving mid-sized contractors registered for government tenders a steadier base of work.
Precast systems, green ratings and fit-out work reshape jobs
Precast and modular systems rise on fast-track jobs
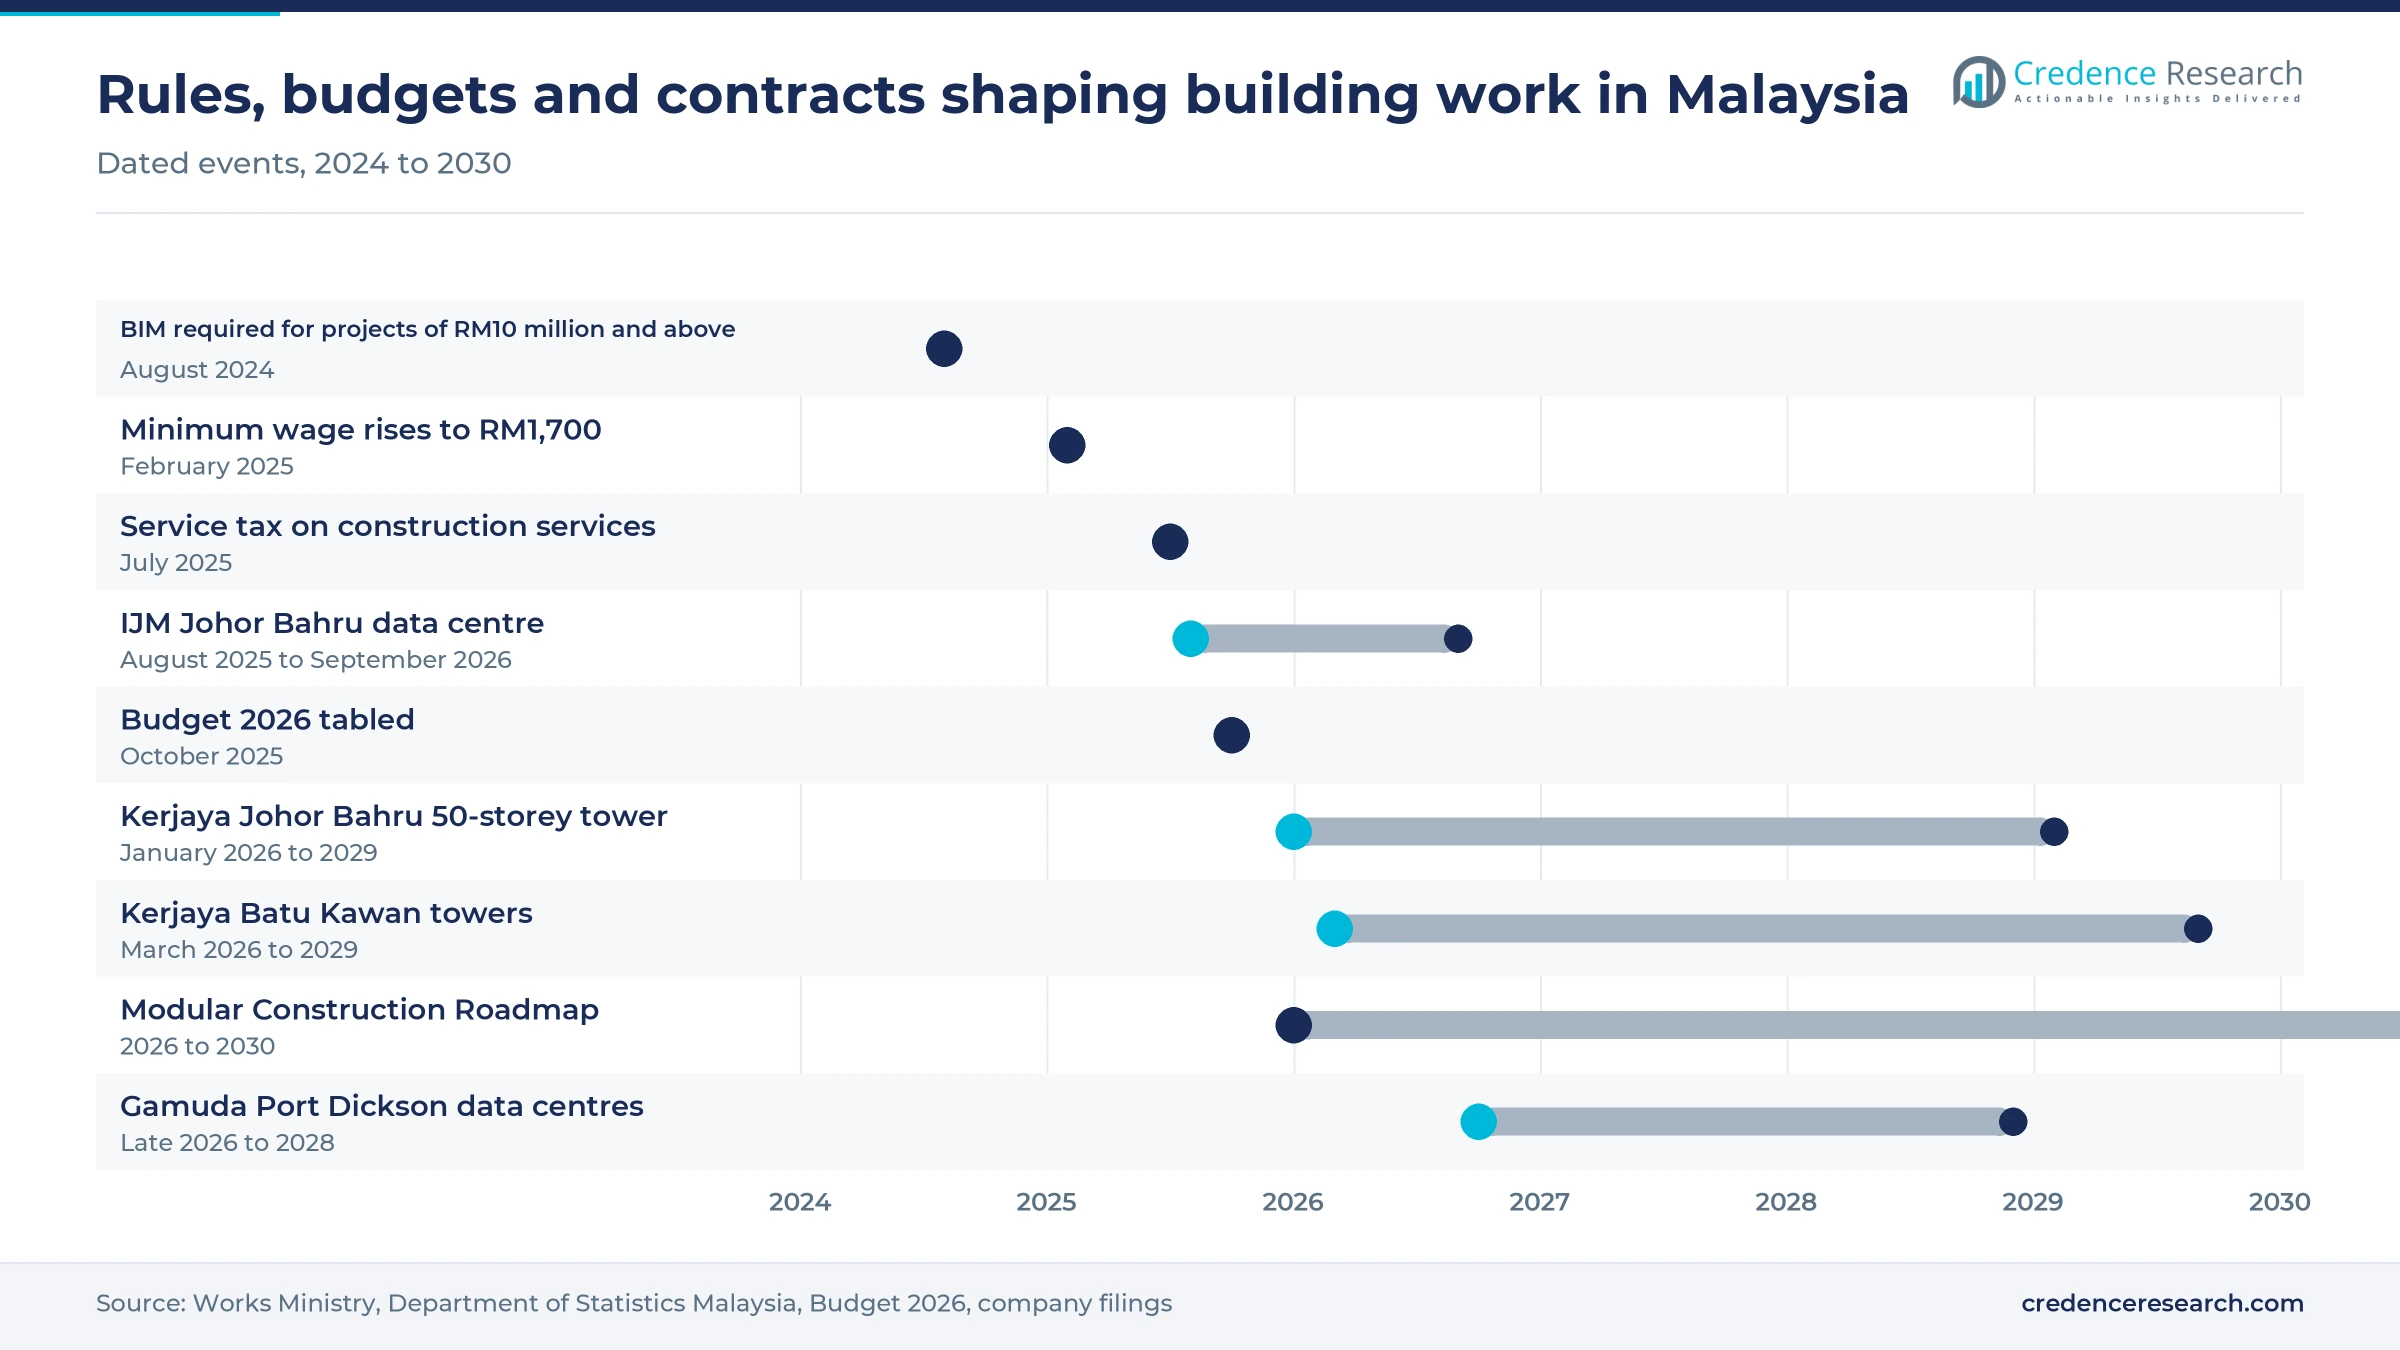
Contractors are shifting from cast-in-place concrete toward factory-made components to meet compressed schedules and reduce reliance on site labor. IJM Construction said its RM1.4 billion Johor Bahru data centre would use precast columns, beams and hollow-core slabs, with completion scheduled within 13 months for about 62,000 square meters of floor area. The Works Ministry's Modular Construction Roadmap 2026-2030 targets 20% to 30% adoption of industrialized building systems, modular construction and BIM by 2030, Bernama reported in November 2026. The ministry tied the roadmap to school building under the 13th Malaysia Plan. Makers of precast concrete components and contractors with casting yards stand to gain.
Green ratings shift from option to project requirement
Building owners are moving from voluntary green labels toward ratings that tenants and lenders expect, which changes design, materials and commissioning work. The construction industry's CAP30 program targets green ratings for half of building projects valued above RM40 million by 2030, Business Times reported in August 2026. The same program targets an 80% achievement score on quality and on safety and health assessments. The IJM data centre in Johor Bahru targets LEED Gold and GreenRE Platinum certification, showing that hyperscale tenants now specify ratings at tender. MIDA said 671 projects covering about 300 million square feet had been certified under the Green Building Index by December 2023. Contractors with energy modeling and green material supply chains will win more rated projects.
Data hall fit-out packages open large MEP contracts
The mechanical, electrical and plumbing packages inside data halls can be worth more than the building shell, creating a separate contract stream. Sunway Construction won a RM1.02 billion MEP contract in August 2026 for a Johor data centre where it had already built the core and shell, The Star reported. IJM Construction received a RM873.9 million M&E fit-out contract for an Elmina hyperscale data centre in October 2025. Gamuda's May 2024 award for an Elmina hyperscale data centre paired RM815 million of construction work with RM928.6 million of MEP works. About 90% of Sunway Construction's RM13.5 billion tender book was data centre work, The Star reported in August 2026. Contractors with electrical engineering teams and links with colocation operators can capture these packages.
Repairs and conversions open work in older buildings
Aging public housing and underused commercial space create a growing market for repair, refurbishment and conversion contracts. Budget 2026 allocated RM500 million to repair or rebuild more than 3,300 dilapidated homes, including 380 fishermen's houses. It also introduced a special tax deduction of 10% of eligible costs for converting commercial buildings into homes, capped at RM10 million. The budget set aside RM95 million to repair and upgrade public toilets and parks across local authorities. Small and mid-sized contractors that can work inside occupied buildings, with residents or tenants still in place, benefit most, which is why renovation outpaces new construction.
Labor limits, unsold homes and new service tax raise risk
Foreign labor limits slow site productivity
Building sites depend on foreign workers, and policy now aims to reduce that reliance. Malaysia had 589,684 foreign workers in construction on Oct. 15, 2025, while the national foreign workforce fell 13% in a year, The Sun reported, citing official data. Approvals for new foreign worker quotas have been frozen since March 2023, and a multi-tier levy was set to start in 2026. Labor-intensive housing contractors are most exposed, which pushes them toward precast systems.
Unsold homes restrain new residential launches
Unsold completed homes make developers cautious about launching new phases, which reduces housing contracts. The National Property Information Centre counted 23,515 unsold completed homes in the first quarter of 2025, EdgeProp reported. Condominiums priced between RM300,001 and RM400,000 formed the largest group, at 2,715 units. Johor and Kuala Lumpur carried large stocks, so contractors that rely on condominium developers in these areas face thinner order books until absorption improves.
New service tax lifts non-residential project costs
The extension of service tax to construction services raises the cost of commercial and industrial buildings. KPMG said a 6% service tax on construction services took effect on July 1, 2025, with residential buildings excluded. Developers of offices, retail centers and factories must budget for the charge, and contractors face tighter tender pricing. Mid-sized commercial projects with thin margins are most exposed, while large data centre owners can absorb the cost more easily.
Data centre concentration exposes contractor order books
Heavy reliance on data centre awards leaves contractors exposed if hyperscale demand slows. The tender-book concentration at Sunway Construction and Johor's share of contracted data centre power, both noted above, show how narrow the demand base has become. Growth in total construction work also eased to 8.8% in the second quarter of 2026, so contractors with narrow client bases face the largest swings.
Selangor-led zone holds the base while Johor grows fastest
| Region | Value, 2025 (USD million) | Share, 2025 | CAGR, 2026–2035 |
|---|---|---|---|
| Central Region | 8,300.6 | 38.5% | 6.8% |
| Southern Region | 5,821.2 | 27.0% | 8.3% |
| Northern Region | 3,018.4 | 14.0% | 7.5% |
| East Malaysia | 3,018.4 | 14.0% | 6.9% |
| East Coast Region | 1,401.4 | 6.5% | 6.7% |
The Central Region keeps the largest share of building work
The Central Region held 38.5% of 2025 building work and grows at 6.8% a year. Selangor recorded RM11.0 billion of construction work in the fourth quarter of 2025, or 23.8% of the national total, and Kuala Lumpur, Putrajaya and Labuan together added RM4.8 billion. WCT won a RM600.89 million contract in August 2026 for a 41-storey office tower at TRX in Kuala Lumpur. Office and high-rise projects keep the zone ahead, although unsold condominiums slow residential work.
The Southern Region grows fastest on data halls
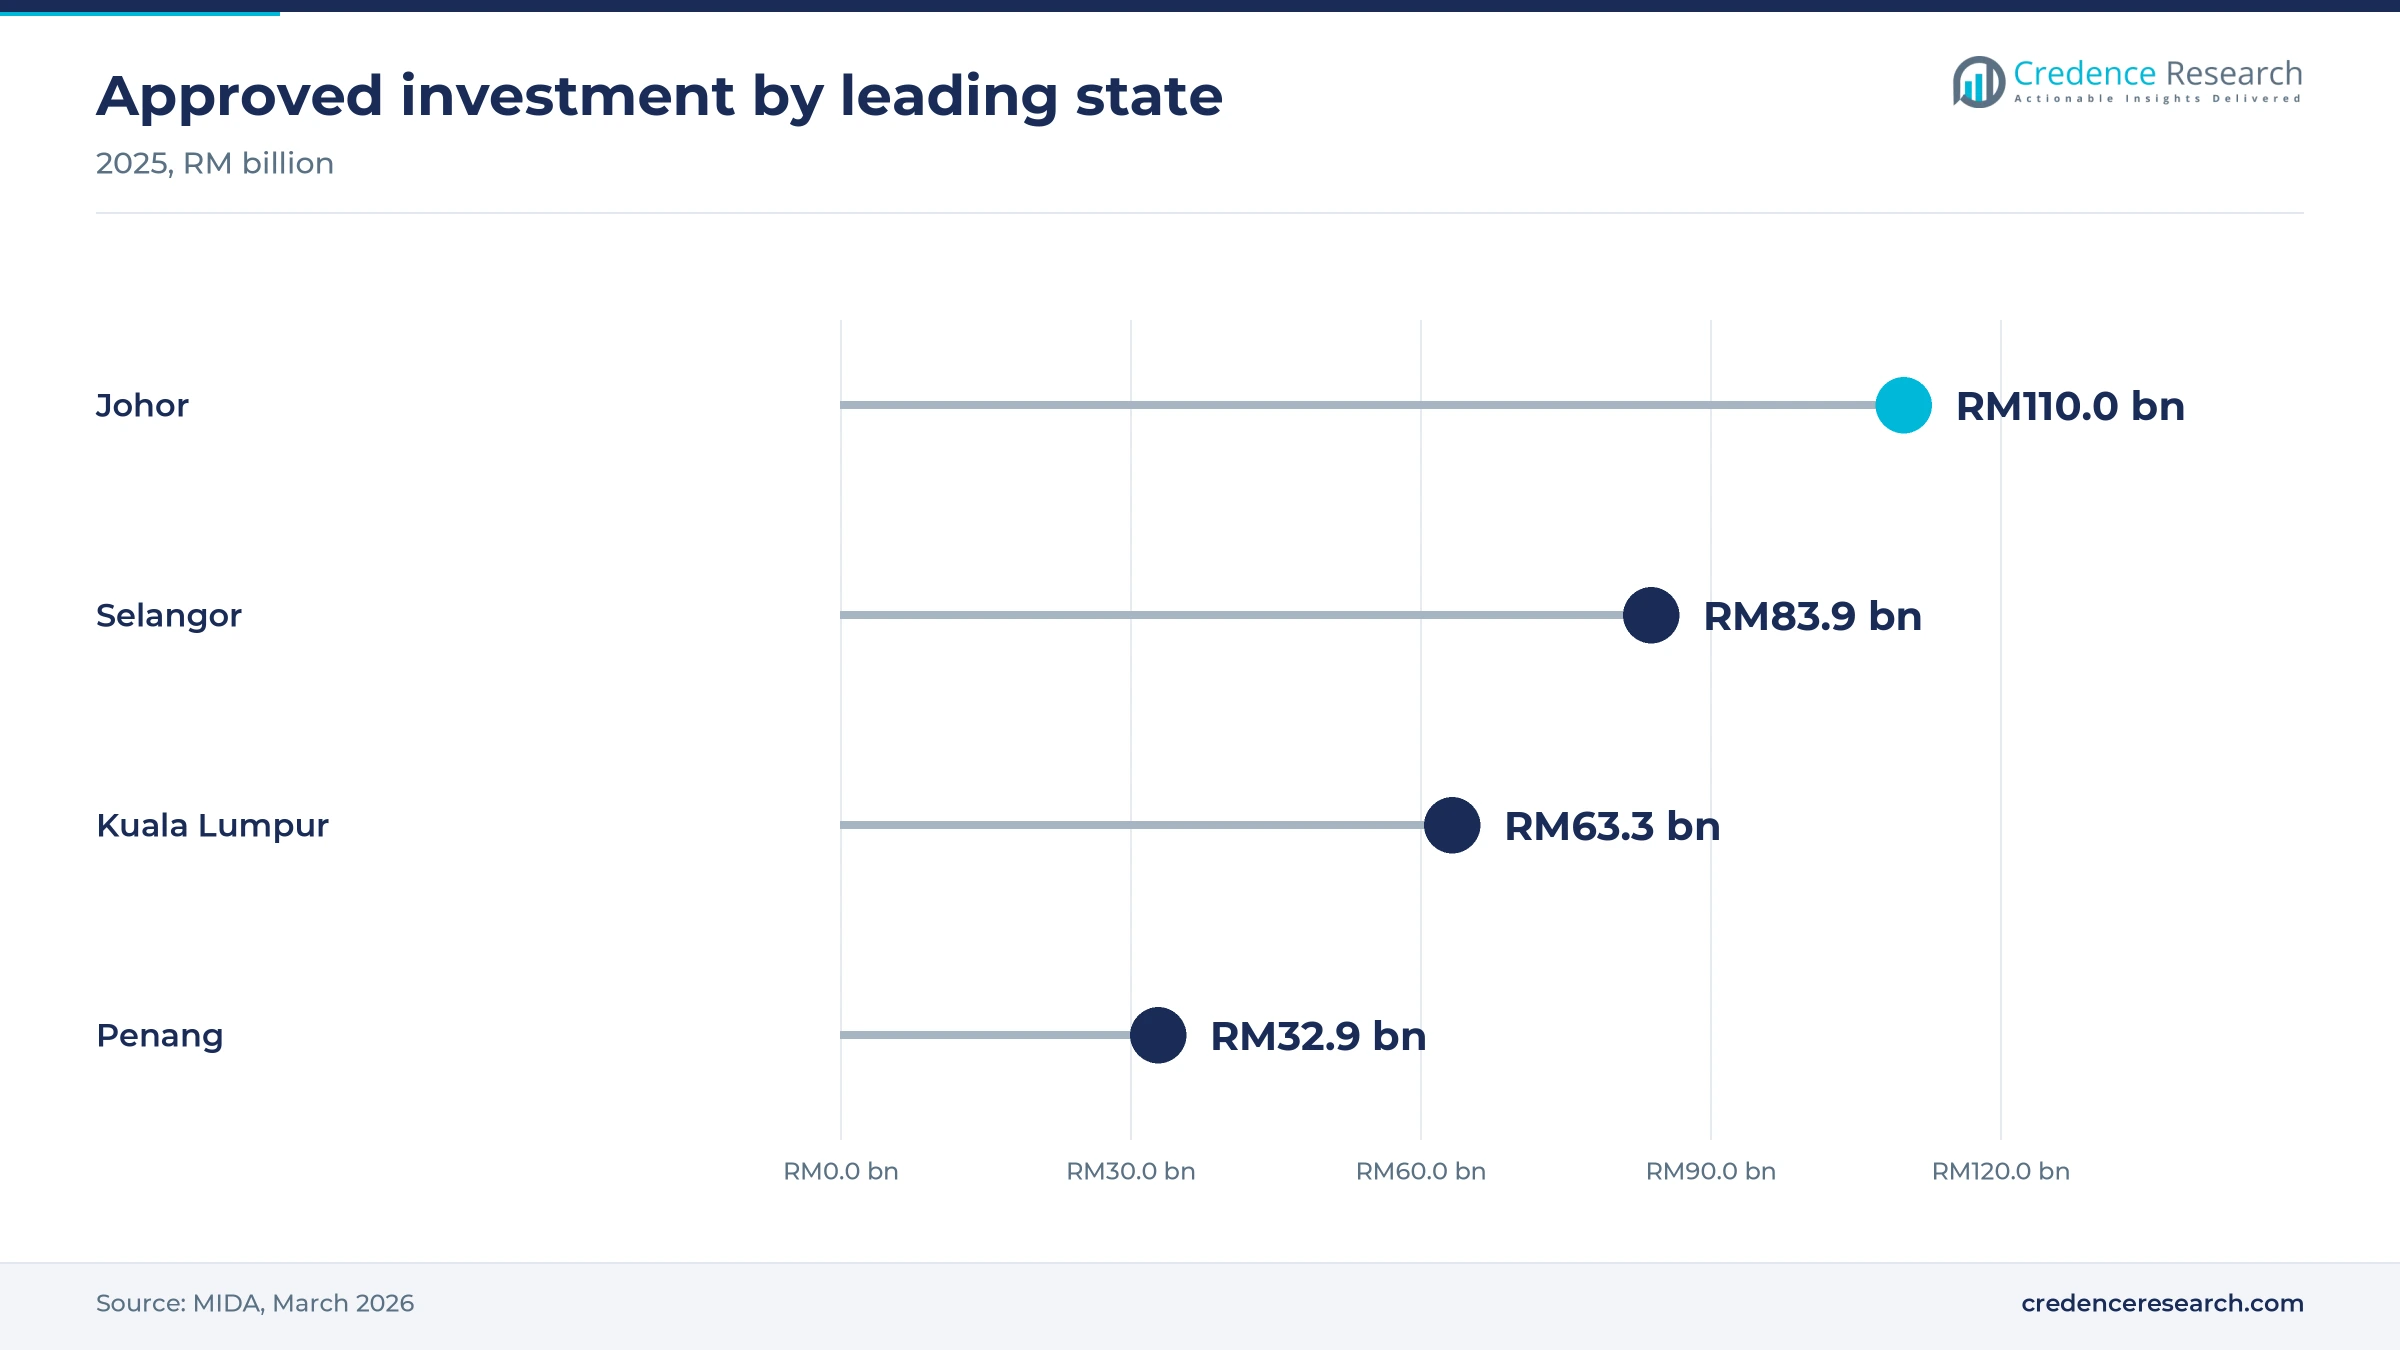
The Southern Region held 27.0% of 2025 building work and grows fastest at 8.3% a year. Johor's share of national construction work rose to 19.6% in the second quarter of 2026, and the state attracted RM110.0 billion of approved investment in 2025. Gamuda won two build-only data centre contracts in Port Dickson, Negeri Sembilan, worth RM3.57 billion in August 2026. Hyperscale campuses and industrial parks near Singapore keep the zone ahead, though housing absorption in Johor is slow.
The Northern Region builds plants and high-rise homes
The Northern Region held 14.0% of 2025 building work and grows at 7.5% a year. Penang's manufacturing approvals, noted above, feed factory work in Batu Kawan and Kulim. Kerjaya Prospek won a RM350.62 million contract in November 2025 for two serviced apartment towers with 1,406 units in Batu Kawan, starting in March 2026. Budget 2026 also funds new clinics in Kubang Semang in Penang and Sik in Kedah. Factory demand keeps the zone growing faster than the national average.
East Malaysia relies on public buildings and state funds
East Malaysia held 14.0% of 2025 building work and grows at 6.9% a year. Sarawak recorded RM5.0 billion of construction work in the fourth quarter of 2025, or 10.8% of the national total, although much of it was civil engineering. The record federal allocations for Sabah and Sarawak, described in the drivers, fund schools, clinics and quarters, including a new clinic in Mukah. Local contractors such as Hock Seng Lee benefit, while private building demand remains thinner than in the peninsula.
The East Coast Region depends on public housing
The East Coast Region held 6.5% of 2025 building work and grows at 6.7% a year, the slowest of the five zones. Budget 2026 allocated RM500 million for armed forces family housing at Kuantan Air Base, which will house about 800 military personnel. The Ayer Lanas people's housing project in Jeli, Kelantan, is also among the public housing projects named in the budget. Public housing anchors work here, while private factory and office demand remains limited.
Stadium, tower and data hall awards fix the 2026-28 pipeline
| Development | Status and market relevance |
|---|---|
| In May 2025, MRCB received a letter of acceptance from the Selangor state government to build the RM2.94 billion Shah Alam sports complex. | Letter of acceptance; completion due within 36 months of the construction start. |
| In August 2025, IJM Construction won a RM1.4 billion fast-track contract for a six-storey data centre in Johor Bahru. | Contract award; completion was scheduled for September 2026 and has not been confirmed publicly. |
| In December 2025, Kerjaya Prospek won a RM225 million lump-sum contract for a 50-storey serviced apartment and commercial tower in Johor Bahru. | Contract award; works start in January 2026 and run 38 months. |
| In August 2026, Sunway Construction won a RM1.02 billion MEP contract for a data centre in Johor from a U.S. technology company. | Contract award; completion expected by the fourth quarter of 2027. |
| In August 2026, Gamuda won two build-only contracts worth RM3.57 billion for hyperscale data centres in Port Dickson. | Contract award; construction starts in the fourth quarter of 2026 for completion in 2028. |
BIM rules and precast systems change how sites are run
- Building Information Modeling has been required for projects worth RM10 million and above since August 2024, the Works Ministry said, which raises demand for BIM software and trained modelers.
- Hollow-core precast slabs shorten floor cycles on data halls and car parks, because slabs arrive cured and need little formwork on site.
- Design and management safety rules introduced in 2024 shift more safety duties to clients, designers and contractors at the planning stage of each project.
- Green rating tools such as the Green Building Index and GreenRE set measurable targets for energy, water and materials, which contractors must document at handover.
Need a Custom Version of This Report?
Tailor the scope, geography, or segments to your exact requirements.
- Custom geography or segment scope
- Direct access to our analyst team
Listed contractors compete on data hall and high-rise record
Competition in the Malaysia building construction market turns on data hall experience, high-rise delivery record and balance sheet strength. Gamuda and Sunway Construction lead in hyperscale data halls, with repeated core-and-shell and MEP awards in Johor, Selangor and Negeri Sembilan. IJM Construction combines precast systems with fast-track schedules, shown by its Johor Bahru data centre. WCT competes for office towers in Kuala Lumpur, and MRCB holds large institutional work such as the Shah Alam sports complex. Kerjaya Prospek specializes in high-rise residential and mixed-use towers for developers. Binastra has moved into data halls, winning a RM491.2 million contract in July 2026 for a seven-storey data centre in Cheras. Hock Seng Lee draws most of its work from Sarawak government projects. Sunway Construction's outstanding order book reached RM10.4 billion in August 2026, The Star reported, which lets it bid selectively for new halls.
How is the supply side organized and where do margins sit?
The supply side in this market is organized in three layers of firms. Listed main contractors such as Gamuda, IJM, Sunway Construction, WCT and MRCB win large data hall, office and stadium contracts and hold the balance sheets needed for performance bonds. Mid-sized listed builders such as Kerjaya Prospek and Hock Seng Lee focus on high-rise housing or state government work in one region. Thousands of smaller registered contractors handle landed homes, repairs and subcontract packages. Margins are highest on fast-track data halls and repeat work for related developers, while small housing builders compete mainly on price.
Companies profiled and their roles in this market
| Company | Type | Role in the market |
|---|---|---|
| Gamuda Berhad | Main contractor | Builds hyperscale data centres in Selangor and Negeri Sembilan for global cloud clients |
| IJM Corporation Berhad | Main contractor | Data centre shells, M&E fit-out and precast building systems |
| Sunway Construction Group Berhad | Main contractor and MEP specialist | Core-and-shell and MEP packages for Johor data centres |
| WCT Holdings Berhad | Main contractor | Office towers and commercial buildings, including a TRX tower |
| Malaysian Resources Corporation Berhad (MRCB) | Main contractor and developer | Institutional buildings such as the Shah Alam sports complex |
| Kerjaya Prospek Group Berhad | Building contractor | High-rise serviced apartments and mixed-use towers in Johor, Penang and Selangor |
| Binastra Corporation Berhad | Building contractor | Data centre and high-rise building works in the Klang Valley |
| Hock Seng Lee Berhad (HSL) | Regional contractor | Government buildings and infrastructure in Sarawak |
Order books tilt toward data halls, raising concentration
Credence Research's view is that data hall awards will keep building work growing faster than the economy until about 2028, but buyers and investors should treat that growth as concentrated. Johor, Negeri Sembilan and Selangor will take most non-residential value, while housing grows more slowly until unsold stock falls. Contractors with MEP teams, precast capacity and steady public work will hold margins best. Developers should lock in steel and cement prices early, and owners of offices and factories should budget for the service tax on non-residential construction services.
Estimates rebuilt from official work-done statistics
The report uses 2025 as the base year and forecasts Malaysia building construction work done for 2026 to 2035. Market values come from the Credence Research model, which converts official quarterly statistics for residential and non-residential building work into U.S. dollars and projects them with investment, housing and budget data. This edition replaces an earlier estimate with a 2023 base year. Segment and regional splits are Credence Research estimates built from the same official and company data. Sources include the Department of Statistics Malaysia, MIDA, budget documents, company filings and news reports, and no interviews or surveys were conducted.
Work done should roughly double as the mix shifts south
Building work in Malaysia should rise from USD 23.15 billion in 2026 to USD 43.86 billion by 2035, as data halls, factories, public quarters and mid-priced homes reach construction. Non-residential projects will keep the larger share, while repairs and conversions of older buildings grow from a small base. The Southern Region should gain share as Johor and Negeri Sembilan host more hyperscale campuses, and the Central Region will remain the largest zone. Labor limits, unsold homes and a possible slowdown in data centre awards after 2028 are the main risks to this outlook.
How wide is the range of outcomes to 2035?
The outcome depends mainly on how long the data centre wave lasts and whether housing absorption improves. The OECD expects economic growth of 4.9% in 2026 and 5.0% in 2027, a pace consistent with the base case. A sharp pause in hyperscale awards after 2028, combined with persistent unsold homes, would push spending toward the downside. Faster factory investment from approved projects and stronger public housing delivery would lift growth toward the upside case.
| Scenario | CAGR, 2026–2035 | Value, 2035 | What has to hold |
|---|---|---|---|
| Downside | 5.4% | USD 37.03 billion | Hyperscale awards pause after 2028 and unsold homes hold back residential launches |
| Base | 7.36% | USD 43.86 billion | Data hall, factory and public housing pipelines are delivered close to announced dates |
| Upside | 8.7% | USD 48.88 billion | Approved manufacturing projects reach site quickly and public housing delivery speeds up |
Frequently Asked Questions
How big is the Malaysia building construction market?
How large is the construction sector in Malaysia overall?
Which companies lead building construction in Malaysia?
What share of building work is non-residential?
How much do key building materials cost in Malaysia?
Which region of Malaysia leads building construction?
How are data centres changing construction in Malaysia?
Is green building and renovation work growing in Malaysia?
Table of Content
Chapter 1 Market Segmentation
- 1.1 Segmentation Framework
- 1.1.1 Product and Service Classification
- 1.1.2 Application and End-Use Classification
- 1.1.3 Technology and Solution Classification
- 1.1.4 Customer and Distribution Channel Classification
- 1.1.5 Geographic Segmentation
- 1.1.6 Market Segment Definitions and Boundaries
- 1.2 By Type
- 1.2.1 Residential
- 1.2.2 Non-residential
- 1.3 By Construction Type
- 1.3.1 New Construction
- 1.3.2 Renovation
- 1.4 By End User
- 1.4.1 Private
- 1.4.2 Public
Chapter 2 Introduction
- 2.1 Report Objectives and Scope
- 2.2 Product Definition and Industry Terminology
- 2.3 Market Inclusions and Exclusions
- 2.4 Research Process
- 2.4.1 Primary Research and Expert Interviews
- 2.4.2 Secondary Research and Source Review
- 2.4.3 Top-Down and Bottom-Up Estimation
- 2.4.4 Data Triangulation and Verification
- 2.5 Market Size Measurement Basis
- 2.5.1 2025: USD 21.56 billion → 2035: USD 43.86 billion
- 2.6 Historical and Forecast Reference Periods
- 2.6.1 Historical Period: 2018-2025
- 2.6.2 Base Year: 2025
- 2.6.3 Forecast Period: 2025-2035
- 2.7 Research Assumptions and Limitations
Chapter 3 Executive Summary
- 3.1 Market Snapshot and Key Findings
- 3.2 Base-Year Market Size, 2025
- 3.3 Forecast Market Size, 2035
- 3.4 Revenue and Volume Growth Outlook
- 3.5 Key Demand and Supply Indicators
- 3.6 Leading Market Segments
- 3.7 Fastest-Growing Market Opportunities
- 3.8 Regional Performance Highlights
- 3.9 Technology and Industry Transformation
- 3.10 Competitive Landscape Summary
- 3.11 Analyst View and Strategic Implications
Chapter 4 Malaysia Building Construction Market Trends and Developments
- 4.1 Historical Industry Development, 2018-2025
- 4.2 Recent Market Trends and Developments
- 4.3 Demand and Customer Behavior Trends
- 4.4 Technology and Product Innovation
- 4.5 Artificial Intelligence, Automation and Digitalization
- 4.6 Local Manufacturing and Supply Chain Realignment
- 4.7 Industry Partnerships, Mergers and Acquisitions
- 4.8 Sustainability and Circular Economy Developments
- 4.9 Government and Private Sector Investment Trends
- 4.10 Emerging Business Models and Commercialization
- 4.11 Industry Developments and Announcements
Chapter 5 Malaysia Building Construction Market Production, Supply and Demand Analysis
- 5.1 Demand Trend and Consumption Analysis, 2018-2025
- 5.2 Demand Forecast, 2025-2035
- 5.3 Production and Output Trend, 2018-2025
- 5.4 Production and Output Forecast, 2025-2035
- 5.5 Installed Capacity and Capacity Utilization
- 5.6 Company-Wise Production Plants and Statistics
- 5.6.1 Installed Production Capacity
- 5.6.2 Actual Production
- 5.6.3 Planned Capacity and Expansion Targets
- 5.7 Supply Chain Structure and Procurement Trends
- 5.8 Supply-Demand Gap and Bottlenecks
- 5.9 Import Dependence and Sourcing Structure
- 5.10 Contract Manufacturing and Outsourcing
- 5.11 Regional Supply and Demand Concentration
Chapter 6 Malaysia Building Construction Market Pricing Analysis
- 6.1 Pricing Structure and Measurement
- 6.2 Historical Pricing Trends, 2018-2025
- 6.3 Pricing Outlook, 2025-2035
- 6.4 Average Selling Price and Unit Economics
- 6.5 Pricing by Product and Market Segment
- 6.6 Geographic Pricing Differences
- 6.7 Key Input, Energy, Labor and Logistics Costs
- 6.8 Contract Pricing and Purchasing Models
- 6.9 Pricing Sensitivity and Competitive Positioning
- 6.10 Price, Margin and Profitability Implications
Chapter 7 Malaysia Building Construction Market Dynamics
- 7.1 Market Growth Drivers
- 7.1.1 Demand-Side Drivers
- 7.1.2 Technology and Innovation Drivers
- 7.1.3 Infrastructure and Investment Drivers
- 7.1.4 Regulatory and Policy Drivers
- 7.2 Market Restraints
- 7.2.1 Cost and Affordability Constraints
- 7.2.2 Technology and Adoption Barriers
- 7.2.3 Supply Chain and Operational Constraints
- 7.3 Market Challenges
- 7.3.1 Competitive Pressure and Margin Erosion
- 7.3.2 Skills, Infrastructure and Implementation Gaps
- 7.4 Emerging Market Opportunities
- 7.5 Market Dynamics Impact and Time-Horizon Assessment
Chapter 8 Malaysia Building Construction Value Chain Analysis
- 8.1 Industry Value Chain Overview
- 8.2 Upstream Suppliers and Critical Inputs
- 8.3 Technology and Component Providers
- 8.4 Manufacturing or Service Delivery
- 8.5 Distribution, Channel Partners and Integrators
- 8.6 Downstream Applications and End Users
- 8.7 Value Addition and Profit Pools
- 8.8 Vertical Integration and Outsourcing
- 8.9 Supplier Concentration and Risk
- 8.10 Supply Chain Localization and Resilience
Chapter 9 Malaysia Building Construction Market Regulations and Policies
- 9.1 Relevant Laws, Standards and Compliance Frameworks
- 9.2 Product, Service, Safety and Quality Requirements
- 9.3 Government Policies, Incentives and Subsidies
- 9.4 Imports, Exports and Trade Barriers
- 9.5 Public Procurement and Local Content Requirements
- 9.6 Environmental and Sustainability Compliance
- 9.7 Upcoming Policy Changes and Market Implications
Chapter 10 Malaysia Building Construction Market Hotspots and Opportunities
- 10.1 Market Opportunity Mapping and Growth Hotspots
- 10.2 High-Growth Applications and Customer Groups
- 10.3 Underserved Markets and White-Space Opportunities
- 10.4 Emerging Technology and Product Opportunities
- 10.5 New Capacity and Investment Hotspots
- 10.6 Market Entry and Expansion Opportunities
- 10.7 Distribution and Partnership Opportunities
- 10.8 Near-Term and Long-Term Commercial Potential
- 10.9 Opportunity Attractiveness and Execution Risks
Chapter 11 Malaysia Building Construction Market Outlook, 2025-2035
- 11.1 Market Size and Analysis
- 11.1.1 Revenue (Market Measurement: 2025: USD 21.56 billion → 2035: USD 43.86 billion)
- 11.1.2 Market Volume and Quantity Sold
- 11.1.3 Historical Market Size, 2018-2025
- 11.1.4 Base-Year Market Size, 2025
- 11.2 Market Forecast, 2025-2035
- 11.2.1 Revenue Forecast to 2035
- 11.2.2 Volume Forecast to 2035
- 11.2.3 CAGR and Year-on-Year Growth
- 11.2.4 Incremental Revenue Opportunity
- 11.3 Forecast Assumptions and Scenario Analysis
- 11.3.1 Base-Case Forecast
- 11.3.2 Optimistic and Conservative Scenarios
- 11.3.3 Technology, Pricing and Policy Sensitivities
- 11.4 Market Attractiveness and Growth Outlook
Chapter 12 Malaysia Building Construction Market Segmentation and Outlook
- 12.1 Segmentation Summary and Market Shares, 2025
- 12.2 Largest and Fastest-Growing Segments
- 12.3 By Type - Market Size and Forecast, 2025-2035
- 12.3.1 Segment Definition and Scope
- 12.3.2 Historical Market Size, 2018-2025
- 12.3.3 Revenue Forecast, 2025-2035
- 12.3.4 Volume Forecast, 2025-2035
- 12.3.5 Base-Year Market Share, 2025
- 12.3.6 Segment CAGR and Growth Drivers
- 12.3.7 Subsegment Market Size and Forecast
- 12.3.7.1 Residential
- 12.3.7.2 Non-residential
- 12.3.8 Subsegment Pricing and Adoption Trends
- 12.3.9 Leading Suppliers and Competition
- 12.3.10 Regional Demand and Opportunities
- 12.4 By Construction Type - Market Size and Forecast, 2025-2035
- 12.4.1 Segment Definition and Scope
- 12.4.2 Historical Market Size, 2018-2025
- 12.4.3 Revenue Forecast, 2025-2035
- 12.4.4 Volume Forecast, 2025-2035
- 12.4.5 Base-Year Market Share, 2025
- 12.4.6 Segment CAGR and Growth Drivers
- 12.4.7 Subsegment Market Size and Forecast
- 12.4.7.1 New Construction
- 12.4.7.2 Renovation
- 12.4.8 Subsegment Pricing and Adoption Trends
- 12.4.9 Leading Suppliers and Competition
- 12.4.10 Regional Demand and Opportunities
- 12.5 By End User - Market Size and Forecast, 2025-2035
- 12.5.1 Segment Definition and Scope
- 12.5.2 Historical Market Size, 2018-2025
- 12.5.3 Revenue Forecast, 2025-2035
- 12.5.4 Volume Forecast, 2025-2035
- 12.5.5 Base-Year Market Share, 2025
- 12.5.6 Segment CAGR and Growth Drivers
- 12.5.7 Subsegment Market Size and Forecast
- 12.5.7.1 Private
- 12.5.7.2 Public
- 12.5.8 Subsegment Pricing and Adoption Trends
- 12.5.9 Leading Suppliers and Competition
- 12.5.10 Regional Demand and Opportunities
- 12.6 Segment Growth Comparison
- 12.7 Segment Attractiveness and Priority Matrix
Chapter 13 Malaysia Building Construction End-Use and Application Market Outlook
- 13.1 End-Use Industry and Customer Demand Structure
- 13.2 Leading Applications and Customer Groups
- 13.3 End-Use Market Size, Share and Forecast
- 13.4 Major End-Use Industry Deep Dives
- 13.4.1 Customer Requirements and Use Cases
- 13.4.2 Demand and Replacement Cycles
- 13.4.3 Technical and Regulatory Considerations
- 13.4.4 Purchasing and Procurement Models
- 13.4.5 Leading Vendors and Distribution Channels
- 13.4.6 Forecast and Commercial Opportunities
- 13.5 Emerging Applications and Cross-Segment Demand
- 13.6 End-Use Industry Investment Priorities
Chapter 14 Malaysia Building Construction Geographic Market Outlook, 2025-2035
- 14.1 Domestic Market Distribution and Demand Clusters
- 14.2 State- or Province-Wise Market Size and Forecast, 2025-2035
- 14.3 City and Metropolitan Market Outlook
- 14.4 Industrial, Manufacturing and Commercial Clusters
- 14.5 Geographic Concentration of Key End Users
- 14.6 Local Pricing and Purchasing Differences
- 14.7 Domestic Production Facilities and Capacity Map
- 14.8 Local Infrastructure and Project Pipeline
- 14.9 State-Level Policy and Incentive Differences
- 14.10 Subnational Investment Hotspots and Opportunities
- 14.11 Distribution and Logistics Networks
- 14.12 Domestic Competitive Footprint
Chapter 15 Malaysia Building Construction Technology, Innovation and Sustainability Outlook
- 15.1 Technology Landscape and Maturity
- 15.2 Product, Process and Service Innovation
- 15.3 AI, Automation and Digital Tools in the Industry
- 15.4 Technology Adoption and Performance Benchmarking
- 15.5 Innovation Pipeline and R&D Investment
- 15.6 Patent and Intellectual Property Trends
- 15.7 Energy Efficiency and Resource Management
- 15.8 Sustainability, Recycling and Circularity
- 15.9 Technology Roadmap, 2025-2035
- 15.10 Risks of Obsolescence and Technology Substitution
Chapter 16 Malaysia Building Construction Market Key Strategic Imperatives
- 16.1 Growth and Market Entry Priorities
- 16.2 High-Return Products and Segments
- 16.3 Pricing, Profitability and Cost Optimization
- 16.4 Technology Investment and Product Differentiation
- 16.5 Supply Chain Localization and Resilience
- 16.6 Distribution and Customer Acquisition
- 16.7 Partnership, Acquisition and Capacity Strategy
- 16.8 Regional Expansion Priorities
- 16.9 Short-, Medium- and Long-Term Actions
Chapter 17 Competition Outlook
- 17.1 Industry Competition Characteristics
- 17.2 Market Structure and Concentration
- 17.3 Market Share and Competitive Positioning, 2025
- 17.4 Company-Wise Revenue and Product Benchmarking
- 17.5 Production and Service Capacity Benchmarking
- 17.6 Technology, Pricing and Differentiation
- 17.7 Regional Footprint and Distribution Strength
- 17.8 Mergers, Acquisitions and Strategic Alliances
- 17.9 New Entrants and Competitive Threats
- 17.10 Porter's Five Forces and Industry Attractiveness
- 17.11 Competitive Outlook, 2025-2035
Chapter 18 Company Profiles
- 18.1 Company Coverage and Selection Criteria
- 18.2 Gamuda Berhad
- 18.2.1 Business Description
- 18.2.2 Company Ownership and Geographic Presence
- 18.2.3 Product and Service Portfolio
- 18.2.4 Manufacturing and Operating Footprint
- 18.2.5 Production Capacity and Expansion Plans
- 18.2.6 Financial Performance and Investment
- 18.2.7 Market Share and Competitive Position
- 18.2.8 Technology and Innovation Capabilities
- 18.2.9 Strategic Alliances or Partnerships
- 18.2.10 Recent Developments
- 18.2.11 Growth Strategy and Outlook
- 18.3 IJM Corporation Berhad
- 18.4 Sunway Construction Group Berhad
- 18.5 WCT Holdings Berhad
- 18.6 Malaysian Resources Corporation Berhad (MRCB)
- 18.7 Kerjaya Prospek Group Berhad
- 18.8 Binastra Corporation Berhad
- 18.9 Hock Seng Lee Berhad (HSL)
- 18.10 Other Relevant Market Participants
Note: Every listed company is profiled on the structure shown under the first company. The company list is preliminary and may change based on research findings, market developments, data availability and client requirements.
Chapter 19 Disclaimer
- 19.1 Research and Forecast Disclaimer
- 19.2 Data Source and Estimation Limitations
Note: The depth of individual sections depends on data availability for this market. Volume, capacity, trade and other unit-based metrics are included where applicable.

