Market Overview
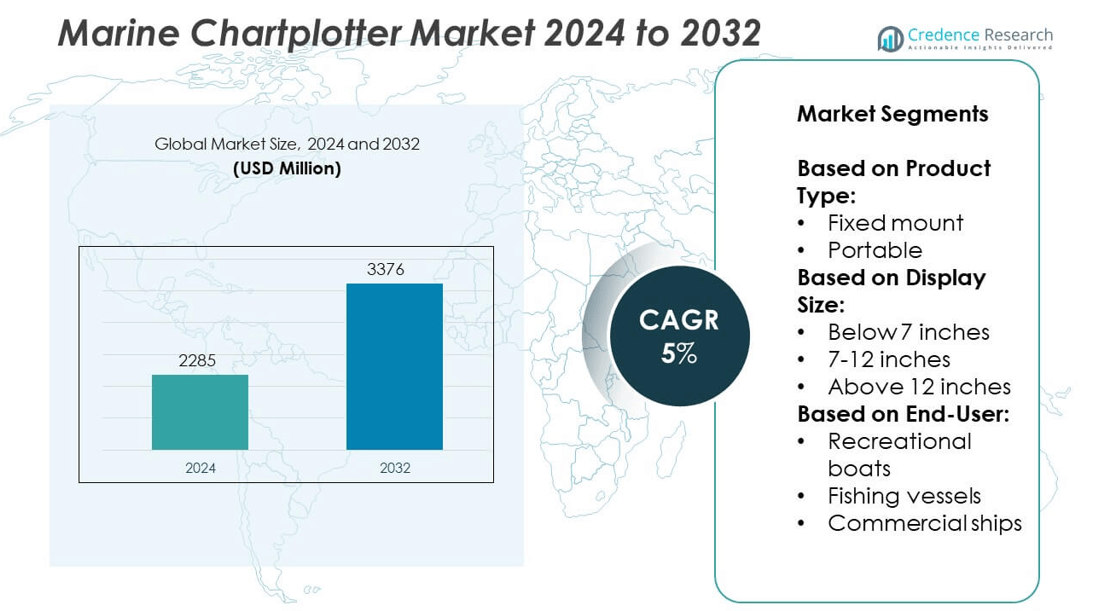
Marine Chartplotter Market size was valued at USD 2285 million in 2024 and is anticipated to reach USD 3376 million by 2032, at a CAGR of 5% during the forecast period.
| REPORT ATTRIBUTE |
DETAILS |
| Historical Period |
2020-2023 |
| Base Year |
2024 |
| Forecast Period |
2025-2032 |
| Marine Chartplotter Market Size 2024 |
USD 2285 million |
| Marine Chartplotter Market, CAGR |
5% |
| Marine Chartplotter Market Size 2032 |
USD 3376 million |
The Marine Chartplotter market grows through rising demand for advanced navigation systems that enhance maritime safety, route accuracy, and operational efficiency across commercial and recreational vessels. Regulatory mandates for electronic chart systems and the expansion of smart marine infrastructure support adoption. Key trends include the shift toward multifunction displays, mobile integration, and real-time data connectivity. Users increasingly prefer touchscreen interfaces, cloud-based updates, and compact solutions that support digital ecosystem integration.
North America leads the Marine Chartplotter market due to strong adoption in commercial shipping, recreational boating, and regulatory compliance across U.S. and Canadian waters. Europe follows with significant demand driven by sustainability initiatives and technological innovation in maritime electronics. Asia-Pacific shows fast growth, supported by large-scale urban coastal development, expanding fisheries, and increasing vessel digitization across China, Japan, and South Korea. Latin America and the Middle East & Africa present emerging opportunities through fleet modernization and government-led marine safety programs. Prominent players shaping the market include Garmin.
Market Insights
- The Marine Chartplotter market was valued at USD 2,285 million in 2024 and is projected to reach USD 3,376 million by 2032, growing at a CAGR of 5% during the forecast period.
- Growth is driven by increasing demand for real-time navigation systems across commercial, fishing, and recreational vessels to improve safety, efficiency, and route precision.
- Key trends include rising adoption of touchscreen multifunction displays, GNSS-enabled positioning, mobile device integration, and cloud-based software updates.
- Major players such as Garmin, Furuno, Navico (Simrad, B&G, Lowrance), and Raymarine focus on innovation, offering scalable systems with sonar, radar, and AIS integration to meet the needs of varying vessel types.
- High product cost, integration challenges with legacy systems, and inconsistent satellite coverage in remote maritime zones restrict wider adoption, especially in smaller or older vessels.
- North America and Europe dominate the market due to established marine infrastructure and strong regulatory frameworks, while Asia-Pacific sees rapid growth from expanding coastal development and fleet upgrades.
- Manufacturers benefit from demand across public safety fleets, fishing vessels, and smart marine ecosystems, creating opportunities through government procurement, marine digitization, and sustainable navigation systems.
Access crucial information at unmatched prices!
Request your sample report today & start making informed decisions powered by Credence Research Inc.!
Download Sample
Market Drivers
Rising Demand for Advanced Navigation Systems to Enhance Maritime Safety and Operational Efficiency
The Marine Chartplotter market benefits from growing emphasis on navigational safety and operational efficiency in commercial and recreational vessels. Maritime operators increasingly invest in advanced digital solutions to reduce human error and enhance route planning accuracy. Chartplotters integrate GPS data with electronic navigational charts, enabling real-time positioning and hazard avoidance. This functionality supports compliance with evolving international safety regulations and promotes automated decision-making in high-traffic or low-visibility zones. Demand intensifies from shipping companies modernizing aging fleets with digital tools. The Marine Chartplotter market responds with systems offering higher resolution, faster processors, and compatibility with other onboard sensors.
- For instance, Furuno’s NavNet TZtouch3 system integrates a 1kW dual-channel TruEcho CHIRP sonar and TimeZero chart engine, supporting real-time data overlay on high-speed quad-core processors.
Expansion of Recreational Boating and Yachting Activities Among High-Income Consumer Segments
Rising disposable income and increased participation in leisure boating strengthen the demand for user-friendly and compact marine navigation tools. Recreational boaters seek reliable systems to support coastal and offshore voyages without depending entirely on manual navigation skills. Chartplotters tailored for personal use combine touchscreen functionality with mobile app integration and wireless updates. These features attract hobbyists, sport fishers, and yacht owners, driving aftermarket sales. The Marine Chartplotter market adapts by offering entry-level to premium models catering to varying vessel sizes and navigation needs. It also gains traction through growing awareness of digital charting convenience over traditional methods.
- For instance, Simrad’s P3007 system is IMO-approved and features a 7-inch ECDIS display with Type-S charting capability, supporting compliance for over 12,000 commercial vessels globally.
Regulatory Pressure for Electronic Chart Systems on Commercial Vessels
International mandates and regional policies encourage widespread adoption of electronic chart display systems on cargo ships, tankers, and passenger vessels. Authorities such as the IMO and regional coast guards reinforce compliance by updating minimum equipment standards for navigation. This drives commercial fleet operators to install certified chartplotters with real-time data connectivity and AIS integration. It supports incident prevention and enhances situational awareness on long voyages through congested routes. The Marine Chartplotter market sees sustained demand from fleet modernization programs and newbuild projects across shipping nations. Regulatory push ensures consistent replacement cycles and long-term market stability.
Integration of Marine Electronics into Unified Digital Platforms Across Vessel Systems
The convergence of marine electronics into centralized digital platforms stimulates demand for integrated navigation systems. Vessel owners favor multifunction displays that unify radar, sonar, autopilot, and chartplotter functions into a single interface. This trend supports ease of operation, reduced hardware footprint, and simplified training for operators. Chartplotters serve as the core interface, linking with cloud services, remote monitoring, and vessel performance analytics. The Marine Chartplotter market advances through partnerships between hardware manufacturers and software developers to offer seamless integration and OTA updates. It aligns with digital transformation trends across defense, commercial shipping, and luxury marine sectors.
Market Trends
Shift Toward Networked and Multifunction Displays to Streamline Marine Navigation
Modern vessels increasingly favor integrated displays that consolidate multiple functions including radar, sonar, and engine diagnostics alongside chartplotter data. This trend simplifies vessel operation by minimizing the need for separate screens and reducing system complexity. Operators benefit from intuitive interfaces that support split-screen views and real-time data overlays. Manufacturers invest in developing multifunction displays with faster processors and seamless connectivity. The Marine Chartplotter market reflects this trend with compact yet powerful systems that support plug-and-play configurations. It helps optimize space in small craft while enhancing situational awareness across vessel types.
- For instance, Raymarine’s Axiom Pro 12 combines CHIRP sonar, radar, FLIR thermal imaging, and engine integration on a quad-core 12.1-inch MFD, adopted in over 22,000 recreational and light commercial vessels globally.
Growth in Satellite-Based Augmentation and High-Precision Positioning Capabilities
Enhanced satellite navigation accuracy drives adoption of chartplotters capable of supporting GNSS and SBAS technologies. High-precision positioning supports safe operations in crowded ports, shallow waters, and complex waterways. Demand increases for systems compatible with real-time correction services and differential GPS inputs. This development supports commercial, recreational, and military users requiring consistent positioning accuracy under various weather and signal conditions. The Marine Chartplotter market incorporates these advancements to deliver chart accuracy and improved route planning. It remains aligned with technological upgrades in satellite infrastructure and receiver chipsets.
- For instance, Garmin’s ECHOMAP Ultra 126sv includes Wi-Fi and ActiveCaptain app integration, enabling wireless updates and user-synced charts, and has been installed on over 19,000 sport fishing vessels globally.
Rising Popularity of Touchscreen Interfaces and Mobile Device Synchronization
Marine operators seek chartplotters that mirror the usability of consumer electronics through intuitive touchscreens and mobile app pairing. Touch-enabled interfaces support gesture control and quick access to chart layers, routes, and system settings. Connectivity with smartphones and tablets allows data synchronization, firmware updates, and offboard route planning. This feature appeals to both tech-savvy recreational users and commercial operators looking to streamline workflows. The Marine Chartplotter market adapts by designing systems with customizable interfaces and wireless compatibility. It supports growing demand for onboard digitalization without increasing hardware complexity.
Emphasis on Cloud-Based Chart Updates and Remote Diagnostics to Improve System Performance
Digital transformation across marine sectors drives demand for cloud-enabled updates, remote diagnostics, and data logging features. Chartplotters now offer over-the-air updates for charts, software, and system parameters, reducing the need for manual downloads or physical media. This capability ensures vessels maintain up-to-date navigational data across international waters. Remote monitoring supports predictive maintenance and system troubleshooting from onshore locations. The Marine Chartplotter market integrates these features to improve system reliability and user convenience. It strengthens the role of digital platforms in maintaining compliance and reducing downtime.
Market Challenges Analysis
High Cost of Advanced Systems and Limited Adoption in Small-Scale Applications
The adoption of sophisticated chartplotters remains constrained by high initial costs and installation expenses, particularly in the small commercial and recreational segments. Entry-level users often rely on basic navigation tools or legacy systems that lack modern features such as real-time data integration and multifunction display capabilities. Price sensitivity continues to influence purchasing behavior, especially in cost-conscious regions with limited infrastructure support. The Marine Chartplotter market faces challenges in scaling adoption among budget-restricted operators who prioritize essential navigation over integrated solutions. It requires strategic pricing models and flexible product configurations to penetrate underserved customer groups. Manufacturers must address affordability without compromising performance or compliance standards.
Complexity of Integration with Legacy Systems and Inconsistent Connectivity in Remote Waters
System compatibility issues emerge when integrating chartplotters with older vessel architectures or mixed-brand marine electronics. Disparate communication protocols, outdated hardware, and lack of standardized interfaces increase deployment complexity and maintenance costs. Operators navigating in remote or low-coverage regions also face limitations in real-time updates, cloud-based services, and satellite connectivity. This reduces the effectiveness of high-end chartplotters that rely on continuous data streams for optimal performance. The Marine Chartplotter market contends with technical and logistical barriers that delay upgrade cycles in older fleets. It must balance innovation with backward compatibility to improve market reach and operational reliability.
Market Opportunities
Expansion of Smart Marine Ecosystems and Demand for Interconnected Navigation Platforms
Vessel operators increasingly seek cohesive digital ecosystems that integrate navigation, communication, and monitoring functions. Chartplotters serve as a central hub for connecting radar, sonar, AIS, engine diagnostics, and autopilot systems. This trend creates opportunities for manufacturers to develop modular platforms compatible with evolving marine electronics. Demand grows for chartplotters that support data sharing, remote diagnostics, and integration with mobile and cloud services. The Marine Chartplotter market can capitalize on this shift by offering scalable solutions tailored to diverse vessel classes and use cases. It benefits from the transition toward fully digital bridges and real-time situational awareness tools.
Rising Government Investments in Maritime Infrastructure and Coastal Security Programs
Global governments allocate increased funding toward modernizing port facilities, fisheries surveillance, and coastal defense systems. These initiatives require reliable navigation equipment to support patrol vessels, research ships, and transport fleets. Chartplotters integrated with secure communication links and environmental sensors play a critical role in mission execution and maritime domain awareness. The Marine Chartplotter market gains traction through contracts linked to public sector modernization programs. It finds growth potential in regions enhancing maritime governance, including Southeast Asia, the Middle East, and Latin America. Strategic alignment with government procurement standards creates long-term revenue opportunities for manufacturers.
Market Segmentation Analysis:
By Product Type:
The fixed mount segment holds a dominant share due to its integration into larger vessels requiring permanent navigation systems. Commercial operators and professional users prefer fixed mount chartplotters for their durability, screen size, and system stability. These units often connect with radar, sonar, and AIS modules to support extended voyages and intensive usage. Portable chartplotters appeal to small recreational boats and seasonal users who prioritize mobility and quick setup. Their compact design and battery-powered operation make them suitable for flexible navigation needs. The Marine Chartplotter market supports both segments by offering feature-rich options across a wide price range. It continues to evolve with ruggedized portable units featuring wireless connectivity and multi-network compatibility.
- For instance, Raymarine’s Axiom+ 12 RV system integrates with LightHouse OS, SeaTalkNG, and NMEA2000 protocols, managing over 25 onboard systems through a unified digital bridge used in superyachts exceeding 20 meters.
By Display Size:
Chartplotters with 7–12 inch displays remain the most widely adopted due to their balance between screen visibility and equipment footprint. This size range fits well across recreational boats, mid-size fishing vessels, and smaller commercial crafts. Units below 7 inches find use in entry-level applications or secondary displays, but face limitations in data visualization and user interface complexity. Larger displays, above 12 inches, serve high-end yachts and commercial ships where multi-window data processing and advanced route planning are essential. The Marine Chartplotter market sees increasing preference for high-resolution and touch-enabled displays across all size segments. It addresses this demand through scalable display options integrated with multifunction capabilities.
- For instance, Furuno’s TZtouchXL introduced a 22-inch hybrid-touch display with quad-core processors, designed for large commercial vessels, and adopted by over 500 fleet operators within its first year of release.
By End-User:
Recreational boats represent a major revenue segment driven by increased boating activity, leisure travel, and user-friendly technology adoption. These users favor plug-and-play systems with intuitive interfaces and mobile integration. Fishing vessels prioritize chartplotters with detailed bathymetric data, real-time fish finding support, and GPS precision. Commercial ships require certified navigation systems capable of long-range route optimization, safety compliance, and data sharing with other onboard systems. The Marine Chartplotter market serves each end-user group with differentiated features, from basic guidance tools to advanced, regulation-compliant navigation suites. It expands reach by aligning product specifications with varied operational requirements.
Segments:
Based on Product Type:
Based on Display Size:
- Below 7 inches
- 7-12 inches
- Above 12 inches
Based on End-User:
- Recreational boats
- Fishing vessels
- Commercial ships
Based on the Geography:
- North America
- Europe
- UK
- France
- Germany
- Italy
- Spain
- Russia
- Belgium
- Netherlands
- Austria
- Sweden
- Poland
- Denmark
- Switzerland
- Rest of Europe
- Asia Pacific
- China
- Japan
- South Korea
- India
- Australia
- Thailand
- Indonesia
- Vietnam
- Malaysia
- Philippines
- Taiwan
- Rest of Asia Pacific
- Latin America
- Brazil
- Argentina
- Peru
- Chile
- Colombia
- Rest of Latin America
- Middle East
- UAE
- KSA
- Israel
- Turkey
- Iran
- Rest of Middle East
- Africa
- Egypt
- Nigeria
- Algeria
- Morocco
- Rest of Africa
Regional Analysis
North America
North America leads the global street sweeper market with around 30% market share, driven by mature urban infrastructure, strict environmental regulations, and strong municipal budgets. The United States accounts for the majority of regional demand, with high adoption across city councils, highway departments, and private contractors managing commercial complexes and industrial parks. Governments invest heavily in smart city initiatives and emission control technologies, boosting demand for electric and hybrid sweepers. The presence of established players such as Elgin Sweeper and Tennant Company supports ongoing innovation in regenerative air and vacuum-type sweepers. It reflects a shift toward automation and remote monitoring features that optimize cleaning efficiency and fleet management. Canada follows with steady growth due to municipal cleanliness mandates and investment in cold-weather compatible models.
Europe
Europe accounts for approximately 28% of the global street sweeper market, supported by strong environmental policy enforcement, sustainable urban development, and high urban population density. Countries such as Germany, France, the United Kingdom, and the Netherlands lead in adoption of compact and electric sweepers suited for narrow roads and pedestrian areas. EU regulations on noise and particulate emissions continue to push municipalities toward battery-powered and low-noise models. European manufacturers like Bucher Municipal and FAYAT Group maintain strong regional dominance through a wide portfolio of mechanical, vacuum, and regenerative models. It also benefits from widespread public-private partnerships that support fleet modernization and recycling of street waste. Adoption accelerates in Eastern European markets with increasing urbanization and EU-funded infrastructure projects.
Asia-Pacific
Asia-Pacific holds roughly 24% market share in the global street sweeper market, with rapid growth led by China, Japan, South Korea, and India. Expanding urbanization, worsening air quality, and rising traffic congestion across megacities drive investments in municipal cleaning equipment. China remains the largest market within the region, deploying large fleets of sweepers for expressways, industrial zones, and urban streets. It also invests in electric and autonomous sweeper prototypes as part of smart city pilots. Japan and South Korea focus on high-efficiency, compact models suitable for dense urban layouts, while India emphasizes affordability and basic mechanical sweepers to serve large metropolitan regions. The Marine Chartplotter market gains from rising government emphasis on public health, urban safety, and compliance with emissions guidelines.
Latin America
Latin America captures nearly 10% of the market share, driven by urban expansion and increased pressure to maintain hygiene in public spaces. Brazil, Mexico, and Argentina dominate regional demand, with procurement focused on high-durability mechanical sweepers suitable for uneven roads and varying climates. Municipalities prioritize cost-effective, diesel-powered models due to limited electrification infrastructure. However, regional programs focused on reducing particulate emissions and promoting clean cities support long-term opportunities for battery-powered units. Manufacturers establish regional partnerships to enhance distribution networks and aftersales support. It remains a cost-sensitive market but shows increasing openness to technology-driven upgrades in large urban centers.
Middle East & Africa
The Middle East & Africa region accounts for about 8% of global market share, with adoption led by Gulf countries and urbanizing African economies. The UAE and Saudi Arabia invest in advanced street cleaning solutions as part of sustainability and urban beautification programs. High temperatures and dusty environments create demand for rugged, high-capacity vacuum sweepers that can handle sand accumulation. African countries, including South Africa and Nigeria, drive modest demand for entry-level mechanical sweepers supported by government sanitation programs. It sees emerging interest in solar-powered and hybrid models suited to off-grid deployment. Public sector tenders dominate the market landscape, and global manufacturers expand local presence through strategic alliances and regional assembly units.
Shape Your Report to Specific Countries or Regions & Enjoy 30% Off!
Key Player Analysis
Competitive Analysis
The Marine Chartplotter market features strong competition among leading players including Garmin Ltd., Furuno Electric Co., Ltd., Navico Group (Simrad, Lowrance, B&G), Raymarine (Teledyne Technologies), and Standard Horizon.These companies maintain market leadership by offering advanced navigation solutions with integrated sonar, radar, AIS, and GPS functionality. Each focuses on delivering reliable, high-precision chartplotters tailored for both commercial and recreational users. Product innovation emphasizes touchscreen interfaces, multifunction displays, and real-time data processing to support modern marine operations. Competitive differentiation lies in hardware performance, software ecosystems, and seamless device connectivity. Companies also invest in R&D to enhance GNSS compatibility, satellite augmentation, and remote monitoring capabilities. Strategic partnerships with boat manufacturers and marine electronics dealers expand global reach and aftersales support. Players strengthen market presence through regulatory-compliant systems aligned with international safety standards. Continuous upgrades and over-the-air software updates drive user engagement and system longevity. The competitive landscape remains dynamic, with innovation, reliability, and ease of integration shaping buyer preference across vessel classes.
Recent Developments
- In 2025, Raymarine released the Lighthouse 4.9 software update for its Axiom series, adding on-screen anchor mode controls, drag-circle alerts, and expanded support for third-party apps such as Netflix and Windy.
- In 2025, Simrad launched the NSS 4 chartplotter, designed for high-performance cruising and offshore sportfishing, featuring advanced processing power and a reimagined user interface.
- In December 2024, Raymarine partnered with Maretron to integrate advanced vessel monitoring and control systems with its marine electronics, enhancing navigation and onboard automation.
Market Concentration & Characteristics
The Marine Chartplotter market exhibits moderate to high market concentration, with a few global players accounting for a significant share of industry revenue. It is characterized by strong technological specialization, with manufacturers focusing on performance reliability, integration capability, and real-time data accuracy. The market favors companies with established marine electronics portfolios and extensive distribution networks. Product differentiation is driven by display resolution, GNSS accuracy, user interface design, and compatibility with radar, sonar, and AIS systems. It remains innovation-intensive, with R&D investments targeting multifunctionality, touchscreen control, cloud synchronization, and remote diagnostics. Barriers to entry are relatively high due to the complexity of navigation technology, regulatory compliance standards, and brand credibility requirements in the marine industry. The Marine Chartplotter market shows a strong aftermarket presence, supported by upgrades and replacements driven by evolving vessel requirements and safety mandates. It operates within a supply chain reliant on specialized components and partnerships with boat builders, installers, and marine service providers.
Report Coverage
The research report offers an in-depth analysis based on Product Type, Display Size, End-User and Geography. It details leading market players, providing an overview of their business, product offerings, investments, revenue streams, and key applications. Additionally, the report includes insights into the competitive environment, SWOT analysis, current market trends, as well as the primary drivers and constraints. Furthermore, it discusses various factors that have driven market expansion in recent years. The report also explores market dynamics, regulatory scenarios, and technological advancements that are shaping the industry. It assesses the impact of external factors and global economic changes on market growth. Lastly, it provides strategic recommendations for new entrants and established companies to navigate the complexities of the market.
Future Outlook
- The market will see growing demand for integrated navigation systems across commercial, recreational, and defense vessels.
- Manufacturers will focus on enhancing GNSS precision and multi-constellation satellite compatibility.
- Touchscreen displays and user-friendly interfaces will become standard across all product segments.
- Mobile device synchronization and cloud-based route planning will drive future product development.
- Demand for compact, multifunction displays will rise in small and mid-sized vessels.
- Electric and autonomous vessel growth will create new use cases for advanced chartplotters.
- Governments will invest more in electronic navigation systems for coastal safety and enforcement fleets.
- Remote diagnostics and software updates will support long-term system reliability and reduce maintenance costs.
- Sustainability goals will influence design, encouraging low-power and recyclable components.
- Asia-Pacific and Latin America will offer strong expansion opportunities through fleet modernization and infrastructure development.


