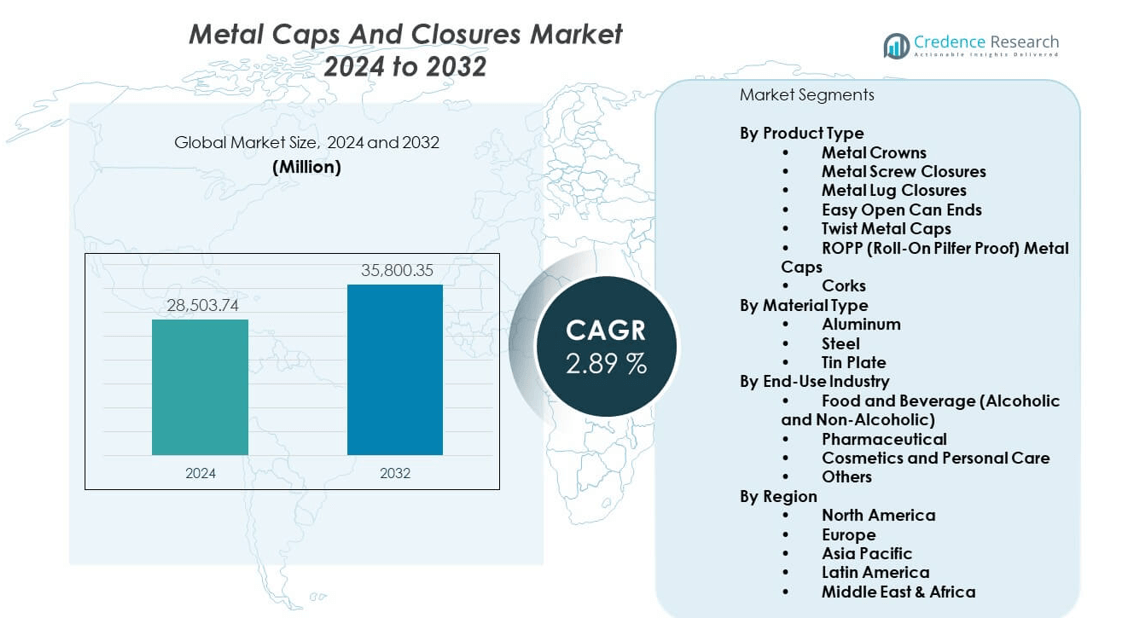
Home » Chemicals » Metal Caps And Closures Market

Metal Caps And Closures Market By Material Type (Aluminum, Tin, Stainless Steel, Copper) By Production Process (Injection Molding, Compression Molding)-Growth, Future Prospects & Competitive Analysis, 2016 – 2030

Price: $4999

Published: | Report ID: 20176 | Report Format : PDF

Key Highlights of the Report

The global metal caps and closures market is segmented by material type, production process, end use, and region. Aluminum category is the most popular material type, while compression molding category is the primary production process segment. In addition, the food & beverage category held the largest end-use segment share, with Asia Pacific leading the market growth.

The introduction of value-added products and design advancements by leading players are two of the main factors boosting the market for metal caps and closures. The demand for tamper-evident, airtight, threaded, dispensing-friendly metal caps and closures is driven by increased regulations on the safety and efficacy of food, beverage, and pharmaceutical compositions.

Nonetheless, the Asia Pacific market for metal caps and closures is predicted to grow at the greatest CAGR. The region is anticipated to maintain its dominance during the projected period due to rising demand from end-use sectors including the pharmaceutical, cosmetics, food, and beverage. A further factor fueling industry expansion is the increased amount of money major players invest in capacity expansion.

Market Overview

The global metal caps and closures market has witnessed steady growth in recent years and is expected to continue growing at a CAGR of 2.20% between 2023 and 2030. The market was valued at USD 1.1 billion in 2022 and is expected to reach USD 1.3 billion in 2030.

What Are The Main Drivers Of The Global Metal Caps And Closures Market?

Due to growth-promoting factors like rising demand from the food and beverage industry due to its protective qualities, the market for metal caps and closures is expanding rapidly.

What Are The Major Challenges Faced By The Global Metal Caps And Closures Market?

The market expansion for metal caps and closures is anticipated to be hampered by the availability of less expensive alternative caps and closures.

What Are The Growth Opportunities In The Global Metal Caps And Closures Market?

The demand for metal caps and closures is projected to increase in the next years as the personal care industry increasingly uses them due to their special features that improve shelf life. Furthermore, developing recyclable caps and closures in the near future may provide market participants with a lucrative opportunity.

Design Element 2

Access crucial information at unmatched prices!

Request your free sample report today & start making informed decisions powered by Credence Research!

Download Free Sample
CTA Design Element 3

Executive Summary

Overview of the Global Metal caps and closures Market

The market for metal caps and closures is expected to grow significantly in the upcoming years due to the increased demand for processed food products worldwide. The increase in population has increased the demand for food and drink, increasing the usage of caps and closures. Due to the increased demand for cosmetics and personal care products, the market for metal caps and closures is also predicted to expand in the upcoming years. Price fluctuation, however, can impede the market expansion for metal caps and closures. However, the market for metal caps and closures is predicted to have a lot of room for growth because of the ongoing improvements in product design.

Market Definition

The opening and dispensing a container are made easier by closures or caps. These design approaches also incorporate packaging that is child-resistant and tamper-evident. Depending on the container and product type, metal caps and closures come in various closure types and diameters. Additionally, they could give the container a decorative finish or branding. Metal caps and closures are crucial for preventing contamination of a container’s contents and giving it a polished appearance.

Market Insights

  • The global demand for metal caps and closures was valued at USD 1.1 Billion in 2022 and is expected to reach USD 1.3 Billion in 2030, growing at a CAGR of 2.20% between 2023 and 2030.
  • In terms of value, the aluminum category leads the market and accounted for almost 27% of sales in 2022. The stainless steel category is expected to increase at the fastest rate.
  • The compression molding category is expected to continue to dominate the metal caps and closures market through 2022, with a massive market share of over 52% predicted.
  • The food & beverage category leads the market and accounted for almost 21% of sales in 2022.
  • In 2022, Asia Pacific will account for roughly one-third of the global market for metal caps and closures, with the remaining 42% split between North America and Europe.
  • Two key elements driving the market for metal caps and closures are the launch of value-added products and design innovations by top manufacturers. The demand for tamper-evident, airtight, threaded, dispensing-friendly metal caps and closures is fueled by stricter laws governing the security and effectiveness of pharmaceutical, food, and beverage ingredients.
  • A quicker rate of growth is anticipated for the metal caps and closures market in Asia Pacific. It is anticipated that the region would continue to have a leading position over the projected period as a result of rising demand from end-use sectors such the pharmaceutical, cosmetics, food, and beverage industries. Big players’ increased sum of money in capacity development is another factor driving industry expansion.

Segmentation by Material Type

  • With almost 27% of the market share for metal caps and closures, the aluminum category remained the top rank in terms of product in 2022.
  • The global metal caps and closures market is expected to experience the quickest growth throughout the projected period in the stainless steel category.

Segmentation by Production Process

  • The compression molding segment led the metal caps and closures market, with a share of over 52% in 2022.
  • The injection molding category is anticipated to register the highest CAGR over the forecast period.

Segmentation by End Use

  • In 2022, the food & beverage segment held a market share of more than 21% of the metal caps and closures market.
  • The pharmaceuticals category is expected to have the greatest CAGR during the predicted period.

Segmentation by Region

  • Asia Pacific region held the largest global metal caps and closures market share in 2022.
  • In 2022, North America will occupy more than 22% of the global metal caps and closures market, with Europe accounting for just under 18%.
  • The rest of the world’s demand for metal caps and closures comes from Latin America, the Middle East, and Africa.

Metal caps and closures are predicted to develop dramatically in the next years due to the growing global demand for processed food products. The increase in population has boosted demand for food and drink, which has increased the use of caps and closures. The market for metal caps and closures is expected to grow in the future years as demand for cosmetics and personal care items rises.

Asia Pacific dominated the global metal caps and closures market due to the existence of two densely populated countries, China and India. The business for metal caps and closures will grow in tandem with these two nations’ rising disposable incomes. According to a survey conducted by Banco do Nordeste, India’s alcohol consumption in FY 2019 was 6.23 billion liters. In the fiscal year 2020, consumption is predicted to reach 6.53 billion liters. Furthermore, according to CARE Ratings, the Indian alcohol industry is predicted to grow to INR 1,754,000 million by 2021, raising the country’s alcoholic beverage packaging category from INR 1,475,000 million in 2016.

The market for metal caps and closures in North America is anticipated to grow at the highest CAGR. Customers’ eating habits are changing due to changing lifestyles and increased urbanization, which producers of food products are observing. The market for caps and closures is expanding as more consumers gravitate towards packaged and fresh food and beverages. As a result, manufacturers are implementing packaging solutions with improved convenience and aesthetic appeal. Throughout the projected period, this will support the expansion of the metal caps and closures market in North America.

Overall, the market for metal caps and closures is expected to have a lot of space for growth due to continual advances in product design.

Price fluctuations can stifle market expansion for metal caps and closures. However, the availability of less-priced alternative caps and closures is expected to hamper market growth for metal caps and closures.

Metal Caps And Closures Market

Metal Caps And Closures Provide Product Safety Features And User-Friendly Qualities

Adding value-added products and design advancements by leading players are two main factors boosting the metal caps and closures market. The demand for tamper-evident, airtight, threaded, dispensing-friendly metal caps and closures is driven by increased regulations on the safety and efficacy of food, beverage, and pharmaceutical compositions. The packaging industry’s preference for metal is further fueled by the introduction of metal caps and closures with extra features, including the ability to be opened, resealed, and flavor inclusion. For instance, consumers are becoming more interested in alcoholic beverages with unique and aesthetically pleasing flavors.

In addition to easier handling and portability, consumers are increasingly looking for smoother pouring. Vendors so increasingly rely on aesthetically pleasing designs and value-added products for increased sales. By offering elegant metal closures, most businesses add value to their products. For instance, PET containers with metal closures are a hot-fill option Amcor offers. A lightweight polyethylene terephthalate (PET) bottle is now available for consumers to experience the same high-quality product previously only offered in these packs in glass containers. The demand for metal caps and closures increased during the predicted period due to enhanced design patterns with extra value-added benefits.

Rising Adoption In The Food & Beverage Industry

Due to social and economic factors and growing environmental consciousness worldwide, metal packaging has recently gained popularity and increased demand. The primary engine of the market is the food and beverage sector. Due to the rise in demand for ready-to-eat and ready-to-drink meals and beverages, notably alcoholic and non-alcoholic beverages, metal cans are exploring new markets. Because there are more bars and eateries, more people are drinking beer, which has increased metal closure output. International food chains are also boosting demand for metal packaging options to aid them in entering untapped areas. It positively affects the expansion of the global metal caps and closures market.

Fluctuations In The Cost Of Raw Materials

The entry barriers into the manufacturing of metal caps and closures have become extremely low due to a decline in the price of aluminum and the ease with which processing equipment is available, allowing for the admission of numerous companies. Nevertheless, the majority of small-scale producers rely on straightforward designs and straightforward resin compositions. It developed major players, many of which are original equipment manufacturers (OEMs) of significant fast-moving consumer goods (FMCG) firms that use sophisticated designs and place a premium on quality and performance.

Due to the high competition level and minimal degree of difference, low-end gamers must pay exorbitant fees. Since fast-moving consumer goods businesses have significant negotiating strength, original equipment manufacturers’ profit margins are frequently under pressure. Players frequently use aggressive pricing strategies, which has an impact on the profit margins of the sector. Additionally, the vendors face great unpredictability due to fluctuating resin prices and rising energy costs, which frequently lowers their return on investments and capital utilized.

Increased Use In Pharmaceutical Applications

Since metal caps and closures are sterile and typically contain layered materials, the pharmaceutical industry primarily uses them. Most often used in the industry are metal caps made of steel and aluminum. As well as being natural or colored, plain or embossed, aluminum is highly customizable. As a result, pharmaceutical packaging can be provided to meet customer needs. Due to the pharmaceutical industry’s rapid expansion and regulatory reforms, the market is expected to be driven by child-resistant, value-added, and senior-friendly closures throughout the predicted period.

According to a recent estimate by the World Health Organisation (WHO), one-third of all medications sold worldwide are fraudulent. The adoption of anti-counterfeiting closures is being boosted by the growing threats of medicine counterfeiting and the resulting demand for effective solutions. Due to the tendency of their rubber counterparts to contaminate the medications, aluminum closures are increasingly being used in the pharmaceutical business. Elastomeric components of the container seal are to blame for the contamination. Microorganisms, endotoxins, and chemicals are potential pollutants. According to a Food and Drug Administration (FDA) study, 2,163 medications were recalled in 2019.

Entry Into A Vastly Underserved Market In Emerging Economies

In developing nations like India and China, the food retail sector has expanded dramatically, as has the acceptance of the trend toward ready-to-eat food. Sales of packaged foods have exploded in recent years. Local producers have long dominated local marketplaces in nations like China and India.

However, many overseas businesses have been compelled to enter the local market due to the significant opportunity presented by food retail growth. Metal cap and closure manufacturers can now concentrate on entering new markets through joint ventures or mergers and acquisitions. The market for metal caps and closures in North America, including the United States, also has promising prospects.

Competitive Landscape

Key Players

The global metal caps and closures market is highly competitive, with the presence of several key players. Some of the major players in the market and their market share are as follows:

These businesses prioritise product innovation, enlarging their distribution networks, and mergers and acquisitions to stay competitive in the market.

The key players in the worldwide metal caps and closures market are continually launching new products and developments in an effort to stay ahead.

December 2021: Pelliconi established a partnership with Tecnest to increase the efficiency with which both businesses perform and better serve their customers.

March 2021: Henkel’s business in closing materials was bought by ALTANA. The company will be incorporated into the ACTEGA division and globally allocated to the Metal Packaging Solutions business line within the ALTANA Group.

July 2019: Growpacker Inc., an American contract manufacturer of consumables laced with THC and CBD, recently announced the release of their Cannasafe child-resistant cover for aluminum cans holding THC-infused liquids.

April 2019: In order to combat wine and spirits sector counterfeiting, Tap and Thinfilm developed smart closures. The consumer is informed that the container or bottle may have been tampered with when the OpenSense system detects a broken closing seal.

Summary of Key Findings

  • The global demand for processed food products is expected to increase, which will cause metal caps and closures to change significantly over the next years. Consumption of food and drink has increased due to the growing population, which has also increased the use of caps and closures.
  • Market segmented by material type, production process, end use, and region.
  • Compression molding is the most popular, with injection molding as the primary metal caps and closures production process.
  • The aluminum segment is a most commonly used material type of the metal caps and closures market.
  • Asia Pacific is leading market growth; the market is highly competitive with key players including Crown Holdings Inc., O.Berk Company, Reynolds Packaging Group Ltd, Pelliconi & C. SpA, Nippon Closures Co. Ltd, Silgan White Cap, Sks Bottle & Packaging Inc., Amcor PLC, Berlin Packaging (Qorpak), Shadong Lipeng Co. Ltd and Rauh GmbH & Co. Blechwarenfabrikations-KG.

Shape Your Report to Specific Countries or Regions & Enjoy 30% Off!

Future Outlook

  • The global market for metal caps and closures is expected to increase significantly, especially in Asia.
  • As demand for cosmetics and personal care products increases in the coming years, the market for metal caps and closures is anticipated to expand.
  • Price variations may hamper market expansion for metal caps and closures. However, the availability of less expensive substitute caps and closures is anticipated to hinder market expansion for metal caps and closures.
  • To be competitive in the market, major companies should focus on creating novel items, expanding their market, and maintaining cheap power ratings.

Segmentation

  • By Material Type
    • Aluminum
    • Tin
    • Stainless Steel
    • Copper
  • By Production Process
    • Injection Molding
    • Compression Molding
  • By End Use
    • Food & Beverage
    • Consumer Goods
    • Personal Care & Cosmetics
    • Homecare
    • Pharmaceuticals
    • Others (Chemical, Agro-Products, etc.)
  • By Region
  • North America
    • US
    • Canada
    • Mexico
  • Europe
    • Germany
    • France
    • U.K.
    • Italy
    • Spain
    • Rest of Europe
  • Asia Pacific
    • China
    • Japan
    • India
    • South Korea
    • South-east Asia
    • Rest of Asia Pacific
  • Latin America
    • Brazil
    • Argentina
    • Rest of Latin America
  • Middle East & Africa
    • GCC Countries
    • South Africa
    • Rest of Middle East and Africa

1. Preface
1.1. Report Description
1.1.1. Purpose of the Report
1.1.2. Target Audience
1.1.3. USP and Key Offerings
1.2. Research Scope
1.3. Research Methodology
1.3.1. Phase I – Secondary Research
1.3.2. Phase II – Data Modelling
1.3.2.1. Company Share Analysis Model
1.3.2.2. Revenue Based Modelling
1.3.3. Phase III – Primary Research
1.3.4. Research Limitations
1.3.5. Assumptions
1.4. Market Introduction
1.5. Market Research Scope
2. Executive Summary

2.1. Market Snapshot: Global Metal Caps and Closures Market
2.2. Global Metal Caps and Closures Market, By Material Type
2.3. Global Metal Caps and Closures Market, By Production Process
2.4. Global Metal Caps and Closures Market, By End Use
2.5. Global Metal Caps and Closures Market, By Region

3. Market Dynamics & Factors Analysis
3.1. Introduction
3.1.1. Global Metal Caps and Closures Market Value, 2017-2030, (US$ Bn)
3.1.2. Y-o-Y Growth Trend Analysis
3.2. Market Dynamics
3.2.1. Market Drivers
3.2.2. Market Restraints
3.2.3. Market Opportunities
3.2.4. Major Industry Challenges
3.3. Growth and Development Patterns
3.4. Investment Feasibility Analysis
3.5. Market Opportunity Analysis
3.5.1. Material Type
3.5.2. Production Process
3.5.3. End Use
3.5.4. Geography

4. Premium Insights
4.1. STAR (Situation, Task, Action, Results) Analysis
4.2. Porter’s Five Forces Analysis
4.2.1. Threat of New Entrants
4.2.2. Bargaining Power of Buyers/Consumers
4.2.3. Bargaining Power of Suppliers
4.2.4. Threat of Substitute Types
4.2.5. Intensity of Competitive Rivalry
4.3. Key Market Trends
4.3.1. Demand Side Trends
4.3.2. Supply Side Trends
4.4. Value Chain Analysis
4.5. Technology Analysis
4.6. Analysis and Recommendations
4.7. Marketing Strategy Analysis
4.7.1. Direct Marketing
4.7.2. Indirect Marketing
4.7.3. Marketing Channel Development Trend

5. Market Positioning of Key Players, 2022
5.1. Company market share of key players, 2022
5.2. Competitive Benchmarking
5.3. Market Positioning of Key Vendors
5.4. Geographical Presence Analysis
5.5. Major Strategies Adopted by Key Players
5.5.1. Key Strategies Analysis
5.5.2. Mergers and Acquisitions
5.5.3. Partnerships
5.5.4. Product Launch
5.5.5. Geographical Expansion
5.5.6. Others

6. Economic Impact Analysis
6.1. Recession Impact
6.1.1. North America
6.1.2. Europe
6.1.3. Asia Pacific
6.1.4. Latin America
6.1.5. Middle East and Africa
6.2. Ukraine-Russia War Impact
6.2.1. North America
6.2.2. Europe
6.2.3. Asia Pacific
6.2.4. Latin America
6.2.5. Middle East and Africa
6.3. COVID-19 Impact Analysis
6.3.1. North America
6.3.2. Europe
6.3.3. Asia Pacific
6.3.4. Latin America
6.3.5. Middle East and Africa

7. Global Metal Caps and Closures Market, By Material Type
7.1. Global Metal Caps and Closures Market Overview, by Material Type
7.1.1. Global Metal Caps and Closures Market Revenue Share, By Material Type, 2022 Vs 2030 (in %)
7.2. Aluminum
7.2.1. Global Metal Caps and Closures Market, By Region, 2017-2030 (US$ Bn)
7.3. Tin
7.3.1. Global Metal Caps and Closures Market, By Region, 2017-2030 (US$ Bn)
7.4. Stainless Steel
7.4.1. Global Metal Caps and Closures Market, By Region, 2017-2030 (US$ Bn)
7.5. Copper
7.5.1. Global Metal Caps and Closures Market, By Region, 2017-2030 (US$ Bn)

8. Global Metal Caps and Closures Market, By Production Process
8.1. Global Metal Caps and Closures Market Overview, by Production Process
8.1.1. Global Metal Caps and Closures Market, By Production Process, 2022 vs 2030 (in %)
8.2. Injection Molding
8.2.1. Global Metal Caps and Closures Market, By Region, 2017-2030 (US$ Bn)
8.3. Compression Molding
8.3.1. Global Metal Caps and Closures Market, By Region, 2017-2030 (US$ Bn)

9. Global Metal Caps and Closures Market, by End Use, 2017-2030 (US$ Bn)
9.1. Global Metal Caps and Closures Market Overview, by End Use
9.1.1. Global Metal Caps and Closures Market, By End Use, 2022 vs 2030 (in%)
9.2. Food & Beverage
9.2.1. Global Metal Caps and Closures Market, By Region, 2017-2030 (US$ Bn)
9.3. Consumer Goods
9.3.1. Global Metal Caps and Closures Market, By Region, 2017-2030 (US$ Bn)
9.4. Personal Care & Cosmetics
9.4.1. Global Metal Caps and Closures Market, By Region, 2017-2030 (US$ Bn)
9.5. Homecare
9.5.1. Global Metal Caps and Closures Market, By Region, 2017-2030 (US$ Bn)
9.6. Pharmaceuticals
9.6.1. Global Metal Caps and Closures Market, By Region, 2017-2030 (US$ Bn)
9.7. Others
9.7.1. Global Metal Caps and Closures Market, By Region, 2017-2030 (US$ Bn)

10. Global Metal Caps and Closures Market, By Region
10.1. Global Metal Caps and Closures Market Overview, by Region
10.1.1. Global Metal Caps and Closures Market, By Region, 2022 vs 2030 (in%)
10.2. Material Type
10.2.1. Global Metal Caps and Closures Market, By Material Type, 2017-2030 (US$ Bn)
10.3. Production Process
10.3.1. Global Metal Caps and Closures Market, By Production Process, 2017-2030 (US$ Bn)
10.4. End Use
10.4.1. Global Metal Caps and Closures Market, By End Use, 2017-2030 (US$ Bn)

11. North America Metal Caps and Closures Market Analysis
11.1. North America Metal Caps and Closures Market, by Material Type, 2017-2030(US$ Bn)
11.1.1. Overview
11.1.2. SRC Analysis
11.2. North America Metal Caps and Closures Market, by Production Process, 2017-2030(US$ Bn)
11.2.1. Overview
11.2.2. SRC Analysis
11.3. North America Metal Caps and Closures Market, by End Use, 2017-2030(US$ Bn)
11.3.1. Overview
11.3.2. SRC Analysis
11.4. North America Metal Caps and Closures Market, by Country, 2017-2030 (US$ Bn)
11.4.1. North America Metal Caps and Closures Market, by Country, 2022 Vs 2030 (in%)
11.4.2. U.S.
11.4.2.1. U.S. Metal Caps and Closures Market Estimates and Forecast, 2017-2030 (US$ Bn)
11.4.2.2. U.S. Metal Caps and Closures, By Material Type, 2017-2030 (US$ Bn)
11.4.2.3. U.S. Metal Caps and Closures, By Production Process, 2017-2030 (US$ Bn)
11.4.2.4. U.S. Metal Caps and Closures, By End Use, 2017-2030 (US$ Bn)
11.4.3. Canada
11.4.3.1. Canada Metal Caps and Closures Market Estimates and Forecast, 2017-2030 (US$ Bn)
11.4.3.2. Canada Metal Caps and Closures, By Material Type, 2017-2030 (US$ Bn)
11.4.3.3. Canada Metal Caps and Closures, By Production Process, 2017-2030 (US$ Bn)
11.4.3.4. Canada Metal Caps and Closures, By End Use, 2017-2030 (US$ Bn)
11.4.4. Mexico
11.4.4.1. Mexico Metal Caps and Closures Market Estimates and Forecast, 2017-2030 (US$ Bn)
11.4.4.2. Mexico Metal Caps and Closures, By Material Type, 2017-2030 (US$ Bn)
11.4.4.3. Mexico Metal Caps and Closures, By Production Process, 2017-2030 (US$ Bn)
11.4.4.4. Mexico Metal Caps and Closures, By End Use, 2017-2030 (US$ Bn)

12. Europe Metal Caps and Closures Market Analysis
12.1. Europe Metal Caps and Closures Market, by Material Type, 2017-2030(US$ Bn)
12.1.1. Overview
12.1.2. SRC Analysis
12.2. Europe Metal Caps and Closures Market, by Production Process, 2017-2030(US$ Bn)
12.2.1. Overview
12.2.2. SRC Analysis
12.3. Europe Metal Caps and Closures Market, by End Use, 2017-2030(US$ Bn)
12.3.1. Overview
12.3.2. SRC Analysis
12.4. Europe Metal Caps and Closures Market, by Country, 2017-2030 (US$ Bn)
12.4.1. Europe Metal Caps and Closures Market, by Country, 2022 Vs 2030 (in%)
12.4.2. Germany
12.4.2.1. Germany Metal Caps and Closures Market Estimates and Forecast, 2017-2030 (US$ Bn)
12.4.2.2. Germany Metal Caps and Closures, By Material Type, 2017-2030 (US$ Bn)
12.4.2.3. Germany Metal Caps and Closures, By Production Process, 2017-2030 (US$ Bn)
12.4.2.4. Germany Metal Caps and Closures, By End Use, 2017-2030 (US$ Bn)
12.4.3. France
12.4.3.1. France Metal Caps and Closures Market Estimates and Forecast, 2017-2030 (US$ Bn)
12.4.3.2. France Metal Caps and Closures, By Material Type, 2017-2030 (US$ Bn)
12.4.3.3. France Metal Caps and Closures, By Production Process, 2017-2030 (US$ Bn)
12.4.3.4. France Metal Caps and Closures, By End Use, 2017-2030 (US$ Bn)
12.4.4. UK
12.4.4.1. UK Metal Caps and Closures Market Estimates and Forecast, 2017-2030 (US$ Bn)
12.4.4.2. UK Metal Caps and Closures, By Material Type, 2017-2030 (US$ Bn)
12.4.4.3. UK Metal Caps and Closures, By Production Process, 2017-2030 (US$ Bn)
12.4.4.4. UK Metal Caps and Closures, By End Use, 2017-2030 (US$ Bn)
12.4.5. Italy
12.4.5.1. Italy Metal Caps and Closures Market Estimates and Forecast, 2017-2030 (US$ Bn)
12.4.5.2. Italy Metal Caps and Closures, By Material Type, 2017-2030 (US$ Bn)
12.4.5.3. Italy Metal Caps and Closures, By Production Process, 2017-2030 (US$ Bn)
12.4.5.4. Italy Metal Caps and Closures, By End Use, 2017-2030 (US$ Bn)
12.4.6. Spain
12.4.6.1. Spain Metal Caps and Closures Market Estimates and Forecast, 2017-2030 (US$ Bn)
12.4.6.2. Spain Metal Caps and Closures, By Material Type, 2017-2030 (US$ Bn)
12.4.6.3. Spain Metal Caps and Closures, By Production Process, 2017-2030 (US$ Bn)
12.4.6.4. Spain Metal Caps and Closures, By End Use, 2017-2030 (US$ Bn)
12.4.7. Rest of Europe
12.4.7.1. Rest of Europe Metal Caps and Closures Market Estimates and Forecast, 2017-2030 (US$ Bn)
12.4.7.2. Rest of Europe Metal Caps and Closures, By Material Type, 2017-2030 (US$ Bn)
12.4.7.3. Rest of Europe Metal Caps and Closures, By Production Process, 2017-2030 (US$ Bn)
12.4.7.4. Rest of Europe Metal Caps and Closures, By End Use, 2017-2030 (US$ Bn)

13. Asia Pacific Metal Caps and Closures Market Analysis
13.1. Asia Pacific Metal Caps and Closures Market, by Material Type, 2017-2030(US$ Bn)
13.1.1. Overview
13.1.2. SRC Analysis
13.2. Asia Pacific Metal Caps and Closures Market, by Production Process, 2017-2030(US$ Bn)
13.2.1. Overview
13.2.2. SRC Analysis
13.3. Asia Pacific Metal Caps and Closures Market, by End Use, 2017-2030(US$ Bn)
13.3.1. Overview
13.3.2. SRC Analysis
13.4. Asia Pacific Metal Caps and Closures Market, by Country, 2017-2030 (US$ Bn)
13.4.1. Asia Pacific Metal Caps and Closures Market, by Country, 2022 Vs 2030 (in%)
13.4.2. China
13.4.2.1. China Metal Caps and Closures Market Estimates and Forecast, 2017-2030 (US$ Bn)
13.4.2.2. China Metal Caps and Closures, By Material Type, 2017-2030 (US$ Bn)
13.4.2.3. China Metal Caps and Closures, By Production Process, 2017-2030 (US$ Bn)
13.4.2.4. China Metal Caps and Closures, By End Use, 2017-2030 (US$ Bn)
13.4.3. Japan
13.4.3.1. Japan Metal Caps and Closures Market Estimates and Forecast, 2017-2030 (US$ Bn)
13.4.3.2. Japan Metal Caps and Closures, By Material Type, 2017-2030 (US$ Bn)
13.4.3.3. Japan Metal Caps and Closures, By Production Process, 2017-2030 (US$ Bn)
13.4.3.4. Japan Metal Caps and Closures, By End Use, 2017-2030 (US$ Bn)
13.4.4. India
13.4.4.1. India Metal Caps and Closures Market Estimates and Forecast, 2017-2030 (US$ Bn)
13.4.4.2. India Metal Caps and Closures, By Material Type, 2017-2030 (US$ Bn)
13.4.4.3. India Metal Caps and Closures, By Production Process, 2017-2030 (US$ Bn)
13.4.4.4. India Metal Caps and Closures, By End Use, 2017-2030 (US$ Bn)
13.4.5. South Korea
13.4.5.1. South Korea Metal Caps and Closures Market Estimates and Forecast, 2017-2030 (US$ Bn)
13.4.5.2. South Korea Metal Caps and Closures, By Material Type, 2017-2030 (US$ Bn)
13.4.5.3. South Korea Metal Caps and Closures, By Production Process, 2017-2030 (US$ Bn)
13.4.5.4. South Korea Metal Caps and Closures, By End Use, 2017-2030 (US$ Bn)
13.4.6. South-East Asia
13.4.6.1. South-East Asia Metal Caps and Closures Market Estimates and Forecast, 2017-2030 (US$ Bn)
13.4.6.2. South-East Asia Metal Caps and Closures, By Material Type, 2017-2030 (US$ Bn)
13.4.6.3. South-East Asia Metal Caps and Closures, By Production Process, 2017-2030 (US$ Bn)
13.4.6.4. South-East Asia Metal Caps and Closures, By End Use, 2017-2030 (US$ Bn)
13.4.7. Rest of Asia Pacific
13.4.7.1. Rest of Asia Pacific Metal Caps and Closures Market Estimates and Forecast, 2017-2030 (US$ Bn)
13.4.7.2. Rest of Asia Pacific Metal Caps and Closures, By Material Type, 2017-2030 (US$ Bn)
13.4.7.3. Rest of Asia Pacific Metal Caps and Closures, By Production Process, 2017-2030 (US$ Bn)
13.4.7.4. Rest of Asia Pacific Metal Caps and Closures, By End Use, 2017-2030 (US$ Bn)

14. Latin America Metal Caps and Closures Market Analysis
14.1. Latin America Metal Caps and Closures Market, by Material Type, 2017-2030(US$ Bn)
14.1.1. Overview
14.1.2. SRC Analysis
14.2. Latin America Metal Caps and Closures Market, by Production Process, 2017-2030(US$ Bn)
14.2.1. Overview
14.2.2. SRC Analysis
14.3. Latin America Metal Caps and Closures Market, by End Use, 2017-2030(US$ Bn)
14.3.1. Overview
14.3.2. SRC Analysis
14.4. Latin America Metal Caps and Closures Market, by Country, 2017-2030 (US$ Bn)
14.4.1. Latin America Metal Caps and Closures Market, by Country, 2022 Vs 2030 (in%)
14.4.2. Brazil
14.4.2.1. Brazil Metal Caps and Closures Market Estimates and Forecast, 2017-2030 (US$ Bn)
14.4.2.2. Brazil Metal Caps and Closures, By Material Type, 2017-2030 (US$ Bn)
14.4.2.3. Brazil Metal Caps and Closures, By Production Process, 2017-2030 (US$ Bn)
14.4.2.4. Brazil Metal Caps and Closures, By End Use, 2017-2030 (US$ Bn)
14.4.3. Argentina
14.4.3.1. Argentina Metal Caps and Closures Market Estimates and Forecast, 2017-2030 (US$ Bn)
14.4.3.2. Argentina Metal Caps and Closures, By Material Type, 2017-2030 (US$ Bn)
14.4.3.3. Argentina Metal Caps and Closures, By Production Process, 2017-2030 (US$ Bn)
14.4.3.4. Argentina Metal Caps and Closures, By End Use, 2017-2030 (US$ Bn)
14.4.4. Rest of Latin America
14.4.4.1. Rest of Latin America Metal Caps and Closures Market Estimates and Forecast, 2017-2030 (US$ Bn)
14.4.4.2. Rest of Latin America Metal Caps and Closures, By Material Type, 2017-2030 (US$ Bn)
14.4.4.3. Rest of Latin America Metal Caps and Closures, By Production Process, 2017-2030 (US$ Bn)
14.4.4.4. Rest of Latin America Metal Caps and Closures, By End Use, 2017-2030 (US$ Bn)

15. Middle East and Africa Metal Caps and Closures Market Analysis
15.1. Middle East and Africa Metal Caps and Closures Market, by Material Type, 2017-2030(US$ Bn)
15.1.1. Overview
15.1.2. SRC Analysis
15.2. Middle East and Africa Metal Caps and Closures Market, by Production Process, 2017-2030(US$ Bn)
15.2.1. Overview
15.2.2. SRC Analysis
15.3. Middle East and Africa Metal Caps and Closures Market, by End Use, 2017-2030(US$ Bn)
15.3.1. Overview
15.3.2. SRC Analysis
15.4. Middle East and Africa Metal Caps and Closures Market, by Country, 2017-2030 (US$ Bn)
15.4.1. Middle East and Africa Metal Caps and Closures Market, by Country, 2022 Vs 2030 (in%)
15.4.2. GCC Countries
15.4.2.1. GCC Countries Metal Caps and Closures Market Estimates and Forecast, 2017-2030 (US$ Bn)
15.4.2.2. GCC Countries Metal Caps and Closures, By Material Type, 2017-2030 (US$ Bn)
15.4.2.3. GCC Countries Metal Caps and Closures, By Production Process, 2017-2030 (US$ Bn)
15.4.2.4. GCC Countries Metal Caps and Closures, By End Use, 2017-2030 (US$ Bn)
15.4.3. South Africa
15.4.3.1. South Africa Metal Caps and Closures Market Estimates and Forecast, 2017-2030 (US$ Bn)
15.4.3.2. South Africa Metal Caps and Closures, By Material Type, 2017-2030 (US$ Bn)
15.4.3.3. South Africa Metal Caps and Closures, By Production Process, 2017-2030 (US$ Bn)
15.4.3.4. South Africa Metal Caps and Closures, By End Use, 2017-2030 (US$ Bn)
15.4.4. Rest of Middle East and Africa
15.4.4.1. Rest of Middle East and Africa Metal Caps and Closures Market Estimates and Forecast, 2017-2030 (US$ Bn)
15.4.4.2. Rest of Middle East and Africa Metal Caps and Closures, By Material Type, 2017-2030 (US$ Bn)
15.4.4.3. Rest of Middle East and Africa Metal Caps and Closures, By Production Process, 2017-2030 (US$ Bn)
15.4.4.4. Rest of Middle East and Africa Metal Caps and Closures, By End Use, 2017-2030 (US$ Bn)

16. Company Profiles
16.1. Crown Holdings Inc.
16.1.1. Company Overview
16.1.2. Products/Services Portfolio
16.1.3. Geographical Presence
16.1.4. Financial Summary
16.1.4.1. Market Revenue and Net Profit (2019-2022)
16.1.4.2. Business Segment Revenue Analysis
16.1.4.3. Geographical Revenue Analysis
16.2. O.Berk Company
16.3. Reynolds Packaging Group Ltd
16.4. Pelliconi & C. SpA
16.5. Nippon Closures Co. Ltd
16.6. Silgan White Cap
16.7. Sks Bottle & Packaging Inc.
16.8. Amcor PLC
16.9. Berlin Packaging (Qorpak)
16.10. Shadong Lipeng Co. Ltd
16.11. Rauh GmbH & Co. Blechwarenfabrikations-KG

List of Figures
FIG. 1 Global Metal Caps and Closures Market: Research Methodology
FIG. 2 Market Size Estimation – Top Down & Bottom up Approach
FIG. 3 Global Metal Caps and Closures Market Segmentation
FIG. 4 Global Metal Caps and Closures Market, by Material Type, 2022 (US$ Bn)
FIG. 5 Global Metal Caps and Closures Market, by Production Process, 2022 (US$ Bn)
FIG. 6 Global Metal Caps and Closures Market, by End Use, 2022 (US$ Bn)
FIG. 7 Global Metal Caps and Closures Market, by Geography, 2022 (US$ Bn)
FIG. 8 Attractive Investment Proposition, by Material Type, 2022
FIG. 9 Attractive Investment Proposition, by Production Process, 2022
FIG. 10 Attractive Investment Proposition, by End Use, 2022
FIG. 11 Attractive Investment Proposition, by Geography, 2022
FIG. 12 Global Market Share Analysis of Key Metal Caps and Closures Market Manufacturers, 2022
FIG. 13 Global Market Positioning of Key Metal Caps and Closures Market Manufacturers, 2022
FIG. 14 Global Metal Caps and Closures Market Value Contribution, By Material Type, 2022 & 2030 (Value %)
FIG. 15 Global Metal Caps and Closures Market, by Aluminum, Value, 2017-2030 (US$ Bn)
FIG. 16 Global Metal Caps and Closures Market, by Tin, Value, 2017-2030 (US$ Bn)
FIG. 17 Global Metal Caps and Closures Market, by Stainless Steel, Value, 2017-2030 (US$ Bn)
FIG. 18 Global Metal Caps and Closures Market, by Copper, Value, 2017-2030 (US$ Bn)
FIG. 19 Global Metal Caps and Closures Market Value Contribution, By Production Process, 2022 & 2030 (Value %)
FIG. 20 Global Metal Caps and Closures Market, by Injection Molding, Value, 2017-2030 (US$ Bn)
FIG. 21 Global Metal Caps and Closures Market, by Compression Molding, 2017-2030 (US$ Bn)
FIG. 22 Global Metal Caps and Closures Market Value Contribution, By End Use, 2022 & 2030 (Value %)
FIG. 23 Global Metal Caps and Closures Market, by Food & Beverage, Value, 2017-2030 (US$ Bn)
FIG. 24 Global Metal Caps and Closures Market, by Consumer Goods, 2017-2030 (US$ Bn)
FIG. 25 Global Metal Caps and Closures Market, by Personal Care & Cosmetics, 2017-2030 (US$ Bn)
FIG. 26 Global Metal Caps and Closures Market, by Homecare, 2017-2030 (US$ Bn)
FIG. 27 Global Metal Caps and Closures Market, by Pharmaceuticals, 2017-2030 (US$ Bn)
FIG. 28 Global Metal Caps and Closures Market, by Others, 2017-2030 (US$ Bn)
FIG. 29 North America Metal Caps and Closures Market, 2017-2030 (US$ Bn)
FIG. 30 U.S. Metal Caps and Closures Market, 2017-2030 (US$ Bn)
FIG. 31 Canada Metal Caps and Closures Market, 2017-2030 (US$ Bn)
FIG. 32 Europe Metal Caps and Closures Market, 2017-2030 (US$ Bn)
FIG. 33 Germany Metal Caps and Closures Market, 2017-2030 (US$ Bn)
FIG. 34 France Metal Caps and Closures Market, 2017-2030 (US$ Bn)
FIG. 35 U.K. Metal Caps and Closures Market, 2017-2030 (US$ Bn)
FIG. 36 Italy Metal Caps and Closures Market, 2017-2030 (US$ Bn)
FIG. 37 Spain Metal Caps and Closures Market, 2017-2030 (US$ Bn)
FIG. 38 Rest of Europe Metal Caps and Closures Market, 2017-2030 (US$ Bn)
FIG. 39 Asia Pacific Metal Caps and Closures Market, 2017-2030 (US$ Bn)
FIG. 40 China Metal Caps and Closures Market, 2017-2030 (US$ Bn)
FIG. 41 Japan Metal Caps and Closures Market, 2017-2030 (US$ Bn)
FIG. 42 India Metal Caps and Closures Market, 2017-2030 (US$ Bn)
FIG. 43 South Korea Metal Caps and Closures Market, 2017-2030 (US$ Bn)
FIG. 44 South-East Asia Metal Caps and Closures Market, 2017-2030 (US$ Bn)
FIG. 45 Rest of Asia Pacific Metal Caps and Closures Market, 2017-2030 (US$ Bn)
FIG. 46 Latin America Metal Caps and Closures Market, 2017-2030 (US$ Bn)
FIG. 47 Brazil Metal Caps and Closures Market, 2017-2030 (US$ Bn)
FIG. 48 Mexico Metal Caps and Closures Market, 2017-2030 (US$ Bn)
FIG. 49 Rest of Latin America Metal Caps and Closures Market, 2017-2030 (US$ Bn)
FIG. 50 Middle East & Africa Metal Caps and Closures Market, 2017-2030 (US$ Bn)
FIG. 51 GCC Countries Metal Caps and Closures Market, 2017-2030 (US$ Bn)
FIG. 52 South Africa Metal Caps and Closures Market, 2017-2030 (US$ Bn)
FIG. 53 Rest of Middle East and Africa Metal Caps and Closures Market, 2017-2030 (US$ Bn)

List of Tables
TABLE 1 Market Snapshot: Global Metal Caps and Closures Market
TABLE 2 Global Metal Caps and Closures Market: Market Drivers Impact Analysis
TABLE 3 Global Metal Caps and Closures Market: Market Restraints Impact Analysis
TABLE 4 Global Metal Caps and Closures Market, by Competitive Benchmarking, 2022
TABLE 5 Global Metal Caps and Closures Market, by Geographical Presence Analysis, 2022
TABLE 6 Global Metal Caps and Closures Market, by Key Strategies Analysis, 2022
TABLE 7 Global Metal Caps and Closures Market, by Aluminum, By Region, 2017-2022 (US$ Bn)
TABLE 8 Global Metal Caps and Closures Market, by Aluminum, By Region, 2023-2030 (US$ Bn)
TABLE 9 Global Metal Caps and Closures Market, by Tin, By Region, 2017-2022 (US$ Bn)
TABLE 10 Global Metal Caps and Closures Market, by Tin, By Region, 2023-2030 (US$ Bn)
TABLE 11 Global Metal Caps and Closures Market, by Stainless Steel, By Region, 2017-2022 (US$ Bn)
TABLE 12 Global Metal Caps and Closures Market, by Stainless Steel, By Region, 2023-2030 (US$ Bn)
TABLE 13 Global Metal Caps and Closures Market, by Copper, By Region, 2017-2022 (US$ Bn)
TABLE 14 Global Metal Caps and Closures Market, by Copper, By Region, 2023-2030 (US$ Bn)
TABLE 15 Global Metal Caps and Closures Market, by Injection Molding, By Region, 2017-2022 (US$ Bn)
TABLE 16 Global Metal Caps and Closures Market, by Injection Molding, By Region, 2023-2030 (US$ Bn)
TABLE 17 Global Metal Caps and Closures Market, by Compression Molding, By Region, 2017-2022 (US$ Bn)
TABLE 18 Global Metal Caps and Closures Market, by Compression Molding, By Region, 2023-2030 (US$ Bn)
TABLE 19 Global Metal Caps and Closures Market, by Food & Beverage, By Region, 2017-2022 (US$ Bn)
TABLE 20 Global Metal Caps and Closures Market, by Food & Beverage, By Region, 2023-2030 (US$ Bn)
TABLE 21 Global Metal Caps and Closures Market, by Consumer Goods, By Region, 2017-2022 (US$ Bn)
TABLE 22 Global Metal Caps and Closures Market, by Consumer Goods, By Region, 2023-2030 (US$ Bn)
TABLE 23 Global Metal Caps and Closures Market, by Personal Care & Cosmetics, By Region, 2017-2022 (US$ Bn)
TABLE 24 Global Metal Caps and Closures Market, by Personal Care & Cosmetics, By Region, 2023-2030 (US$ Bn)
TABLE 25 Global Metal Caps and Closures Market, by Homecare, By Region, 2017-2022 (US$ Bn)
TABLE 26 Global Metal Caps and Closures Market, by Homecare, By Region, 2023-2030 (US$ Bn)
TABLE 27 Global Metal Caps and Closures Market, by Pharmaceuticals, By Region, 2017-2022 (US$ Bn)
TABLE 28 Global Metal Caps and Closures Market, by Pharmaceuticals, By Region, 2023-2030 (US$ Bn)
TABLE 29 Global Metal Caps and Closures Market, by Others, By Region, 2017-2022 (US$ Bn)
TABLE 30 Global Metal Caps and Closures Market, by Others, By Region, 2023-2030 (US$ Bn)
TABLE 31 Global Metal Caps and Closures Market, by Material Type, 2017-2022 (US$ Bn)
TABLE 32 Global Metal Caps and Closures Market, by Material Type, 2023-2030 (US$ Bn)
TABLE 33 Global Metal Caps and Closures Market, by Production Process, 2017-2022 (US$ Bn)
TABLE 34 Global Metal Caps and Closures Market, by Production Process, 2023-2030 (US$ Bn)
TABLE 35 Global Metal Caps and Closures Market, by End Use, 2017-2022 (US$ Bn)
TABLE 36 Global Metal Caps and Closures Market, by End Use, 2023-2030 (US$ Bn)
TABLE 37 Global Metal Caps and Closures Market, by Region, 2017-2022 (US$ Bn)
TABLE 38 Global Metal Caps and Closures Market, by Region, 2023-2030 (US$ Bn)
TABLE 39 North America Metal Caps and Closures Market, by Material Type, 2017-2022 (US$ Bn)
TABLE 40 North America Metal Caps and Closures Market, by Material Type, 2023-2030 (US$ Bn)
TABLE 41 North America Metal Caps and Closures Market, by Production Process, 2017-2022 (US$ Bn)
TABLE 42 North America Metal Caps and Closures Market, by Production Process, 2023-2030 (US$ Bn)
TABLE 43 North America Metal Caps and Closures Market, by End Use, 2017-2022 (US$ Bn)
TABLE 44 North America Metal Caps and Closures Market, by End Use, 2023-2030 (US$ Bn)
TABLE 45 North America Metal Caps and Closures Market, by Country, 2017-2022 (US$ Bn)
TABLE 46 North America Metal Caps and Closures Market, by Country, 2023-2030 (US$ Bn)
TABLE 47 United States Metal Caps and Closures Market, by Material Type, 2017-2022 (US$ Bn)
TABLE 48 United States Metal Caps and Closures Market, by Material Type, 2023-2030 (US$ Bn)
TABLE 49 United States Metal Caps and Closures Market, by Production Process, 2017-2022 (US$ Bn)
TABLE 50 United States Metal Caps and Closures Market, by Production Process, 2023-2030 (US$ Bn)
TABLE 51 United States Metal Caps and Closures Market, by End Use, 2017-2022 (US$ Bn)
TABLE 52 United States Metal Caps and Closures Market, by End Use, 2023-2030 (US$ Bn)
TABLE 53 Canada Metal Caps and Closures Market, by Material Type, 2017-2022 (US$ Bn)
TABLE 54 Canada Metal Caps and Closures Market, by Material Type, 2023-2030 (US$ Bn)
TABLE 55 Canada Metal Caps and Closures Market, by Production Process, 2017-2022 (US$ Bn)
TABLE 56 Canada Metal Caps and Closures Market, by Production Process, 2023-2030 (US$ Bn)
TABLE 57 Canada Metal Caps and Closures Market, by End Use, 2017-2022 (US$ Bn)
TABLE 58 Canada Metal Caps and Closures Market, by End Use, 2023-2030 (US$ Bn)
TABLE 59 Mexico Metal Caps and Closures Market, by Material Type, 2017-2022 (US$ Bn)
TABLE 60 Mexico Metal Caps and Closures Market, by Material Type, 2023-2030 (US$ Bn)
TABLE 61 Mexico Metal Caps and Closures Market, by Production Process, 2017-2022 (US$ Bn)
TABLE 62 Mexico Metal Caps and Closures Market, by Production Process, 2023-2030 (US$ Bn)
TABLE 63 Mexico Metal Caps and Closures Market, by End Use, 2017-2022 (US$ Bn)
TABLE 64 Mexico Metal Caps and Closures Market, by End Use, 2023-2030 (US$ Bn)
TABLE 65 Europe Metal Caps and Closures Market, by Material Type, 2017-2022 (US$ Bn)
TABLE 66 Europe Metal Caps and Closures Market, by Material Type, 2023-2030 (US$ Bn)
TABLE 67 Europe Metal Caps and Closures Market, by Production Process, 2017-2022 (US$ Bn)
TABLE 68 Europe Metal Caps and Closures Market, by Production Process, 2023-2030 (US$ Bn)
TABLE 69 Europe Metal Caps and Closures Market, by End Use, 2017-2022 (US$ Bn)
TABLE 70 Europe Metal Caps and Closures Market, by End Use, 2023-2030 (US$ Bn)
TABLE 71 Europe Metal Caps and Closures Market, by Country, 2017-2022 (US$ Bn)
TABLE 72 Europe Metal Caps and Closures Market, by Country, 2023-2030 (US$ Bn)
TABLE 73 Germany Metal Caps and Closures Market, by Material Type, 2017-2022 (US$ Bn)
TABLE 74 Germany Metal Caps and Closures Market, by Material Type, 2023-2030 (US$ Bn)
TABLE 75 Germany Metal Caps and Closures Market, by Production Process, 2017-2022 (US$ Bn)
TABLE 76 Germany Metal Caps and Closures Market, by Production Process, 2023-2030 (US$ Bn)
TABLE 77 Germany Metal Caps and Closures Market, by End Use, 2017-2022 (US$ Bn)
TABLE 78 Germany Metal Caps and Closures Market, by End Use, 2023-2030 (US$ Bn)
TABLE 79 France Metal Caps and Closures Market, by Material Type, 2017-2022 (US$ Bn)
TABLE 80 France Metal Caps and Closures Market, by Material Type, 2023-2030 (US$ Bn)
TABLE 81 France Metal Caps and Closures Market, by Production Process, 2017-2022 (US$ Bn)
TABLE 82 France Metal Caps and Closures Market, by Production Process, 2023-2030 (US$ Bn)
TABLE 83 France Metal Caps and Closures Market, by End Use, 2017-2022 (US$ Bn)
TABLE 84 France Metal Caps and Closures Market, by End Use, 2023-2030 (US$ Bn)
TABLE 85 United Kingdom Metal Caps and Closures Market, by Material Type, 2017-2022 (US$ Bn)
TABLE 86 United Kingdom Metal Caps and Closures Market, by Material Type, 2023-2030 (US$ Bn)
TABLE 87 United Kingdom Metal Caps and Closures Market, by Production Process, 2017-2022 (US$ Bn)
TABLE 88 United Kingdom Metal Caps and Closures Market, by Production Process, 2023-2030 (US$ Bn)
TABLE 89 United Kingdom Metal Caps and Closures Market, by End Use, 2017-2022 (US$ Bn)
TABLE 90 United Kingdom Metal Caps and Closures Market, by End Use, 2023-2030 (US$ Bn)
TABLE 91 Italy Metal Caps and Closures Market, by Material Type, 2017-2022 (US$ Bn)
TABLE 92 Italy Metal Caps and Closures Market, by Material Type, 2023-2030 (US$ Bn)
TABLE 93 Italy Metal Caps and Closures Market, by Production Process, 2017-2022 (US$ Bn)
TABLE 94 Italy Metal Caps and Closures Market, by Production Process, 2023-2030 (US$ Bn)
TABLE 95 Italy Metal Caps and Closures Market, by End Use, 2017-2022 (US$ Bn)
TABLE 96 Italy Metal Caps and Closures Market, by End Use, 2023-2030 (US$ Bn)
TABLE 97 Spain Metal Caps and Closures Market, by Material Type, 2017-2022 (US$ Bn)
TABLE 98 Spain Metal Caps and Closures Market, by Material Type, 2023-2030 (US$ Bn)
TABLE 99 Spain Metal Caps and Closures Market, by Production Process, 2017-2022 (US$ Bn)
TABLE 100 Spain Metal Caps and Closures Market, by Production Process, 2023-2030 (US$ Bn)
TABLE 101 Spain Metal Caps and Closures Market, by End Use, 2017-2022 (US$ Bn)
TABLE 102 Spain Metal Caps and Closures Market, by End Use, 2023-2030 (US$ Bn)
TABLE 103 Rest of Europe Metal Caps and Closures Market, by Material Type, 2017-2022 (US$ Bn)
TABLE 104 Rest of Europe Metal Caps and Closures Market, by Material Type, 2023-2030 (US$ Bn)
TABLE 105 Rest of Europe Metal Caps and Closures Market, by Production Process, 2017-2022 (US$ Bn)
TABLE 106 Rest of Europe Metal Caps and Closures Market, by Production Process, 2023-2030 (US$ Bn)
TABLE 107 Rest of Europe Metal Caps and Closures Market, by End Use, 2017-2022 (US$ Bn)
TABLE 108 Rest of Europe Metal Caps and Closures Market, by End Use, 2023-2030 (US$ Bn)
TABLE 109 Asia Pacific Metal Caps and Closures Market, by Material Type, 2017-2022 (US$ Bn)
TABLE 110 Asia Pacific Metal Caps and Closures Market, by Material Type, 2023-2030 (US$ Bn)
TABLE 111 Asia Pacific Metal Caps and Closures Market, by Production Process, 2017-2022 (US$ Bn)
TABLE 112 Asia Pacific Metal Caps and Closures Market, by Production Process, 2023-2030 (US$ Bn)
TABLE 113 Asia Pacific Metal Caps and Closures Market, by End Use, 2017-2022 (US$ Bn)
TABLE 114 Asia Pacific Metal Caps and Closures Market, by End Use, 2023-2030 (US$ Bn)
TABLE 115 China Metal Caps and Closures Market, by Material Type, 2017-2022 (US$ Bn)
TABLE 116 China Metal Caps and Closures Market, by Material Type, 2023-2030 (US$ Bn)
TABLE 117 China Metal Caps and Closures Market, by Production Process, 2017-2022 (US$ Bn)
TABLE 118 China Metal Caps and Closures Market, by Production Process, 2023-2030 (US$ Bn)
TABLE 119 China Metal Caps and Closures Market, by End Use, 2017-2022 (US$ Bn)
TABLE 120 China Metal Caps and Closures Market, by End Use, 2023-2030 (US$ Bn)
TABLE 121 Japan Metal Caps and Closures Market, by Material Type, 2017-2022 (US$ Bn)
TABLE 122 Japan Metal Caps and Closures Market, by Material Type, 2023-2030 (US$ Bn)
TABLE 123 Japan Metal Caps and Closures Market, by Production Process, 2017-2022 (US$ Bn)
TABLE 124 Japan Metal Caps and Closures Market, by Production Process, 2023-2030 (US$ Bn)
TABLE 125 Japan Metal Caps and Closures Market, by End Use, 2017-2022 (US$ Bn)
TABLE 126 Japan Metal Caps and Closures Market, by End Use, 2023-2030 (US$ Bn)
TABLE 127 India Metal Caps and Closures Market, by Material Type, 2017-2022 (US$ Bn)
TABLE 128 India Metal Caps and Closures Market, by Material Type, 2023-2030 (US$ Bn)
TABLE 129 India Metal Caps and Closures Market, by Production Process, 2017-2022 (US$ Bn)
TABLE 130 India Metal Caps and Closures Market, by Production Process, 2023-2030 (US$ Bn)
TABLE 131 India Metal Caps and Closures Market, by End Use, 2017-2022 (US$ Bn)
TABLE 132 India Metal Caps and Closures Market, by End Use, 2023-2030 (US$ Bn)
TABLE 133 South Korea Metal Caps and Closures Market, by Material Type, 2017-2022 (US$ Bn)
TABLE 134 South Korea Metal Caps and Closures Market, by Material Type, 2023-2030 (US$ Bn)
TABLE 135 South Korea Metal Caps and Closures Market, by Production Process, 2017-2022 (US$ Bn)
TABLE 136 South Korea Metal Caps and Closures Market, by Production Process, 2023-2030 (US$ Bn)
TABLE 137 South Korea Metal Caps and Closures Market, by End Use, 2017-2022 (US$ Bn)
TABLE 138 South Korea Metal Caps and Closures Market, by End Use, 2023-2030 (US$ Bn)
TABLE 139 South-East Asia Metal Caps and Closures Market, by Material Type, 2017-2022 (US$ Bn)
TABLE 140 South-East Asia Metal Caps and Closures Market, by Material Type, 2023-2030 (US$ Bn)
TABLE 141 South-East Asia Metal Caps and Closures Market, by Production Process, 2017-2022 (US$ Bn)
TABLE 142 South-East Asia Metal Caps and Closures Market, by Production Process, 2023-2030 (US$ Bn)
TABLE 143 South-East Asia Metal Caps and Closures Market, by End Use, 2017-2022 (US$ Bn)
TABLE 144 South-East Asia Metal Caps and Closures Market, by End Use, 2023-2030 (US$ Bn)
TABLE 145 Rest of Asia Pacific Metal Caps and Closures Market, by Material Type, 2017-2022 (US$ Bn)
TABLE 146 Rest of Asia Pacific Metal Caps and Closures Market, by Material Type, 2023-2030 (US$ Bn)
TABLE 147 Rest of Asia Pacific Metal Caps and Closures Market, by Production Process, 2017-2022 (US$ Bn)
TABLE 148 Rest of Asia Pacific Metal Caps and Closures Market, by Production Process, 2023-2030 (US$ Bn)
TABLE 149 Rest of Asia Pacific Metal Caps and Closures Market, by End Use, 2017-2022 (US$ Bn)
TABLE 150 Rest of Asia Pacific Metal Caps and Closures Market, by End Use, 2023-2030 (US$ Bn)
TABLE 151 Latin America Metal Caps and Closures Market, by Material Type, 2017-2022 (US$ Bn)
TABLE 152 Latin America Metal Caps and Closures Market, by Material Type, 2023-2030 (US$ Bn)
TABLE 153 Latin America Metal Caps and Closures Market, by Production Process, 2017-2022 (US$ Bn)
TABLE 154 Latin America Metal Caps and Closures Market, by Production Process, 2023-2030 (US$ Bn)
TABLE 155 Latin America Metal Caps and Closures Market, by End Use, 2017-2022 (US$ Bn)
TABLE 156 Latin America Metal Caps and Closures Market, by End Use, 2023-2030 (US$ Bn)
TABLE 157 Brazil Metal Caps and Closures Market, by Material Type, 2017-2022 (US$ Bn)
TABLE 158 Brazil Metal Caps and Closures Market, by Material Type, 2023-2030 (US$ Bn)
TABLE 159 Brazil Metal Caps and Closures Market, by Production Process, 2017-2022 (US$ Bn)
TABLE 160 Brazil Metal Caps and Closures Market, by Production Process, 2023-2030 (US$ Bn)
TABLE 161 Brazil Metal Caps and Closures Market, by End Use, 2017-2022 (US$ Bn)
TABLE 162 Brazil Metal Caps and Closures Market, by End Use, 2023-2030 (US$ Bn)
TABLE 163 Argentina Metal Caps and Closures Market, by Material Type, 2017-2022 (US$ Bn)
TABLE 164 Argentina Metal Caps and Closures Market, by Material Type, 2023-2030 (US$ Bn)
TABLE 165 Argentina Metal Caps and Closures Market, by Production Process, 2017-2022 (US$ Bn)
TABLE 166 Argentina Metal Caps and Closures Market, by Production Process, 2023-2030 (US$ Bn)
TABLE 167 Argentina Metal Caps and Closures Market, by End Use, 2017-2022 (US$ Bn)
TABLE 168 Argentina Metal Caps and Closures Market, by End Use, 2023-2030 (US$ Bn)
TABLE 169 Rest of Latin America Metal Caps and Closures Market, by Material Type, 2017-2022 (US$ Bn)
TABLE 170 Rest of Latin America Metal Caps and Closures Market, by Material Type, 2023-2030 (US$ Bn)
TABLE 171 Rest of Latin America Metal Caps and Closures Market, by Production Process, 2017-2022 (US$ Bn)
TABLE 172 Rest of Latin America Metal Caps and Closures Market, by Production Process, 2023-2030 (US$ Bn)
TABLE 173 Rest of Latin America Metal Caps and Closures Market, by End Use, 2017-2022 (US$ Bn)
TABLE 174 Rest of Latin America Metal Caps and Closures Market, by End Use, 2023-2030 (US$ Bn)
TABLE 175 Middle East and Africa Metal Caps and Closures Market, by Material Type, 2017-2022 (US$ Bn)
TABLE 176 Middle East and Africa Metal Caps and Closures Market, by Material Type, 2023-2030 (US$ Bn)
TABLE 177 Middle East and Africa Metal Caps and Closures Market, by Production Process, 2017-2022 (US$ Bn)
TABLE 178 Middle East and Africa Metal Caps and Closures Market, by Production Process, 2023-2030 (US$ Bn)
TABLE 179 Middle East and Africa Metal Caps and Closures Market, by End Use, 2017-2022 (US$ Bn)
TABLE 180 Middle East and Africa Metal Caps and Closures Market, by End Use, 2023-2030 (US$ Bn)
TABLE 181 GCC Countries Metal Caps and Closures Market, by Material Type, 2017-2022 (US$ Bn)
TABLE 182 GCC Countries Metal Caps and Closures Market, by Material Type, 2023-2030 (US$ Bn)
TABLE 183 GCC Countries Metal Caps and Closures Market, by Production Process, 2017-2022 (US$ Bn)
TABLE 184 GCC Countries Metal Caps and Closures Market, by Production Process, 2023-2030 (US$ Bn)
TABLE 185 GCC Countries Metal Caps and Closures Market, by End Use, 2017-2022 (US$ Bn)
TABLE 186 GCC Countries Metal Caps and Closures Market, by End Use, 2023-2030 (US$ Bn)
TABLE 187 South Africa Metal Caps and Closures Market, by Material Type, 2017-2022 (US$ Bn)
TABLE 188 South Africa Metal Caps and Closures Market, by Material Type, 2023-2030 (US$ Bn)
TABLE 189 South Africa Metal Caps and Closures Market, by Production Process, 2017-2022 (US$ Bn)
TABLE 190 South Africa Metal Caps and Closures Market, by Production Process, 2023-2030 (US$ Bn)
TABLE 191 South Africa Metal Caps and Closures Market, by End Use, 2017-2022 (US$ Bn)
TABLE 192 South Africa Metal Caps and Closures Market, by End Use, 2023-2030 (US$ Bn)
TABLE 193 Rest of Middle East and Africa Metal Caps and Closures Market, by Material Type, 2017-2022 (US$ Bn)
TABLE 194 Rest of Middle East and Africa Metal Caps and Closures Market, by Material Type, 2023-2030 (US$ Bn)
TABLE 195 Rest of Middle East and Africa Metal Caps and Closures Market, by Production Process, 2017-2022 (US$ Bn)
TABLE 196 Rest of Middle East and Africa Metal Caps and Closures Market, by Production Process, 2023-2030 (US$ Bn)
TABLE 197 Rest of Middle East and Africa Metal Caps and Closures Market, by End Use, 2017-2022 (US$ Bn)
TABLE 198 Rest of Middle East and Africa Metal Caps and Closures Market, by End Use, 2023-2030 (US$ Bn)

Frequently Asked Questions

What is the current size of the global metal caps and closures market?

The global metal caps and closures market was valued at USD 1.1 Billion in 2022.

What is the expected growth rate of the metal caps and closures market between 2023 and 2030?

The metal caps and closures market is expected to grow at a CAGR of 2.20% between 2023 and 2030, reaching USD 1.3 Billion in 2030.

Which segment is leading the market share in terms of product?

Aluminum category is the leading segment by product, holding over 27% share in terms of value in 2022.

Which production process segment governs the demand for metal caps and closures in the world?

The compression molding segment governs the demand for metal caps and closures in the world, holding a massive share of over 52% in 2022.

Which end use segment is expected to post the highest CAGR during the forecast period?

The food & beverage segment is expected to post the highest CAGR during the forecast period.

Which region is fueling the growth of the metal caps and closures industry?

Asia Pacific is fueling the growth of the metal caps and closures industry, with over one-third share in 2022.

Who are the major players in the global metal caps and closures market?

The top players include Crown Holdings Inc., O.Berk Company, Reynolds Packaging Group Ltd, Pelliconi & C. SpA, Nippon Closures Co. Ltd, Silgan White Cap, Sks Bottle & Packaging Inc., Amcor PLC, Berlin Packaging (Qorpak), Shadong Lipeng Co. Ltd and Rauh GmbH & Co. Blechwarenfabrikations-KG.

What are the major market drivers of the metal caps and closures industry?

Due to growth-promoting factors like rising demand from the food and beverage industry as a result of its protective qualities, the market for metal caps and closures is expanding at a rapid rate.

What are the major market restraints of the metal caps and closures industry?

The market expansion for metal caps and closures is anticipated to be hampered by the availability of less expensive alternative caps and closures.

What are the major market opportunities of the metal caps and closures industry?

The demand for metal caps and closures is projected to increase in the next years as the personal care industry increasingly uses them due to their special features that improve shelf life.

Powder Coating Market

Published:
Report ID: 10783

Masterbatch Market

Published:
Report ID: 37059

Polycrystalline CVD Diamond Market

Published:
Report ID: 37009

Middle East and Africa Masterbatch Market

Published:
Report ID: 36966

Ferrous Slag Market

Published:
Report ID: 6261

Surfactants Market

Published:
Report ID: 10221

Graphite Market

Published:
Report ID: 6554

Saudi Arabia Plastic Products Market

Published:
Report ID: 36905

Copper Oxychloride Market

Published:
Report ID: 12415

India Oilfield Services Market

Published:
Report ID: 36781

Collagen Market

Published:
Report ID: 36725

Isostearic Acid Market

Published:
Report ID: 7580

Purchase Options

$2999
Delivery Format: Excel.
$4999
Designed for the individual purchaser.
$6999
Users located at a single corporate site or regional office.
$7999
Allowed for unlimited sharing globally within one company.
Smallform of Sample request

Have a question?

User Profile

Don’t settle for less – trust Mitul to help you find the best solution.

Report delivery within 24 to 48 hours

– Other Info –

What people say?-

User Review

I am very impressed with the information in this report. The author clearly did their research when they came up with this product and it has already given me a lot of ideas.

Jana Schmidt
CEDAR CX Technologies

– Connect with us –

Phone

+91 6232 49 3207


support

24/7 Research Support


sales@credenceresearch.com

– Research Methodology –

Going beyond the basics: advanced techniques in research methodology

– Trusted By –

Pepshi, LG, Nestle
Motorola, Honeywell, Johnson and johnson
LG Chem, SIEMENS, Pfizer
Unilever, Samsonite, QIAGEN