
Investment Banking And Trading Services Market Overview:
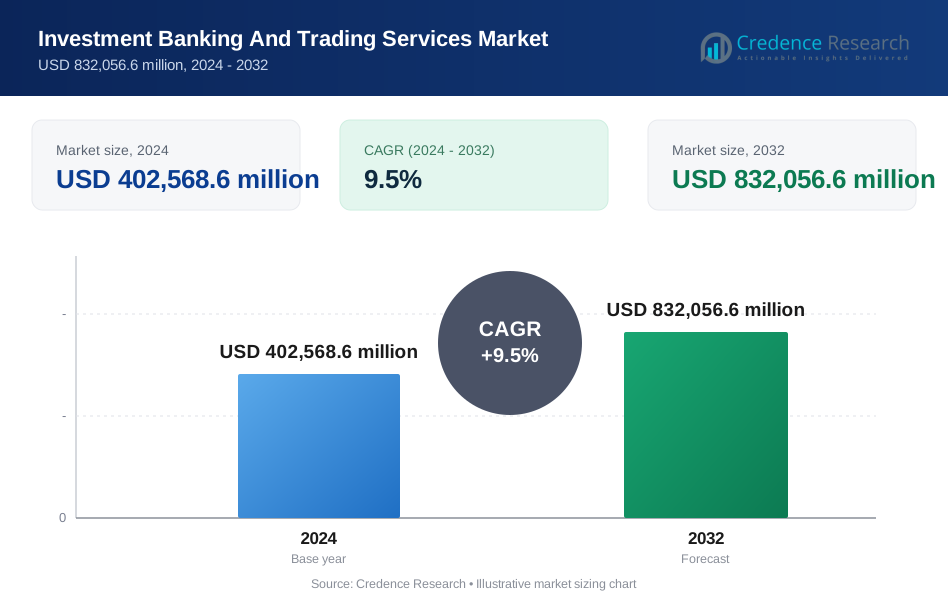
Investment Banking And Trading Services Market size was valued USD 402568.6 million in 2024 and is anticipated to reach USD 832056.6 million by 2032, at a CAGR of 9.5% during the forecast period.
| REPORT ATTRIBUTE | DETAILS |
|---|---|
| Historical Period | 2020-2023 |
| Base Year | 2024 |
| Forecast Period | 2025-2032 |
| Investment Banking And Trading Services Market Size 2024 | USD 402568.6 million |
| Investment Banking And Trading Services Market, CAGR | 9.5% |
| Investment Banking And Trading Services Market Size 2032 | USD 832056.6 million |
Investment Banking And Trading Services Market Insights
- Market growth is primarily driven by increased market volatility, expanding corporate financing needs, and strong demand for advisory, derivatives, and risk-hedging services, with electronic and algorithmic trading emerging as the dominant segment due to speed, scalability, and cost efficiency.
- Key market trends include rapid adoption of AI-driven analytics, cloud-based trading platforms, straight-through processing, and growing integration of ESG-linked financial products within trading and advisory services.
- The competitive landscape is shaped by large, globally integrated players competing on scale, balance-sheet strength, technology investment, global reach, and the ability to execute complex cross-border transactions efficiently.
- Regionally, North America leads with an exact 41% market share, supported by deep capital markets and institutional participation, while Europe and Asia-Pacific follow with strong fixed-income, FX, and equity trading activity, despite regulatory complexity and margin pressure acting as key market restraints.
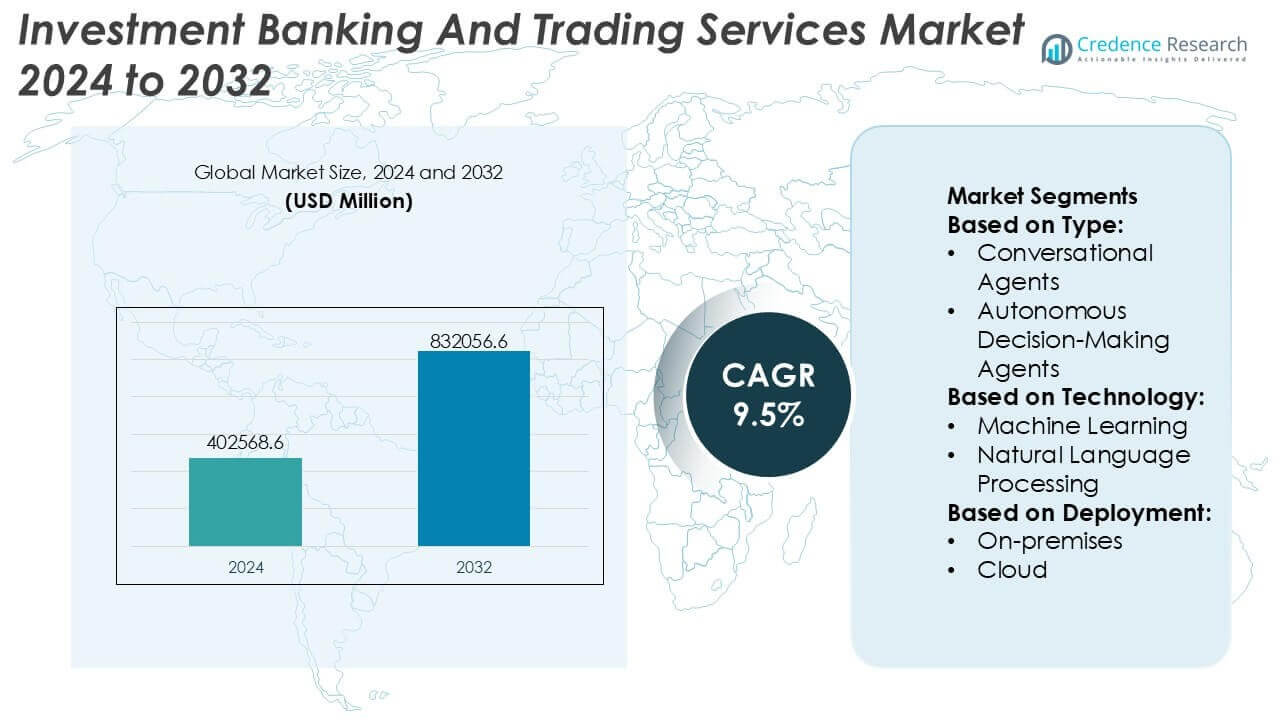
Investment Banking And Trading Services Market Segmentation Analysis:
By Type
By type, Predictive Analytics Agents emerge as the dominant sub-segment, accounting for an estimated 34% market share in the investment banking and trading services market. Their leadership is driven by strong demand for data-driven forecasting, algorithmic trading optimization, and real-time risk assessment across equities, fixed income, and derivatives desks. These agents leverage large historical and streaming datasets to identify price patterns, volatility signals, and liquidity shifts with high precision. While conversational agents enhance client advisory and autonomous decision-making agents support execution strategies, predictive analytics agents remain central to revenue generation, portfolio optimization, and proactive risk mitigation.
- For instance, HP Inc. expanded its Workforce Experience Platform (WXP) globally, leveraging an AI-driven engine that processes 1.9 TB of telemetry data daily from over 48 million endpoints.
By Technology
By technology, Machine Learning holds the largest share at approximately 36%, driven by its broad applicability across trading models, credit scoring, fraud detection, and market surveillance. Supervised and unsupervised learning techniques enable continuous model refinement as market conditions evolve, improving alpha generation and reducing model drift. Natural language processing supports sentiment analysis from earnings calls and news, while reinforcement learning advances execution strategies. However, machine learning remains dominant due to its scalability, proven performance in structured financial data, and seamless integration with quantitative research, back-testing frameworks, and real-time trading infrastructure.
- For instance, Aryaka Networks, Inc. introduced AI>Observe in its Winter ’25 Unified SASE as a Service release, leveraging hundreds of machine-learning models to deliver real-time detection of anomalous network behavior and advanced threat analytics across its global private SD-WAN and SASE infrastructure, which spans 40+ Points of Presence worldwide and secures enterprise connectivity with enterprise-grade encryption and zero-trust principles.
By Deployment
By deployment, Cloud-based solutions dominate with nearly 58% market share, reflecting the sector’s shift toward scalable, flexible, and cost-efficient infrastructure. Cloud deployment enables rapid model training, high-frequency data processing, and global access to advanced AI capabilities without heavy capital expenditure. Investment banks increasingly rely on cloud platforms to support burst computing for stress testing, scenario analysis, and intraday risk calculations. While on-premises deployment remains relevant for latency-sensitive trading and strict regulatory environments, cloud adoption continues to accelerate due to faster innovation cycles, improved security architectures, and regulatory acceptance across major financial hubs.
Investment Banking And Trading Services Market Overview
Key Growth Drivers
- Digital Transformation and AI-Led Automation
Investment banking and trading services are accelerating digital transformation to enhance speed, accuracy, and scalability across front-, middle-, and back-office operations. Advanced analytics, machine learning, and algorithmic trading platforms improve price discovery, execution quality, and risk management while reducing operational costs. Cloud-native architectures enable elastic computing for high-frequency trading and stress testing, while straight-through processing shortens settlement cycles. Automation across compliance, reporting, and reconciliation further improves efficiency, enabling institutions to redeploy capital and talent toward higher-margin advisory, structuring, and client-centric trading strategies.
- For instance, Cisco Systems, Inc. introduced its Cisco AI-Ready Data Center portfolio, including the Cisco N9100 Series switch with NVIDIA Spectrum-X integration, which can handle aggregate data flows exceeding 800 Tbps in AI-centric deployments and supports low-latency networking for distributed AI workloads across multi-site infrastructures, as documented in Cisco’s press release on secure, scalable AI networking innovations.
- Rising Market Volatility and Trading Volumes
Persistent macroeconomic uncertainty, shifting interest-rate regimes, geopolitical tensions, and commodity price swings are driving higher trading activity across asset classes. Increased volatility boosts demand for market-making, derivatives, structured products, and hedging solutions from institutional and corporate clients. Active portfolio rebalancing by asset managers and sovereign funds supports volumes in equities, fixed income, FX, and commodities. As clients seek liquidity and risk transfer, banks with strong balance sheets, advanced analytics, and diversified trading capabilities capture higher fee income and spread-based revenues.
- For instance, HCL Technologies Limited has expanded its AI Force suite, which integrates GenAI and machine-learning capabilities across enterprise systems to automate IT operations, reduces report summarization workloads by 44% in deployment scenarios, and accelerates time-to-insight in analytics workflows for global clients figures highlighted in HCLTech’s official AI solutions documentation.
- Growth in Capital Markets and Corporate Financing Needs
Expanding capital requirements for infrastructure, energy transition, technology, and cross-border expansion are strengthening demand for underwriting, advisory, and structured finance services. Corporates increasingly access public and private markets for equity, debt, and hybrid instruments, while sponsors pursue M&A, carve-outs, and leveraged transactions. Complex deal structures, regulatory scrutiny, and valuation uncertainty elevate the role of investment banks as strategic advisors. This sustained financing activity underpins fee growth across equity capital markets, debt capital markets, and mergers and acquisitions.
Key Trends & Opportunities
- Expansion of Electronic and Algorithmic Trading
Electronic execution continues to gain share across traditionally voice-dominated markets, including fixed income and derivatives. Algorithmic strategies optimize order routing, minimize market impact, and improve execution consistency. Enhanced pre- and post-trade analytics provide transparency on transaction costs and liquidity conditions, strengthening client trust. Banks that invest in low-latency infrastructure and data-driven execution tools can differentiate through superior performance, deeper liquidity access, and scalable multi-asset trading platforms.
- For instance, Broadcom has advanced its networking portfolio with the introduction of the Tomahawk 6 (102.4 Tbps) and Tomahawk Ultra (51.2 Tbps) switch ASICs. These multi-terabit solutions are engineered for ultra-low latency and high throughput, supporting up to 800 Gbps per port and enabling sub-microsecond packet forwarding speeds critical for real-time electronic trading and large-scale AI data transport.
- Growth of Sustainable Finance and ESG-Linked Products
Client demand for sustainable investing is driving innovation in green bonds, sustainability-linked loans, ESG derivatives, and carbon-related instruments. Investment banks are integrating ESG analytics into research, capital allocation, and risk frameworks to support compliant product structuring and reporting. Advisory mandates linked to decarbonization, transition financing, and impact investing create new revenue pools. Firms that combine credible ESG expertise with robust data and disclosure capabilities can capture long-term client relationships and differentiated deal flow.
- For instance, DXC Technology Company has launched its AdvisoryX global advisory and consulting group, backed by primary research surveying 2,496 enterprise leaders to reveal that 94 % of organizations face significant challenges deploying AI at scale.
- Rise of Private Markets and Hybrid Capital Solutions
Private credit, private equity, and hybrid financing are expanding as issuers seek flexible capital outside public markets. Banks are bridging public and private markets by structuring bespoke solutions, syndicating risk, and distributing assets to institutional investors. This trend creates opportunities in origination, placement, valuation, and secondary liquidity solutions. Integrated platforms that connect advisory, financing, and distribution are well positioned to monetize growing private market activity.
Key Challenges
- Regulatory Complexity and Compliance Costs
Investment banking and trading services operate under stringent and evolving regulatory frameworks covering capital adequacy, conduct, market transparency, and data governance. Compliance requirements increase reporting burdens, technology spend, and operational complexity, compressing margins. Divergent regional regulations complicate cross-border trading and capital allocation. Firms must continuously invest in compliance automation, governance, and controls while maintaining agility to adapt to policy changes without disrupting client service or trading performance.
- Margin Pressure and Intensifying Competition
Heightened competition from global banks, non-bank liquidity providers, and fintech platforms is pressuring spreads and advisory fees. Greater price transparency and client sophistication reduce switching costs, while electronic trading commoditizes execution. Rising technology and talent costs further strain profitability. To sustain margins, firms must scale efficiently, focus on differentiated advisory and complex products, and leverage data, analytics, and client insights to deliver measurable value beyond price competition.
Regional Analysis
North America
North America dominates the Investment Banking and Trading Services Market, accounting for approximately 41% market share, supported by deep capital markets, high institutional participation, and advanced trading infrastructure. The United States leads regional activity due to strong equity and derivatives markets, high-frequency trading adoption, and consistent deal flow in M&A and capital raising. Large asset managers, hedge funds, and corporates sustain demand for sophisticated trading, risk management, and advisory services. Continuous investment in AI-driven analytics, electronic trading platforms, and regulatory technology further strengthens North America’s leadership position.
Europe
Europe represents around 28% of the global market share, driven by diversified financial hubs such as London, Frankfurt, Paris, and Zurich. The region benefits from strong cross-border advisory activity, active fixed-income and FX trading, and a growing focus on sustainable finance instruments. Regulatory harmonization initiatives and transparency requirements shape trading models, increasing reliance on electronic platforms and compliance automation. Despite macroeconomic uncertainty, steady issuance of sovereign and corporate debt, along with restructuring and advisory mandates, continues to support investment banking and trading revenues across the region.
Asia-Pacific
Asia-Pacific holds approximately 23% market share and remains the fastest-growing regional market. Expansion is fueled by rising capital market participation in China, India, Japan, and Southeast Asia, alongside increasing cross-border investment flows. Growing IPO activity, infrastructure financing, and corporate deleveraging drive advisory demand, while rising retail and institutional trading volumes support execution services. Rapid adoption of digital trading platforms, coupled with regulatory modernization, enhances market access. Global banks continue expanding regional footprints to capture long-term growth from emerging capital markets.
Latin America
Latin America accounts for about 5% of the global market share, supported by selective capital markets activity in Brazil, Mexico, Chile, and Colombia. Demand centers on debt issuance, sovereign financing, and risk-hedging solutions amid currency and interest-rate volatility. Trading services benefit from active FX and commodities exposure, particularly linked to energy and agricultural exports. While market depth remains limited compared to developed regions, regulatory reforms and gradual digitalization are improving transparency and execution efficiency, creating incremental opportunities for regional and international investment banks.
Middle East & Africa
The Middle East & Africa region captures roughly 3% market share, driven by strong sovereign wealth activity, infrastructure financing, and energy-related capital markets. Gulf Cooperation Council countries lead regional growth through IPOs, sukuk issuance, and large-scale project financing aligned with economic diversification agendas. Trading activity is concentrated in equities, FX, and commodities, supported by rising institutional participation. Although market liquidity varies widely across countries, ongoing financial market reforms and foreign investment liberalization are steadily expanding the role of investment banking and trading services.
Investment Banking And Trading Services Market Segmentations:
By Type:
- Conversational Agents
- Autonomous Decision-Making Agents
By Technology:
- Machine Learning
- Natural Language Processing
By Deployment:
- On-premises
- Cloud
By Geography
- North America
- U.S.
- Canada
- Mexico
- Europe
- Germany
- France
- U.K.
- Italy
- Spain
- Rest of Europe
- Asia Pacific
- China
- Japan
- India
- South Korea
- South-east Asia
- Rest of Asia Pacific
- Latin America
- Brazil
- Argentina
- Rest of Latin America
- Middle East & Africa
- GCC Countries
- South Africa
- Rest of the Middle East and Africa
Competitive Landscape
The competitive landscape of the Investment Banking and Trading Services Market players such as Fujitsu, Accenture, HP Development Company, L.P., ARYAKA NETWORKS, INC., Cisco Systems, Inc., HCL Technologies Limited, Broadcom, DXC Technology Company, Atera Networks Ltd., AT&T Inc., BMC Software, Inc. the Investment Banking and Trading Services Market is highly technology-driven, with competition centered on execution efficiency, risk management sophistication, and regulatory compliance capabilities rather than balance-sheet scale alone. Market participants compete by deploying advanced analytics, low-latency trading infrastructure, and automated post-trade processing to improve speed, accuracy, and cost efficiency. Cloud-based platforms and API-enabled architectures are increasingly used to support scalability and rapid product innovation, while cybersecurity and data governance remain critical differentiators. Intense pricing pressure and rising client expectations are pushing firms to invest continuously in digital transformation, straight-through processing, and AI-driven decision support, reinforcing a shift toward technology-led competitive advantage.
Key Player Analysis
- Fujitsu
- Accenture
- HP Development Company, L.P.
- ARYAKA NETWORKS, INC.
- Cisco Systems, Inc.
- HCL Technologies Limited
- Broadcom
- DXC Technology Company
- Atera Networks Ltd.
- AT&T Inc.
- BMC Software, Inc.
Recent Developments
- In December 2025, SecurityPal AI launched its new Concierge Agents, starting with "Libby," the Knowledge Librarian, an AI designed to function as a 24/7, time-zone-agnostic extension for security, compliance, and go-to-market (GTM) teams, automating tasks like questionnaire filling and providing instant assurance support via Slack, Teams, email, and their platform.
- In June 2025, SAP Fioneer announced its AI Agent for financial services institutions. The first release of the Fioneer AI Agent lays the foundation for banks and insurers to automate processes, gain real-time insights, and make smarter decisions. It uses natural language to enhance decision-making without sharing data externally.
- In June 2024, HSBC WorldTrader became available to eligible customers in the UAE. Following its initial rollout, the platform was intended for future launch in select markets across Asia and the Middle East, though the United States was not part of this initial expansion plan.
Report Coverage
The research report offers an in-depth analysis based on Type, Technology, Deployment and Geography. It details leading market players, providing an overview of their business, product offerings, investments, revenue streams, and key applications. Additionally, the report includes insights into the competitive environment, SWOT analysis, current market trends, as well as the primary drivers and constraints. Furthermore, it discusses various factors that have driven market expansion in recent years. The report also explores market dynamics, regulatory scenarios, and technological advancements that are shaping the industry. It assesses the impact of external factors and global economic changes on market growth. Lastly, it provides strategic recommendations for new entrants and established companies to navigate the complexities of the market.
Future Outlook
- Artificial intelligence and advanced analytics will become core to trading, risk management, and client advisory workflows.
- Electronic and algorithmic trading will continue expanding across asset classes, improving execution speed and transparency.
- Cloud-native and hybrid IT architectures will gain wider adoption to support scalability, resilience, and cost efficiency.
- Demand for sophisticated risk-hedging and derivatives solutions will rise amid ongoing market volatility.
- Sustainable finance and ESG-linked products will generate new advisory and structuring opportunities.
- Private markets and hybrid capital solutions will increasingly complement traditional public market activities.
- Regulatory technology adoption will accelerate to manage compliance complexity and reporting obligations.
- Client expectations will shift toward more personalized, data-driven insights and real-time market access.
- Cross-border capital flows will strengthen the need for integrated global trading and advisory platforms.
- Competitive differentiation will increasingly depend on technology innovation, operational efficiency, and strategic partnerships.
Request a Free Sample
Fill in your details and we'll send you a free sample report.
- Sample data tables & charts
- Research methodology
Need a Custom Version of This Report?
Tailor the scope, geography, or segments to your exact requirements.
- Custom geography or segment scope
- Direct access to our analyst team
Frequently Asked Questions
What is the current market size for the Investment Banking And Trading Services Market, and what is its projected size in 2032?
At what Compound Annual Growth Rate is the Investment Banking And Trading Services Market projected to grow between 2024 and 2032?
Which Investment Banking And Trading Services Market segment held the largest share in 2024?
What are the primary factors fueling the growth of the Investment Banking And Trading Services Market?
Who are the leading companies in the Investment Banking And Trading Services Market?
Which region commanded the largest share of the Investment Banking And Trading Services Market in 2024?
Table of Content
Chapter 1. Report Introduction
- 1.1 Report Description & Purpose
- 1.1.1 Report Title & Market Definition
- 1.1.2 Unique Selling Propositions (USP) & Key Differentiators
- 1.1.3 Value Proposition for Stakeholders
- 1.2 Research Objectives
- 1.2.1 Market Sizing Objectives (Volume & Revenue)
- 1.2.2 Segmentation Objectives
- 1.2.3 Competitive Intelligence Objectives
- 1.2.4 Forecast & Scenario Objectives
- 1.3 Report Scope
- 1.3.1 Investment Banking And Trading Services Scope – Types & Subtypes Covered
- 1.3.2 Geographic Scope – Regions & Countries Covered
- 1.3.3 Historical Period, Base Year & Forecast Period (2024; forecast to 2032)
- 1.3.4 Inclusions & Exclusions
- 1.4 HS Code & Classification Framework
- 1.5 Currency, Units & Pricing Basis
- 1.6 Target Stakeholders
- 1.7 Limitations & Assumptions
Chapter 2. Executive Summary
- 2.1 Global Investment Banking And Trading Services Market Snapshot
- 2.1.1 Market Size – Historical (2024) & Forecast (2024-2032) (2024: USD 402,568.6 million → 2032: USD 832,056.6 million)
- 2.1.2 Volume & Revenue – Global Totals
- 2.1.3 Key Market Highlights – Top Five Facts
- 2.2 Investment Banking And Trading Services Market Segmentation Snapshot
- 2.2.1 Market Split by Region – 2024 vs. 2032
- 2.3 Competitive Snapshot
- 2.3.1 Top 10 Players by Revenue Share – 2024
- 2.3.2 Top 10 Players by Volume Share – 2024
- 2.3.3 Recent Strategic Developments (18-Month Summary)
- 2.4 Key Investment Highlights & Strategic Conclusions
Chapter 3. Investment Banking And Trading Services Market Dynamics & Industry Analysis
- 3.1 Market Overview & Context
- 3.1.1 Investment Banking And Trading Services Market Position in the Broader Automotive Value Chain
- 3.1.2 OEM vs. Replacement Market Dynamics
- 3.1.3 Market Maturity & Development Stage by Region
- 3.2 Investment Banking And Trading Services Market Drivers
- 3.3 Investment Banking And Trading Services Market Restraints & Challenges
- 3.4 Investment Banking And Trading Services Market Opportunities
- 3.5 Porter's Five Forces Analysis
- 3.5.1 Threat of New Entrants
- 3.5.2 Bargaining Power of Suppliers
- 3.5.3 Bargaining Power of Buyers
- 3.5.4 Threat of Substitutes
- 3.5.5 Competitive Rivalry – Intensity Assessment
- 3.6 Investment Banking And Trading Services Value Chain Analysis
- 3.6.1 Upstream – Raw Material/Input Suppliers
- 3.6.1.1 Raw Material/Input 1
- 3.6.1.2 Raw Material/Input 2
- 3.6.1.3 Raw Material/Input 3
- 3.6.2 Midstream – Production/Manufacturing/Service Delivery
- 3.6.2.1 Production/Process Overview
- 3.6.2.2 Key Facility Locations & Capacity by Manufacturer
- 3.6.3 Downstream – Distribution & End Consumer
- 3.6.3.1 Primary Channel – B2B/OEM
- 3.6.3.2 Secondary Channels – Dealer, Retail, Online, Direct
- 3.6.4 Value Chain Profitability Analysis
- 3.6.1 Upstream – Raw Material/Input Suppliers
- 3.7 PESTEL Analysis
- 3.7.1 Political Factors
- 3.7.2 Economic Factors
- 3.7.3 Social Factors
- 3.7.4 Technological Factors
- 3.7.5 Environmental Factors
- 3.7.6 Legal Factors
- 3.8 Investment Banking And Trading Services Supply Chain Analysis
- 3.8.1 Raw Material/Input Supply Risk Assessment
- 3.8.2 Manufacturing Concentration Risk (Geographic Exposure)
- 3.8.3 Trade Disruption Impact Analysis
- 3.9 Regulatory & Policy Landscape
Note: The regulatory and policy landscape section covers regulations based on their applicability to the market, Investment Banking And Trading Services category, geography, and scope of the study. Only regulatory frameworks with a material impact on operations, compliance, trade, sustainability, or market access are analyzed in detail.
Chapter 4. Key Investment Pockets & Opportunity Analysis
- 4.1 Investment Banking And Trading Services Market Attractiveness Analysis
- 4.1.1 By Region – Investment Attractiveness Matrix (Volume × CAGR)
- 4.2 Absolute Revenue Growth Opportunity
- 4.2.1 By Region – Absolute USD Growth Through 2032
- 4.3 Incremental Volume Opportunity
- 4.3.1 By Region – Incremental Volume Through 2032
- 4.3.2 Segment – Incremental Volume
- 4.4 Emerging Submarket Opportunity Deep Dive (Subject to Applicability)
- 4.5 Emerging Market Opportunity Scorecards
- 4.5.1 United States
- 4.5.2 Europe
- 4.5.3 Asia
- 4.5.4 Middle East & Africa
Note: Emerging Market Opportunity Scorecards will be included based on relevance and strategic importance. Regions listed are indicative and may vary depending on data availability and market dynamics.
Chapter 5. Investment Banking And Trading Services Import-Export Analysis & Trade Flows
- 5.1 Global Trade Overview
- 5.1.1 Global Export Value by Country (2024)
- 5.1.2 Global Export Volume by Country (2024)
- 5.1.3 Global Import Value by Country (2024)
- 5.1.4 Global Import Volume by Country (2024)
- 5.1.5 Net Trade Balance by Country (2024)
- 5.2 Export Analysis – Segment
- 5.2.1 Type 1 (HS Code)
- 5.2.2 Type 2 (HS Code)
- 5.2.3 Type 3 (HS Code)
- 5.2.4 Type 4 (HS Code)
- 5.2.5 Type 5 (HS Code)
- 5.3 Import Analysis – Segment
- 5.3.1 Type 1 (HS Code)
- 5.3.2 Type 2 (HS Code)
- 5.3.3 Type 3 (HS Code)
- 5.3.4 Type 4 (HS Code)
- 5.3.5 Type 5 (HS Code)
- 5.4 Average Unit Trade Prices
- 5.4.1 Average Export Price – Segment & Country
- 5.4.2 Average Import Price – Segment & Source Country
- 5.4.3 Price Trends (2024)
- 5.5 Key Trade Route Analysis
- 5.5.1 Trade Route 1
- 5.5.2 Trade Route 2
- 5.5.3 Trade Route 3
- 5.5.4 Trade Route 4
- 5.5.5 Trade Route 5
- 5.6 Trade Policy Impact Assessment
- 5.6.1 US Anti-Dumping & Section 301 Tariffs
- 5.6.2 EU Customs Union Impact
- 5.6.3 Major Free Trade Agreements
- 5.6.4 USMCA Rules of Origin
Note: Trade policy analysis will be included only where relevant to the Investment Banking And Trading Services market.
Chapter 6. Competitive Landscape & Company Benchmarking
- 6.1 Investment Banking And Trading Services Market Concentration & Structure
- 6.1.1 Herfindahl-Hirschman Index (HHI) – vs. 2024
- 6.1.2 Tier 1, Tier 2 & Tier 3 Market Structure
- 6.1.3 Global, Regional & Local Player Dynamics
- 6.2 Investment Banking And Trading Services Market Share Analysis – 2024
- 6.2.1 Global Revenue Share by Company
- 6.2.2 Global Volume Share by Company
- 6.2.3 Regional Revenue Share
- 6.2.4 Market Share Evolution ( vs. 2024)
- 6.2.5 OEM Segment Share by Company
- 6.2.6 Replacement Segment Share by Company
- 6.3 Production/Delivery Capacity & Facility Analysis
- 6.3.1 Global Installed Capacity
- 6.3.2 Capacity Utilization Rates
- 6.3.3 Production/Output Volume
- 6.3.4 Facility Locations & Capacity Map
- 6.3.5 Planned Capacity Additions
- 6.4 Investment Banking And Trading Services Competitive Benchmarking Matrix
- 6.4.1 Revenue, Volume, CAGR & Profitability Comparison
- 6.4.2 Channel Revenue Mix
- 6.4.3 Geographic Revenue Exposure
- 6.4.4 R&D Intensity
- 6.4.5 Sustainability Maturity
- 6.5 Strategic Developments in Investment Banking And Trading Services (Last 24 Months)
- 6.5.1 Mergers, Acquisitions & Divestments
- 6.5.2 New Investment Banking And Trading Services Launches
- 6.5.3 Facility Expansions
- 6.5.4 Strategic Alliances, Joint Ventures & Partnerships
- 6.5.5 Distribution Expansion & Market Entry
- 6.5.6 Sustainability & ESG Initiatives
- 6.6 Competitive Strategy Mapping
- 6.6.1 Leader, Challenger, Follower & Niche Classification
- 6.6.2 Pricing Strategy Comparison
- 6.6.3 Channel Strategy Matrix
Note: Strategic developments are included based on their materiality and the availability of reliable information.
Chapter 7. Global Investment Banking And Trading Services Market – By Distribution Channel
- 7.1 Segment Overview
- 7.1.1 Volume & Revenue Split by Channel (2024 & 2032)
- 7.1.2 Channel Mix Evolution (2024-2032)
Chapter 8. Regional Market Analysis – Global Overview
- 8.1 Global Regional Overview
- 8.1.1 Regional Volume Share
- 8.1.2 Regional Revenue Share
- 8.1.3 Regional Volume by Region
- 8.1.4 Regional Revenue by Region
- 8.1.5 Regional Forecast Through 2032
- 8.2 Cross-Regional Segment Analysis
- 8.2.1 By Distribution Channel
- 8.2.2 By Brand/Price Tier
Chapter 9. North America Investment Banking And Trading Services Market
- 9.1 United States
- 9.2 Canada
- 9.3 Mexico
Chapter 10. Europe Investment Banking And Trading Services Market
- 10.1 Germany
- 10.2 France
- 10.3 Italy
- 10.4 United Kingdom
- 10.5 Spain
- 10.6 Poland
- 10.7 Russia
- 10.8 Netherlands
- 10.9 Belgium
- 10.10 Sweden
- 10.11 Denmark
- 10.12 Norway
- 10.13 Rest of Europe
Chapter 11. Asia Pacific Investment Banking And Trading Services Market
- 11.1 China
- 11.2 India
- 11.3 Japan
- 11.4 South Korea
- 11.5 Thailand
- 11.6 Indonesia
- 11.7 Vietnam
- 11.8 Malaysia
- 11.9 Australia
- 11.10 Rest of Asia Pacific
Chapter 12. Latin America Investment Banking And Trading Services Market
- 12.1 Brazil
- 12.2 Argentina
- 12.3 Colombia
- 12.4 Chile
- 12.5 Rest of Latin America
Chapter 13. Middle East Investment Banking And Trading Services Market
- 13.1 Saudi Arabia
- 13.2 United Arab Emirates
- 13.3 Turkey
- 13.4 Israel
- 13.5 Iran
- 13.6 Rest of the Middle East
Chapter 14. Africa Investment Banking And Trading Services Market
- 14.1 South Africa
- 14.2 Egypt
- 14.3 Nigeria
- 14.4 Morocco
- 14.5 Rest of Africa
Chapter 15. Investment Banking And Trading Services Company Profiles
- 15.1 [Company 01]
- 15.1.1 Company Overview
- 15.1.2 Key Management Personnel
- 15.1.3 Products & Services Portfolio
- 15.1.4 Financial Performance
- 15.1.5 Key Market Focus & Geographic Presence
- 15.1.6 Recent Developments & Strategic Initiatives
Note: The company profile list is preliminary and may change based on research findings, market developments, data availability, and client requirements.
Chapter 16. Appendices
- Appendix A – List of Abbreviations & Acronyms
- Appendix B – Industry Classification Code Reference – Full Series
- Appendix C – Production & Capacity Data Tables
- Appendix D – End-Use & Demand Base Tables
- Appendix E – Consumption & Replacement Rate Assumptions
- Appendix F – ASP Reference Tables
- Appendix G – Manufacturing & Facility Database
- Appendix H – Import-Export Data Tables
- Appendix I – Regulatory Summary Tables
- Appendix J – Primary Research Participant List (Anonymized)
- Appendix K – Primary Research Questionnaire Framework
- Appendix L – Data Sources & Bibliography
- Appendix M – Market Size Divergence & Source Comparison
Chapter 17. Research Methodology
- 17.1 Research Framework & Philosophy
- 17.2 Secondary Research – Sources, Hierarchy & Data Extraction
- 17.3 Data Modeling – Bottom-Up & Top-Down Market Sizing
- 17.4 Primary Research – Stakeholder Framework, LOI & Sample Sizes
- 17.5 Forecast Methodology – Regression, Scenario & Sensitivity Analysis
- 17.6 Quality Control – Four-Layer Validation Framework
- 17.7 Limitations & Standard Assumptions
- 17.8 Disclaimer
