
Market Overview:
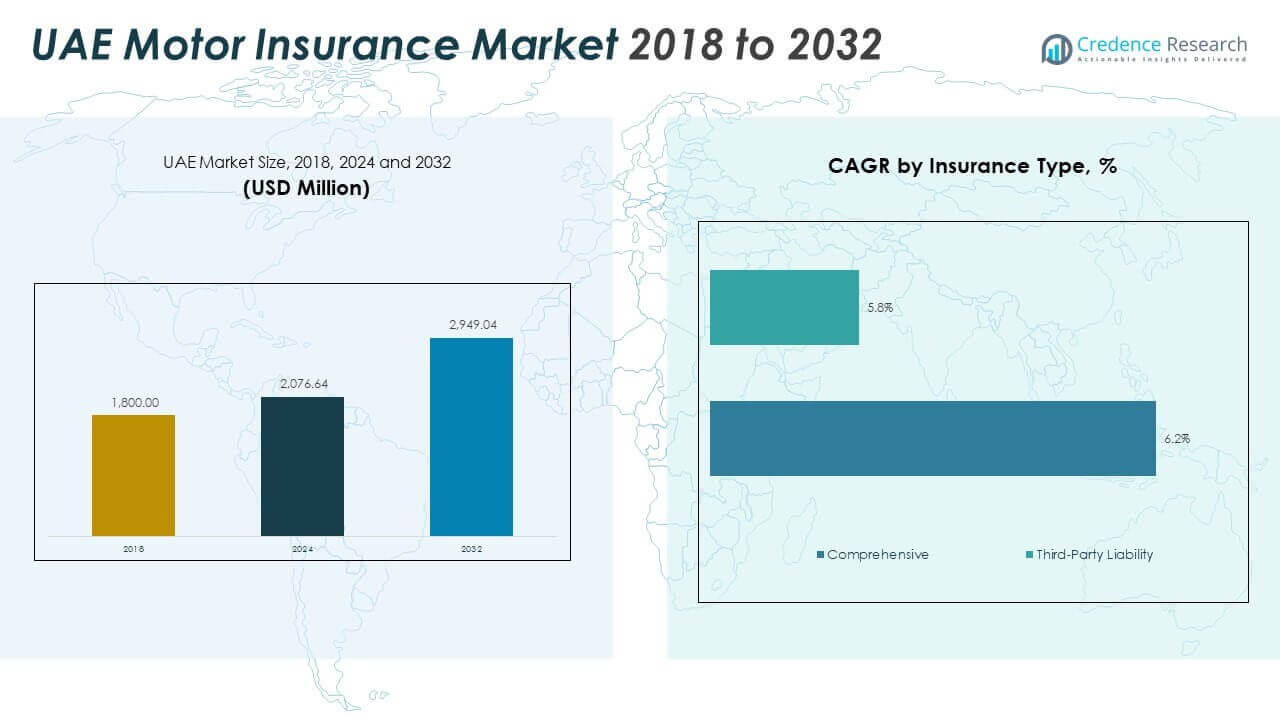
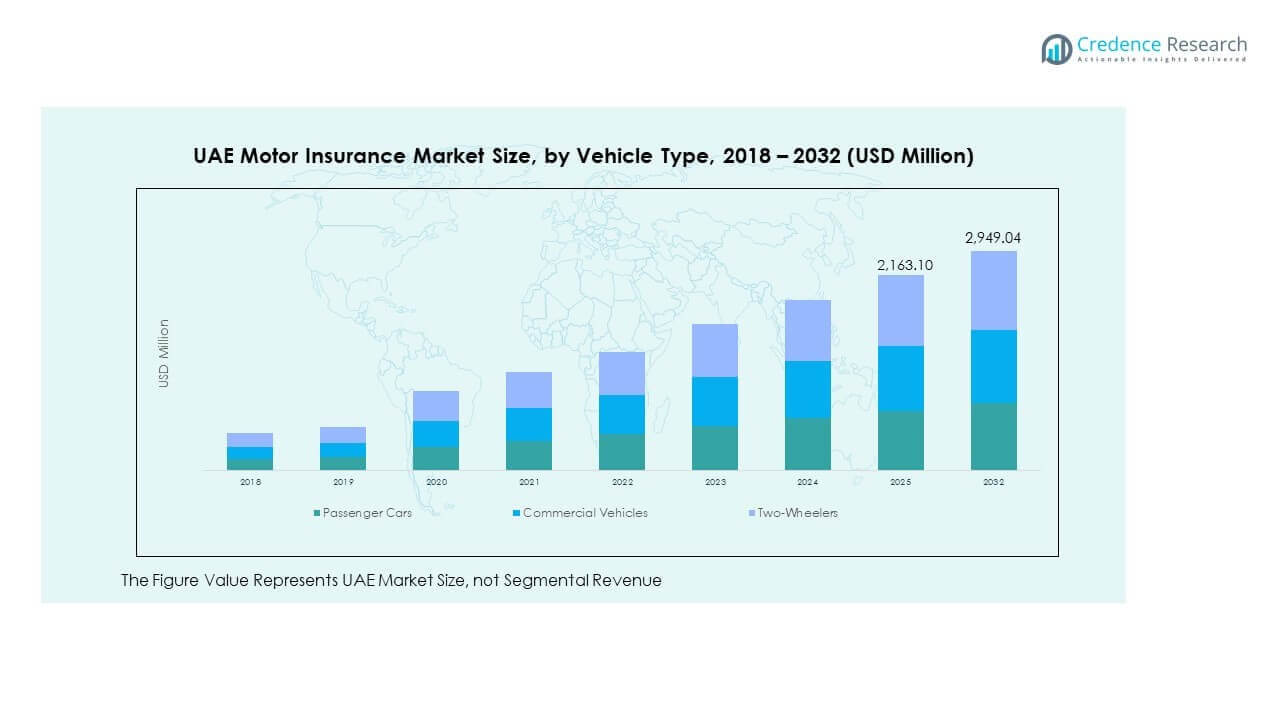
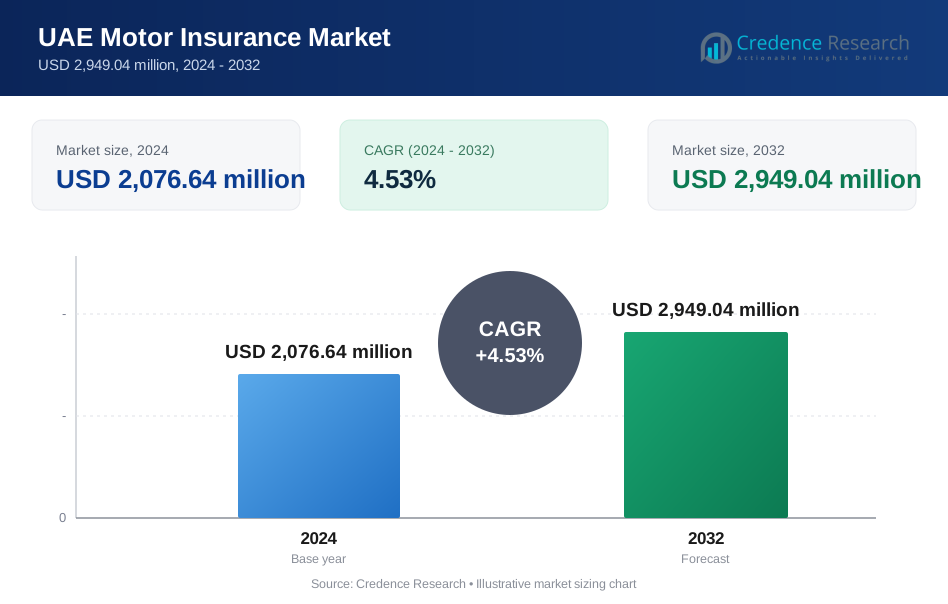
The UAE Motor Insurance Market size was valued at USD 1,800.00 million in 2018 to USD 2,076.64 million in 2024 and is anticipated to reach USD 2,949.04 million by 2032, at a CAGR of 4.53% during the forecast period.
| REPORT ATTRIBUTE | DETAILS |
|---|---|
| Historical Period | 2020-2023 |
| Base Year | 2024 |
| Forecast Period | 2025-2032 |
| UAE Motor Insurance Market Size 2024 | USD 2,076.64 Million |
| UAE Motor Insurance Market, CAGR | 4.53% |
| UAE Motor Insurance Market Size 2032 | USD 2,949.04 Million |
Market growth is driven by rising vehicle ownership and dense urban traffic. Accident exposure increases insurance relevance for daily commuters. Comprehensive coverage gains preference due to higher vehicle values. Commercial fleets expand with logistics and ride-hailing growth. Digital platforms simplify policy purchase and renewal. Insurers improve pricing accuracy through data analytics. Faster claims handling strengthens customer trust. Add-on covers enhance policy appeal. Regulatory enforcement maintains high penetration levels.
Dubai and Abu Dhabi lead due to high vehicle concentration and income levels. These regions show strong adoption of comprehensive policies. Sharjah emerges with steady growth from commuter traffic. Northern emirates gain momentum from urban development and rising registrations. Digital access improves insurance reach in emerging areas. Broker networks support penetration outside metro zones. Uniform regulations ensure consistent coverage standards nationwide. Regional diversity supports balanced market expansion.
Market Insights
- The UAE Motor Insurance Market was valued at USD 1,800.00 million in 2018, rose to USD 2,076.64 million in 2024, and is projected to reach USD 2,949.04 million by 2032, growing at a CAGR of 4.53%.
- Dubai held the highest market share at 41%, driven by high vehicle ownership and strong digital policy adoption. Abu Dhabi followed with 34%, supported by large government and corporate fleet coverage. Northern Emirates contributed 25%, showing growing insurance uptake across emerging zones.
- Sharjah and surrounding emirates are the fastest-growing region in the UAE Motor Insurance Market, aided by rising vehicle registrations, SME activity, and improved digital access.
- In 2024, the passenger cars segment accounted for the highest share of the UAE Motor Insurance Market, reflecting widespread private vehicle use in urban areas.
- Between 2024 and 2032, the comprehensive insurance type is projected to grow at a CAGR of 6.2%, outpacing third-party liability, which is forecasted to grow at 5.8%, reflecting stronger demand for full vehicle protection.
Market Drivers:
Mandatory Motor Insurance Laws And Strong Regulatory Enforcement Across Emirates
Federal regulations require valid motor insurance for vehicle registration and renewal. This rule secures steady policy demand across private and commercial vehicles. Enforcement remains strict through digital registration systems. Non-compliance leads to fines and registration blocks. Insurers benefit from predictable renewal cycles. Policy penetration stays high across all emirates. The UAE Motor Insurance Market gains stability from this structure. Regulatory clarity improves insurer planning and pricing discipline. Centralized databases improve policy verification efficiency. Enforcement consistency reduces uninsured vehicle presence on roads.
Rising Vehicle Ownership And Urban Traffic Density In Major Cities
Vehicle ownership continues to rise across personal and fleet categories. Urban expansion increases daily traffic volumes. Higher exposure raises accident probability. Policy uptake grows with risk awareness. Insurers adjust coverage options to suit dense traffic conditions. Repair networks expand to handle claim volumes. Urban drivers prefer comprehensive coverage. This trend sustains premium flow. Multi-car households further increase policy counts. Congested commuting routes intensify insurance relevance.
- For instance, Dubai’s Roads and Transport Authority (RTA) integrated real-time insurance validation into its vehicle registration system, enabling automated checks directly with insurers before renewal approvals.
Growth Of Commercial Fleets And Ride-Hailing Mobility Services
Logistics firms expand fleets to support e-commerce delivery. Ride-hailing platforms add vehicles across cities. Fleet insurance demand rises with vehicle utilization. Insurers design tailored fleet policies. Risk pooling supports competitive pricing. Claims frequency data improves underwriting accuracy. Corporate buyers seek fast claim settlement. Commercial demand strengthens market depth. Contract-based renewals support long-term revenue visibility. Fleet telematics improves operational risk monitoring.
Rising Consumer Preference For Comprehensive And Add-On Coverage
Drivers seek wider protection beyond third-party policies. Add-ons cover roadside support and agency repairs. High vehicle values influence coverage choices. Consumer awareness improves policy selection. Insurers bundle services to enhance retention. Digital tools simplify comparison and upgrades. Renewal rates remain strong. Service quality influences brand choice. Luxury vehicle growth amplifies coverage expectations. Customers favor policies with seamless claim support.
- For instance, HAYAH Insurance operates a fully digital platform that enables instant policy issuance by integrating automated underwriting with government systems like the Dubai Health Authority. Its digital journey is primarily focused on life, health, and savings products.
Market Trends:
Rapid Shift Toward Digital Policy Distribution And Online Renewals
Insurers invest in digital sales platforms. Online quotes improve customer reach. Policy issuance becomes faster and paperless. Renewal reminders reduce policy lapses. Mobile apps support claim tracking. Customer acquisition costs decline. Digital engagement improves retention. Operational efficiency rises across insurers. Virtual assistants enhance user experience during onboarding. Integration with payment gateways enables instant premium transactions. AI chatbots now handle quote comparison and product queries 24/7.
Adoption Of Telematics And Usage-Based Insurance Models
Telematics devices capture driving behavior data. Safe driving earns premium benefits. Risk assessment becomes more accurate. Younger drivers accept app-based monitoring. Insurers refine pricing models. Claims fraud detection improves. Data supports proactive risk management. Personalization gains traction. EV users also adopt telematics to optimize driving range and habits. Partnerships with mobility platforms fuel pilot programs for UBI models. Real-time feedback motivates safer driving habits among users.
- Telematics devices capture driving behavior data to inform risk profiles and pricing. For instance, Zurich UAE offers usage‑based insights through connected driving data, enabling insurers to refine premiums and support safer driving outcomes for policyholders.
Expansion Of Cashless Garage Networks And Service Partnerships
Insurers expand approved repair networks. Cashless repairs improve customer experience. Faster settlements reduce disputes. Workshops align with insurer standards. Repair cost control improves margins. Service transparency builds trust. Policyholders value convenience. Network strength supports brand loyalty. Expansion into tier-2 cities enhances regional customer support. Franchise garages join insurer panels to widen access points. Some insurers embed service ratings to ensure garage accountability.
- For instance, Liva Insurance (formerly RSA Middle East) maintains a certified cashless garage network across the UAE, offering both agency and high-standard non-agency repair options. Its digital claims system enables real-time approvals through the Liva App, cutting repair turnaround time and enhancing policyholder convenience.
Rising Focus On Claims Turnaround Time And Service Experience
Customers expect faster claim resolution. Insurers streamline internal workflows. Automation reduces manual delays. Customer service metrics gain priority. Brand differentiation shifts to service quality. Complaint ratios influence reputation. Retention links closely to claim experience. Operational excellence becomes a key trend. AI-based claim triaging shortens approval cycles. Real-time updates improve communication transparency with policyholders. Insurers now track claims resolution time as a core KPI.
Market Challenges Analysis:
High Claims Frequency And Rising Vehicle Repair Costs
Accident rates remain high in urban corridors. Repair costs rise due to imported parts. Advanced vehicle technology raises service expenses. Insurers face margin pressure from claims payouts. Pricing discipline becomes difficult. Fraudulent claims increase operational strain. Network cost control needs constant oversight. Profitability remains sensitive to loss ratios. High-end vehicles require specialized parts, inflating average claim size. Shortage of skilled technicians also delays repairs and drives up service charges.
Intense Price Competition And Limited Product Differentiation
Many insurers compete on premium pricing. Discount-driven sales affect margins. Product features show limited variation. Customer switching remains high at renewal. Brokers push price-focused comparisons. Value perception becomes challenging. Brand loyalty weakens in price wars. Sustainable differentiation stays complex. Digital aggregators amplify commoditization trends. Margins compress further when customer acquisition costs rise across platforms.
Market Opportunities:
Growth Potential From Electric Vehicles And New Mobility Segments
Electric vehicle adoption increases across cities. New risk profiles need specialized coverage. Insurers can design EV-specific policies. Battery and charging risks create new products. Corporate EV fleets drive bulk demand. Policy innovation supports premium growth. Early movers gain advantage. Market scope expands steadily. Regulatory interest in EV insurance compliance also boosts product development. Green mobility incentives indirectly stimulate premium volumes through EV adoption schemes.
Untapped Demand In Emerging Emirates And SME Fleet Segment
Northern emirates show rising vehicle registrations. SME fleets seek cost-efficient coverage. Insurers can tailor scalable products. Broker networks aid regional reach. Digital onboarding reduces access barriers. Service expansion supports penetration. It creates long-term customer pipelines. Growth balances metro market maturity. Localized campaigns help raise awareness among small businesses. Government road infrastructure upgrades also support commercial insurance demand.
Market Segmentation Analysis
By Vehicle Type
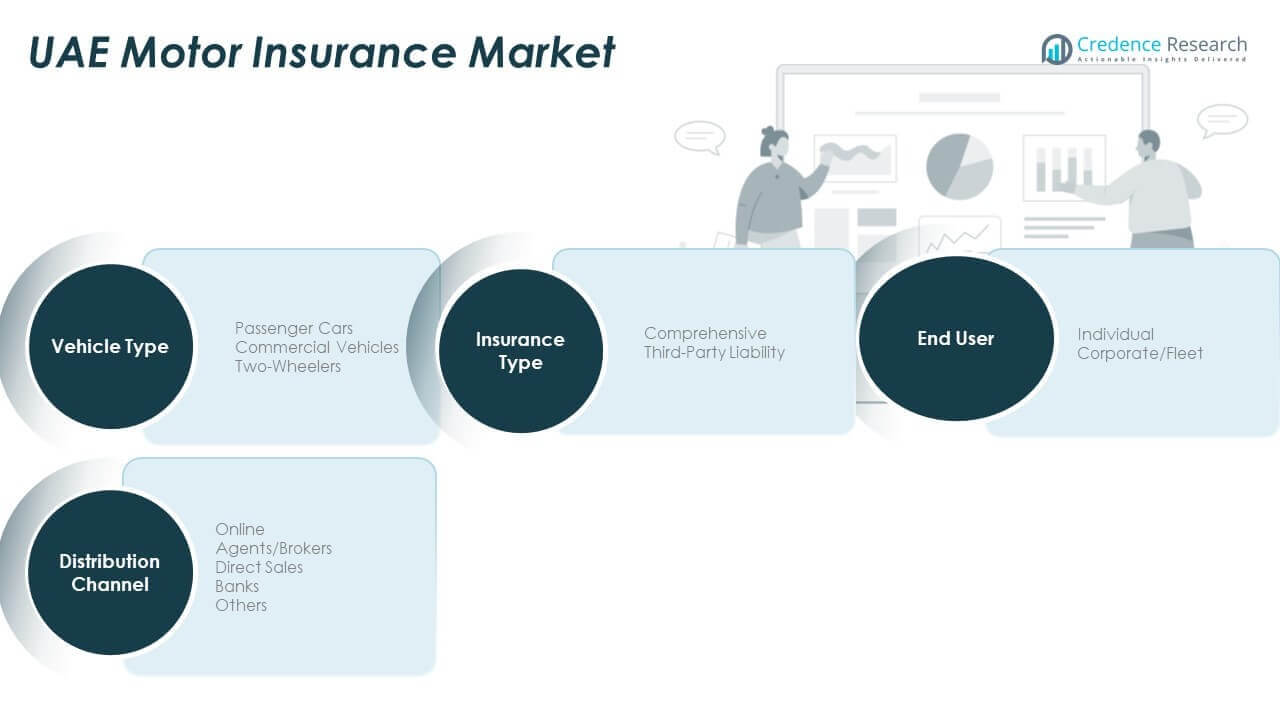
Passenger cars dominate the UAE Motor Insurance Market due to high ownership among residents. Urban centers like Dubai and Abu Dhabi contribute the largest share. These vehicles typically opt for comprehensive policies given their higher asset value. Commercial vehicles follow, driven by logistics and delivery fleet growth. SMEs and ride-hailing firms expand their insured fleet count. Two-wheelers remain a smaller segment, with insurance penetration growing slowly. Demand rises among food delivery operators. Each vehicle type presents a different risk and pricing model. Segment-specific offerings help insurers manage claim exposure.
- For instance, Dubai’s high concentration of passenger vehicles significantly drives demand for comprehensive motor insurance policies, supported by dense urban traffic and strong vehicle ownership levels.
By Insurance Type
Comprehensive insurance policies lead due to broad coverage. Vehicle owners in the UAE prefer all-risk protection, especially for high-value cars. It covers accident damage, theft, and third-party liabilities. Third-party liability insurance remains mandatory under federal law. It serves cost-sensitive users and low-value vehicles. The UAE Motor Insurance Market sees a gradual shift toward value-added comprehensive policies. Regulatory clarity supports market stability. Both segments ensure baseline policy circulation. Premium structures vary based on vehicle use and age.
By End User
Individual policyholders form the bulk of active insured clients. They account for personal vehicle registrations and renewals. Service quality and claim speed influence retention. Corporate/fleet buyers include transport firms, taxi companies, and large logistics players. Fleets benefit from negotiated premiums and bundled services. Usage frequency and exposure dictate claim risks. Insurers tailor coverage to business needs. Renewal cycles align with fleet turnover. End user type affects product mix and service delivery.
- For instance, Abu Dhabi National Insurance Company expanded its electric vehicle insurance offerings to include tailored coverage for battery and high‑value components, reflecting broader insurer responses to rising EV adoption in the UAE.
By Distribution Channel
Online sales grow steadily through insurer platforms and aggregators. Users value instant quotes and renewals. Agents and brokers maintain a strong foothold through personal service. Direct sales work well for renewals and customer retention. Banks offer bundled motor insurance with vehicle loans. Other channels include car dealerships and auto service centers. Each channel targets a specific user profile. The mix affects margins, outreach, and policy features. It enables wide market coverage across demographics.
Segmentation
By Vehicle Type
- Passenger Cars
- Commercial Vehicles
- Two-Wheelers
By Insurance Type
- Comprehensive
- Third-Party Liability
By End User
- Individual
- Corporate / Fleet
By Distribution Channel
- Online
- Agents / Brokers
- Direct Sales
- Banks
- Others
Regional Analysis
Dubai – Market Share: 41%
Dubai leads the UAE Motor Insurance Market with a 41% share, supported by its dense population and high vehicle ownership rates. The emirate houses a large number of luxury vehicles, which drives demand for comprehensive coverage. Ride-hailing services and logistics fleets also contribute to higher commercial insurance volumes. Insurers in Dubai benefit from advanced digital platforms and strong broker networks. Claims infrastructure remains robust, supporting customer satisfaction. It continues to attract new insurers and aggregators due to high policy volumes and digital readiness.
Abu Dhabi – Market Share: 34%
Abu Dhabi holds a 34% share in the UAE Motor Insurance Market, driven by both personal and commercial vehicle demand. Corporate fleet coverage remains a key contributor due to the presence of government and oil-sector fleets. Comprehensive policies remain preferred due to high average vehicle values. The regulatory framework promotes policyholder rights and supports digital expansion. Insurers engage with institutional clients and focus on long-term renewals. It maintains pricing stability and operational efficiency across distribution channels.
Northern Emirates – Market Share: 25% (Sharjah, Ajman, Ras Al Khaimah, Fujairah, Umm Al Quwain)
The Northern Emirates collectively contribute 25% of the UAE Motor Insurance Market. Sharjah leads among them, with a rising base of daily commuters and private vehicle owners. Insurance demand is growing in Ajman and Ras Al Khaimah, supported by new residential developments. Policy penetration is lower in remote zones, but expanding due to agent networks and online reach. Two-wheeler and economy vehicle policies are more common in these areas. It offers room for growth through localized service models and flexible pricing strategies.
Key Player Analysis
- AXA Gulf
- Oman Insurance Company
- Abu Dhabi National Insurance Company (ADNIC)
- RSA Insurance Middle East
- Al Fujairah National Insurance Company (AFNIC)
Competitive Analysis
The UAE Motor Insurance Market is highly competitive, with both local and international players competing on price, service quality, and digital access. Leading insurers include AXA Gulf, Oman Insurance Company, Abu Dhabi National Insurance Company (ADNIC), RSA Insurance Middle East, and Al Fujairah National Insurance Company (AFNIC). These firms offer a mix of third-party and comprehensive products across all emirates. Insurers differentiate through service turnaround, network strength, and value-added features like roadside assistance and cashless garage access. Digital transformation is reshaping competition. Aggregator platforms, mobile apps, and instant policy issuance tools have become standard offerings. Companies investing in digital claims management and telematics integration hold a clear edge. New entrants focus on price-sensitive consumers via online channels, while established players strengthen their broker and bancassurance networks. Commercial fleet insurance emerges as a key battleground, where large players secure long-term deals through bundled services and risk-based pricing models. Price pressure remains intense, especially in the individual policy segment. Many insurers compete on discounts, leading to thinner margins and frequent customer switching. Service quality and claims processing speed now influence customer retention more than branding. Market share consolidation is visible, with top players controlling the majority of written premiums.
Recent Developments
- In September 2025, ADNIC signed a long-term partnership with Allianz Trade to expand trade credit insurance solutions in the UAE, indirectly supporting business stability in sectors tied to motor insurance demand.
- In April 2024, Abu Dhabi National Insurance Company (ADNIC) completed the acquisition of a 51% stake in Allianz Saudi Fransi Cooperative Insurance Company enhancing its regional footprint in key Gulf markets that influence UAE motor insurance dynamics through expanded operations.
Report Coverage
The research report offers an in-depth analysis based on Vehicle Type, Insurance Type, End User and Distribution Channel. It details leading market players, providing an overview of their business, product offerings, investments, revenue streams, and key applications. Additionally, the report includes insights into the competitive environment, SWOT analysis, current market trends, as well as the primary drivers and constraints. Furthermore, it discusses various factors that have driven market expansion in recent years. The report also explores market dynamics, regulatory scenarios, and technological advancements that are shaping the industry. It assesses the impact of external factors and global economic changes on market growth. Lastly, it provides strategic recommendations for new entrants and established companies to navigate the complexities of the market.
Future Outlook
- Digital policy distribution will expand rapidly as consumers prefer faster, self-service options online.
- Telematics and usage-based insurance will grow, enabling personalized pricing and better risk control.
- Comprehensive policy adoption will rise with increasing demand for value-added services and vehicle protection.
- Electric vehicle insurance will open new product lines, pushing insurers to adjust coverage models.
- SME and fleet coverage will strengthen as logistics and ride-hailing sectors scale operations.
- Northern Emirates will show improved policy penetration through agent networks and digital inclusion.
- Cashless repair networks and service partnerships will become key differentiators among top insurers.
- Market consolidation may increase, with larger players acquiring smaller firms to expand share.
- Regulatory updates will push greater transparency, faster claims processing, and fair pricing.
- Insurers will prioritize AI-driven claims handling to cut costs and enhance service speed.
Request a Free Sample
Fill in your details and we'll send you a free sample report.
- Sample data tables & charts
- Research methodology
Need a Custom Version of This Report?
Tailor the scope, geography, or segments to your exact requirements.
- Custom geography or segment scope
- Direct access to our analyst team
Frequently Asked Questions
What is the current market size for UAE Motor Insurance Market, and what is its projected size in 2032?
At what Compound Annual Growth Rate is the UAE Motor Insurance Market projected to grow between 2024 and 2032?
Which UAE Motor Insurance Market segment held the largest share in 2024?
What are the primary factors fueling the growth of the UAE Motor Insurance Market?
Who are the leading companies in the UAE Motor Insurance Market?
Which region commanded the largest share of the UAE Motor Insurance Market in 2024?
Table of Content
Chapter 1. Report Introduction
- 1.1 Report Description & Purpose
- 1.1.1 Report Title & Market Definition
- 1.1.2 Unique Selling Propositions (USP) & Key Differentiators
- 1.1.3 Value Proposition for Stakeholders
- 1.2 Research Objectives
- 1.2.1 Market Sizing Objectives (Volume & Revenue)
- 1.2.2 Segmentation Objectives
- 1.2.3 Competitive Intelligence Objectives
- 1.2.4 Forecast & Scenario Objectives
- 1.3 Report Scope
- 1.3.1 UAE Motor Insurance Scope – Types & Subtypes Covered
- 1.3.2 Geographic Scope – Regions & Countries Covered
- 1.3.3 Historical Period, Base Year & Forecast Period (2024; forecast to 2032)
- 1.3.4 Inclusions & Exclusions
- 1.4 HS Code & Classification Framework
- 1.5 Currency, Units & Pricing Basis
- 1.6 Target Stakeholders
- 1.7 Limitations & Assumptions
Chapter 2. Executive Summary
- 2.1 Global UAE Motor Insurance Market Snapshot
- 2.1.1 Market Size – Historical (2024) & Forecast (2024-2032) (2024: USD 2,076.64 million → 2032: USD 2,949.04 million)
- 2.1.2 Volume & Revenue – Global Totals
- 2.1.3 Key Market Highlights – Top Five Facts
- 2.2 UAE Motor Insurance Market Segmentation Snapshot
- 2.2.1 Market Split by Region – 2024 vs. 2032
- 2.3 Competitive Snapshot
- 2.3.1 Top 10 Players by Revenue Share – 2024
- 2.3.2 Top 10 Players by Volume Share – 2024
- 2.3.3 Recent Strategic Developments (18-Month Summary)
- 2.4 Key Investment Highlights & Strategic Conclusions
Chapter 3. UAE Motor Insurance Market Dynamics & Industry Analysis
- 3.1 Market Overview & Context
- 3.1.1 UAE Motor Insurance Market Position in the Broader Automotive Value Chain
- 3.1.2 OEM vs. Replacement Market Dynamics
- 3.1.3 Market Maturity & Development Stage by Region
- 3.2 UAE Motor Insurance Market Drivers
- 3.3 UAE Motor Insurance Market Restraints & Challenges
- 3.4 UAE Motor Insurance Market Opportunities
- 3.5 Porter's Five Forces Analysis
- 3.5.1 Threat of New Entrants
- 3.5.2 Bargaining Power of Suppliers
- 3.5.3 Bargaining Power of Buyers
- 3.5.4 Threat of Substitutes
- 3.5.5 Competitive Rivalry – Intensity Assessment
- 3.6 UAE Motor Insurance Value Chain Analysis
- 3.6.1 Upstream – Raw Material/Input Suppliers
- 3.6.1.1 Raw Material/Input 1
- 3.6.1.2 Raw Material/Input 2
- 3.6.1.3 Raw Material/Input 3
- 3.6.2 Midstream – Production/Manufacturing/Service Delivery
- 3.6.2.1 Production/Process Overview
- 3.6.2.2 Key Facility Locations & Capacity by Manufacturer
- 3.6.3 Downstream – Distribution & End Consumer
- 3.6.3.1 Primary Channel – B2B/OEM
- 3.6.3.2 Secondary Channels – Dealer, Retail, Online, Direct
- 3.6.4 Value Chain Profitability Analysis
- 3.6.1 Upstream – Raw Material/Input Suppliers
- 3.7 PESTEL Analysis
- 3.7.1 Political Factors
- 3.7.2 Economic Factors
- 3.7.3 Social Factors
- 3.7.4 Technological Factors
- 3.7.5 Environmental Factors
- 3.7.6 Legal Factors
- 3.8 UAE Motor Insurance Supply Chain Analysis
- 3.8.1 Raw Material/Input Supply Risk Assessment
- 3.8.2 Manufacturing Concentration Risk (Geographic Exposure)
- 3.8.3 Trade Disruption Impact Analysis
- 3.9 Regulatory & Policy Landscape
Note: The regulatory and policy landscape section covers regulations based on their applicability to the market, UAE Motor Insurance category, geography, and scope of the study. Only regulatory frameworks with a material impact on operations, compliance, trade, sustainability, or market access are analyzed in detail.
Chapter 4. Key Investment Pockets & Opportunity Analysis
- 4.1 UAE Motor Insurance Market Attractiveness Analysis
- 4.1.1 By Region – Investment Attractiveness Matrix (Volume × CAGR)
- 4.2 Absolute Revenue Growth Opportunity
- 4.2.1 By Region – Absolute USD Growth Through 2032
- 4.3 Incremental Volume Opportunity
- 4.3.1 By Region – Incremental Volume Through 2032
- 4.3.2 Segment – Incremental Volume
- 4.4 Emerging Submarket Opportunity Deep Dive (Subject to Applicability)
- 4.5 Emerging Market Opportunity Scorecards
- 4.5.1 United States
- 4.5.2 Europe
- 4.5.3 Asia
- 4.5.4 Middle East & Africa
Note: Emerging Market Opportunity Scorecards will be included based on relevance and strategic importance. Regions listed are indicative and may vary depending on data availability and market dynamics.
Chapter 5. UAE Motor Insurance Import-Export Analysis & Trade Flows
- 5.1 Global Trade Overview
- 5.1.1 Global Export Value by Country (2024)
- 5.1.2 Global Export Volume by Country (2024)
- 5.1.3 Global Import Value by Country (2024)
- 5.1.4 Global Import Volume by Country (2024)
- 5.1.5 Net Trade Balance by Country (2024)
- 5.2 Export Analysis – Segment
- 5.2.1 Type 1 (HS Code)
- 5.2.2 Type 2 (HS Code)
- 5.2.3 Type 3 (HS Code)
- 5.2.4 Type 4 (HS Code)
- 5.2.5 Type 5 (HS Code)
- 5.3 Import Analysis – Segment
- 5.3.1 Type 1 (HS Code)
- 5.3.2 Type 2 (HS Code)
- 5.3.3 Type 3 (HS Code)
- 5.3.4 Type 4 (HS Code)
- 5.3.5 Type 5 (HS Code)
- 5.4 Average Unit Trade Prices
- 5.4.1 Average Export Price – Segment & Country
- 5.4.2 Average Import Price – Segment & Source Country
- 5.4.3 Price Trends (2024)
- 5.5 Key Trade Route Analysis
- 5.5.1 Trade Route 1
- 5.5.2 Trade Route 2
- 5.5.3 Trade Route 3
- 5.5.4 Trade Route 4
- 5.5.5 Trade Route 5
- 5.6 Trade Policy Impact Assessment
- 5.6.1 US Anti-Dumping & Section 301 Tariffs
- 5.6.2 EU Customs Union Impact
- 5.6.3 Major Free Trade Agreements
- 5.6.4 USMCA Rules of Origin
Note: Trade policy analysis will be included only where relevant to the UAE Motor Insurance market.
Chapter 6. Competitive Landscape & Company Benchmarking
- 6.1 UAE Motor Insurance Market Concentration & Structure
- 6.1.1 Herfindahl-Hirschman Index (HHI) – vs. 2024
- 6.1.2 Tier 1, Tier 2 & Tier 3 Market Structure
- 6.1.3 Global, Regional & Local Player Dynamics
- 6.2 UAE Motor Insurance Market Share Analysis – 2024
- 6.2.1 Global Revenue Share by Company
- 6.2.2 Global Volume Share by Company
- 6.2.3 Regional Revenue Share
- 6.2.4 Market Share Evolution ( vs. 2024)
- 6.2.5 OEM Segment Share by Company
- 6.2.6 Replacement Segment Share by Company
- 6.3 Production/Delivery Capacity & Facility Analysis
- 6.3.1 Global Installed Capacity
- 6.3.2 Capacity Utilization Rates
- 6.3.3 Production/Output Volume
- 6.3.4 Facility Locations & Capacity Map
- 6.3.5 Planned Capacity Additions
- 6.4 UAE Motor Insurance Competitive Benchmarking Matrix
- 6.4.1 Revenue, Volume, CAGR & Profitability Comparison
- 6.4.2 Channel Revenue Mix
- 6.4.3 Geographic Revenue Exposure
- 6.4.4 R&D Intensity
- 6.4.5 Sustainability Maturity
- 6.5 Strategic Developments in UAE Motor Insurance (Last 24 Months)
- 6.5.1 Mergers, Acquisitions & Divestments
- 6.5.2 New UAE Motor Insurance Launches
- 6.5.3 Facility Expansions
- 6.5.4 Strategic Alliances, Joint Ventures & Partnerships
- 6.5.5 Distribution Expansion & Market Entry
- 6.5.6 Sustainability & ESG Initiatives
- 6.6 Competitive Strategy Mapping
- 6.6.1 Leader, Challenger, Follower & Niche Classification
- 6.6.2 Pricing Strategy Comparison
- 6.6.3 Channel Strategy Matrix
Note: Strategic developments are included based on their materiality and the availability of reliable information.
Chapter 7. Global UAE Motor Insurance Market – By Distribution Channel
- 7.1 Segment Overview
- 7.1.1 Volume & Revenue Split by Channel (2024 & 2032)
- 7.1.2 Channel Mix Evolution (2024-2032)
Chapter 8. Regional Market Analysis – Global Overview
- 8.1 Global Regional Overview
- 8.1.1 Regional Volume Share
- 8.1.2 Regional Revenue Share
- 8.1.3 Regional Volume by Region
- 8.1.4 Regional Revenue by Region
- 8.1.5 Regional Forecast Through 2032
- 8.2 Cross-Regional Segment Analysis
- 8.2.1 By Distribution Channel
- 8.2.2 By Brand/Price Tier
Chapter 9. North America UAE Motor Insurance Market
- 9.1 United States
- 9.2 Canada
- 9.3 Mexico
Chapter 10. Europe UAE Motor Insurance Market
- 10.1 Germany
- 10.2 France
- 10.3 Italy
- 10.4 United Kingdom
- 10.5 Spain
- 10.6 Poland
- 10.7 Russia
- 10.8 Netherlands
- 10.9 Belgium
- 10.10 Sweden
- 10.11 Denmark
- 10.12 Norway
- 10.13 Rest of Europe
Chapter 11. Asia Pacific UAE Motor Insurance Market
- 11.1 China
- 11.2 India
- 11.3 Japan
- 11.4 South Korea
- 11.5 Thailand
- 11.6 Indonesia
- 11.7 Vietnam
- 11.8 Malaysia
- 11.9 Australia
- 11.10 Rest of Asia Pacific
Chapter 12. Latin America UAE Motor Insurance Market
- 12.1 Brazil
- 12.2 Argentina
- 12.3 Colombia
- 12.4 Chile
- 12.5 Rest of Latin America
Chapter 13. Middle East UAE Motor Insurance Market
- 13.1 Saudi Arabia
- 13.2 United Arab Emirates
- 13.3 Turkey
- 13.4 Israel
- 13.5 Iran
- 13.6 Rest of the Middle East
Chapter 14. Africa UAE Motor Insurance Market
- 14.1 South Africa
- 14.2 Egypt
- 14.3 Nigeria
- 14.4 Morocco
- 14.5 Rest of Africa
Chapter 15. UAE Motor Insurance Company Profiles
- 15.1 [Company 01]
- 15.1.1 Company Overview
- 15.1.2 Key Management Personnel
- 15.1.3 Products & Services Portfolio
- 15.1.4 Financial Performance
- 15.1.5 Key Market Focus & Geographic Presence
- 15.1.6 Recent Developments & Strategic Initiatives
Note: The company profile list is preliminary and may change based on research findings, market developments, data availability, and client requirements.
Chapter 16. Appendices
- Appendix A – List of Abbreviations & Acronyms
- Appendix B – Industry Classification Code Reference – Full Series
- Appendix C – Production & Capacity Data Tables
- Appendix D – End-Use & Demand Base Tables
- Appendix E – Consumption & Replacement Rate Assumptions
- Appendix F – ASP Reference Tables
- Appendix G – Manufacturing & Facility Database
- Appendix H – Import-Export Data Tables
- Appendix I – Regulatory Summary Tables
- Appendix J – Primary Research Participant List (Anonymized)
- Appendix K – Primary Research Questionnaire Framework
- Appendix L – Data Sources & Bibliography
- Appendix M – Market Size Divergence & Source Comparison
Chapter 17. Research Methodology
- 17.1 Research Framework & Philosophy
- 17.2 Secondary Research – Sources, Hierarchy & Data Extraction
- 17.3 Data Modeling – Bottom-Up & Top-Down Market Sizing
- 17.4 Primary Research – Stakeholder Framework, LOI & Sample Sizes
- 17.5 Forecast Methodology – Regression, Scenario & Sensitivity Analysis
- 17.6 Quality Control – Four-Layer Validation Framework
- 17.7 Limitations & Standard Assumptions
- 17.8 Disclaimer
