Market Overview:
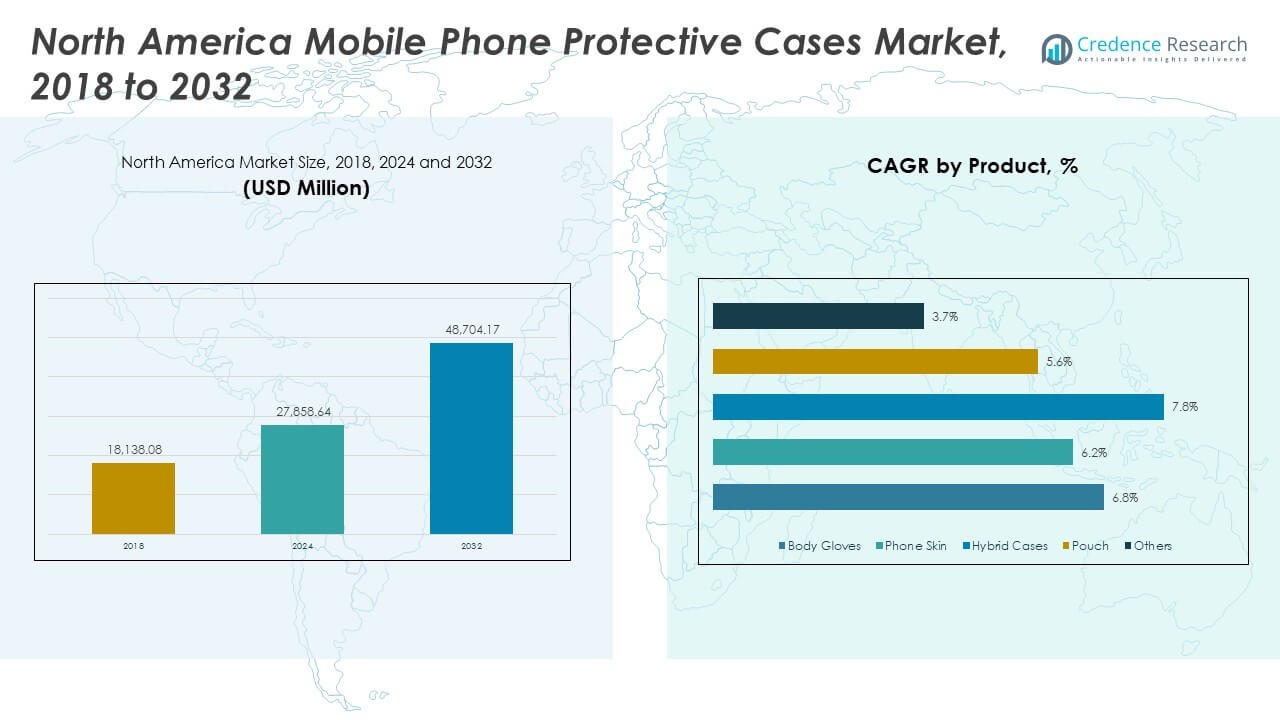
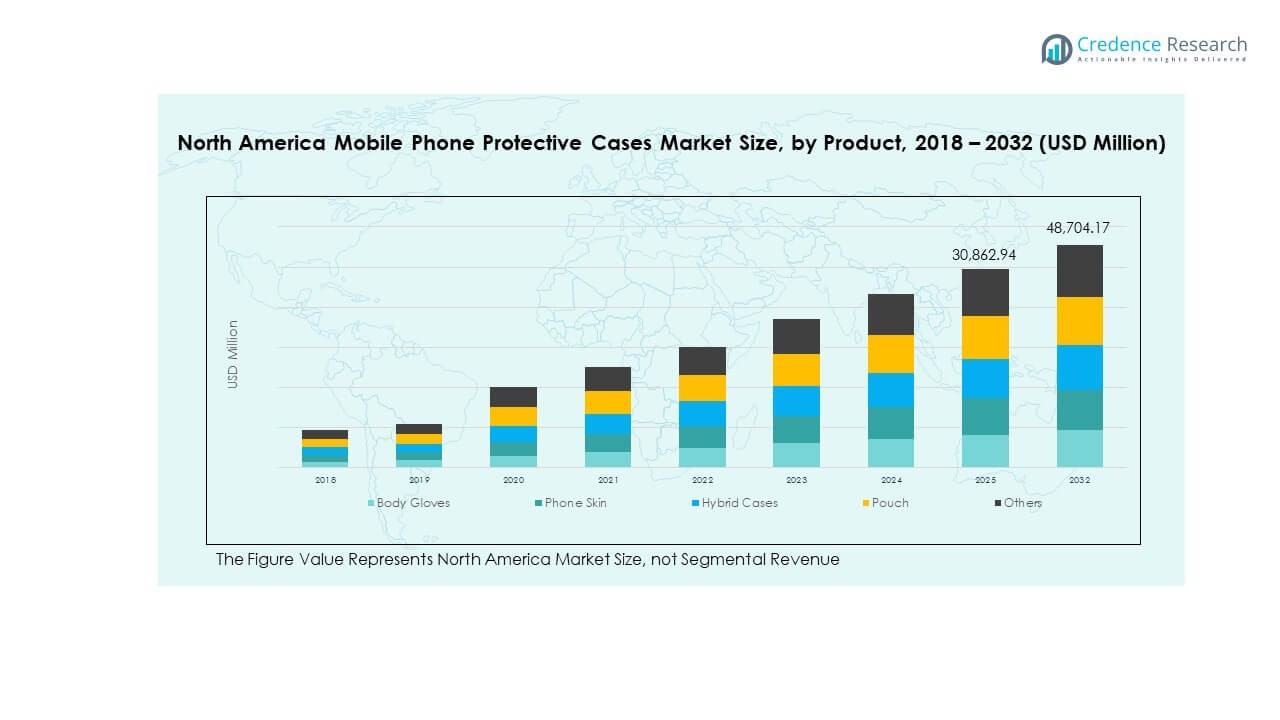
The North America Mobile Phone Protective Cases Market size was valued at USD 18,138.08 million in 2018 to USD 27,858.64 million in 2024 and is anticipated to reach USD 48,704.17 million by 2032, at a CAGR of 6.73% during the forecast period.
| REPORT ATTRIBUTE |
DETAILS |
| Historical Period |
2020-2023 |
| Base Year |
2024 |
| Forecast Period |
2025-2032 |
| North America Mobile Phone Protective Cases Market Size 2024 |
USD 27,858.64 Million |
| North America Mobile Phone Protective Cases Market, CAGR |
6.73% |
| North America Mobile Phone Protective Cases Market Size 2032 |
USD 48,704.17 Million |
Demand grows due to rising smartphone dependence in daily life. Buyers prefer cases that blend style and drop resistance, which pushes producers to design advanced materials and slim shock-proof formats. E-commerce fuels wider access to brand portfolios with faster product refresh cycles. Custom designs attract younger groups who want a personal look. Many firms invest in rugged models due to higher outdoor use. Strong device upgrade patterns lift recurring sales for protective accessories.
The United States leads this market due to high smartphone penetration, strong retail networks, and quick adoption of new phone models. Canada shows steady growth due to rising online sales and strong interest in premium cases. Mexico is emerging as a growth zone as urban users expand smartphone use and seek affordable protective designs. Regional demand patterns differ based on lifestyle, brand reach, and retail maturity. This mix shapes a diverse but growing market across North America.
Access crucial information at unmatched prices!
Request your sample report today & start making informed decisions powered by Credence Research Inc.!
Download Sample
Market Insights:
- The North America Mobile Phone Protective Cases Market grew from USD 18,138.08 million in 2018 to USD 27,858.64 million in 2024 and is projected to reach USD 48,704.17 million by 2032, supported by a steady 6.73% CAGR during the forecast period.
- The United States leads with about 70% share due to high smartphone ownership and strong retail reach, followed by Canada with around 20% driven by urban demand, while Mexico holds nearly 10% supported by expanding smartphone adoption.
- Mexico is the fastest-growing region with around 10% share, supported by rising urban smartphone penetration, value-focused case purchases, and increasing online accessibility.
- Product share from the image shows Body Gloves at roughly 40%, making it the dominant category across the timeline due to high protection needs and broad user appeal.
- Hybrid Cases hold around 20% share, followed by Others (~15%), Phone Skin (~15%), and Pouch (~10%), reflecting balanced demand across both functional and design-driven segments.
Market Drivers:
Strong Expansion in Smartphone Penetration and Device Replacement Cycles
Growing smartphone penetration fuels steady demand across the North America Mobile Phone Protective Cases Market. Buyers replace devices often, which triggers repeated purchases for protective covers. Many users pick durable formats to protect costly smartphones. Brands launch rugged and slim models to meet changing expectations. Retailers stock wide options to match different device launches. E-commerce platforms push faster turnover for seasonal designs. Frequent product refresh cycles help producers maintain stable revenue lines. This pattern strengthens recurring purchases across user groups.
- For instance, OtterBox verifies its Drop+ certified cases through 26 drop-tests from four feet, which lifts trust among users seeking reliable protection.
Rise in Consumer Preference for Impact-Resistant and Stylish Case Designs
Consumers want cases that mix style with strong protection. Many new users prefer shock-proof shells with slim frames. Designers create hybrid models to balance comfort and drop resistance. Producers use reinforced corners to lift impact absorption. Many households invest in premium cases for work and travel needs. Young buyers look for unique colors and patterns that fit personal style. The trend drives large demand across online and offline stores. This direction keeps upgrade cycles active across the region.
- For instance, Casetify’s QiTech 2.0 material (or the newer EcoShock material) is advertised as providing 8-foot (3-meter) drop protection in its Ultra Impact cases, which attracts style-driven users who still want strong protection. The cases are rigorously tested to meet military-grade standards (MIL-STD-810G), which involves drops from 4 feet, a height they significantly exceed in their own testing.
Faster Product Innovation Through New Materials and Enhanced Manufacturing Processes
Manufacturers use new materials to improve case strength. Thermoplastic blends help extend durability in daily use. Many brands add anti-slip textures for better handling. Production lines use automated tools to lift accuracy in mass output. Brands test prototypes to ensure steady performance under harsh use. Many firms use eco-friendly materials to match new buyer preferences. These upgrades help the market move toward higher-value product lines. Producers maintain strong portfolios through quicker design cycles.
Rapid Growth of E-Commerce Sales Channels and Direct-to-Consumer Brands
E-commerce platforms push wider access to case collections. Product images and reviews help buyers compare features quickly. Direct-to-consumer brands offer faster design updates and limited runs. Many users shop online to pick custom looks. Retailers run discounts to drive high-volume sales across seasons. Online sellers ship new collections after major phone launches. This direction keeps demand strong across urban and suburban groups. The online shift lifts digital engagement for many brands.
Market Trends:
Shift Toward Sustainable, Recyclable, and Bio-Based Protective Case Materials
Eco-friendly cases gain traction across retail channels. Buyers choose recyclable shells that match personal values. Many brands work on plant-based polymers to cut plastic use. Producers highlight low-impact production during marketing efforts. Designers push biodegradable materials for mass-market lines. Retailers stock green collections in major stores. This trend supports environmental goals across new buyers. Producers keep testing materials to improve long-term durability.
- For instance, Incipio’s Organicore line is 100% compostable and certified as USDA Biobased 100%, which strengthens its appeal among sustainability-focused consumers.
Growth of Personalization Features and On-Demand Case Customization Services
Personalized cases draw strong interest from young buyers. Print-on-demand tools enable endless design options. Many platforms support text, image, and pattern customization. Quick production helps deliver unique items in short cycles. Brands promote curated collections tied to lifestyle themes. Custom art and licensed graphics drive social media traction. This trend strengthens digital engagement for producers. Many users switch to custom looks after every device change.
- For instance, Casetify reports producing millions of custom prints annually, supported by its global print-on-demand facilities that enable near-instant personalization.
Rising Demand for MagSafe-Compatible, Wireless-Charging-Ready, and Tech-Integrated Case Designs
Tech-ready cases grow across the North America Mobile Phone Protective Cases Market. Many buyers want magnetic compatibility for faster accessory pairing. Brands design slim shells that support wireless charging. Producers add sensor-friendly zones for stable signal flow. Accessory makers build mounts and wallets aligned with case magnets. Many users pick tech-aligned designs for work convenience. Retailers highlight MagSafe-ready models during peak sale periods. This trend shapes upgrade choices across premium buyers.
Expansion of Premium Luxury Case Collections Driven by Fashion-Centric Consumers
Luxury cases attract fashion-focused users across large cities. Designers release leather and metal-finish formats to match high-end devices. Many brands run style drops tied to seasonal trends. Retail stores promote curated premium collections for festive demand. Influencers highlight high-end looks on social platforms. This trend lifts attention for limited-edition designs. Buyers link luxury cases with personal branding. The direction pushes premium growth segments forward.
Market Challenges Analysis:
Intense Price Competition and Rapid Replication Within the Protective Case Category
The North America Mobile Phone Protective Cases Market faces heavy price competition across brands. Many low-cost producers replicate designs quickly. Premium brands struggle to maintain differentiation. Retailers push discounts that squeeze margins for many sellers. Knockoffs reduce perceived value for original products. Design theft leads to shorter innovation cycles. Brands invest in trademarks to secure product identity. This pressure limits long-term product stability in crowded retail spaces.
Supply Chain Complexity, Rising Material Costs, and Shifts in Retail Inventory Planning
Supply chains face rising material costs across polymer categories. Manufacturers handle delays in global shipments during peak seasons. Retailers struggle with mismatched inventory levels after each phone launch. Many brands face surplus stock when device adoption slows. Packaging demands increase shipping weight across long routes. Producers manage quality issues across multi-country supplier networks. It impacts lead times across both online and offline channels. Retailers need stronger forecasting tools to match shifting demand.
Market Opportunities:
Expansion of Eco-Friendly Case Portfolios and High-Growth Segments Driven by Sustainability Buyers
Sustainable designs provide a large growth path for the North America Mobile Phone Protective Cases Market. Many buyers want low-impact materials across major shopping platforms. Brands can scale biodegradable and recycled models. Retailers support green labels for rising consumer awareness. Producers can build loyalty through ethical claims. This direction supports long-term portfolio expansion. Buyers reward transparent manufacturing practices. Eco-focused designs open new premium sub-segments.
Rising Demand for Tech-Enabled, Accessory-Compatible, and Multi-Function Protective Case Formats
Tech-aligned designs create strong revenue potential for emerging brands. Many users want magnetic features for daily convenience. Producers can add pockets, stands, and smart-tracking modules. Retailers promote bundles that pair accessories with protective cases. Multi-function formats lift cross-selling across digital channels. Brands can target remote workers who need stable phone setups. This direction shapes new development paths across the region. It opens wider scope for innovative case functions.
Market Segmentation Analysis:
Product Segment Analysis
The North America Mobile Phone Protective Cases Market includes varied product formats that serve different user preferences. Body gloves hold strong demand due to high protection needs for premium smartphones, and many buyers prefer durable frames for daily use. Phone skins attract users who want thin covers with a clean fit. Hybrid cases gain traction because they blend strength with light weight, which appeals to active users. Pouches serve niche buyers who need full-cover storage. Others include unique formats that target design-focused groups. Each product line supports stable growth across retail channels.
- For instance, Casetify reports producing millions of custom prints annually, supported by its global print-on-demand facilities that enable near-instant personalization.
Distribution Channel Segment Analysis
The market expands through two key retail routes that shape buying behavior. Online channels lead due to wide assortment, constant design refresh cycles, and strong influence from social media reviews. It supports direct access to new models during major phone launches. Many buyers pick online stores for custom prints and quick price checks. Offline stores retain demand for tactile evaluation and instant purchase needs. Retail outlets help buyers compare fit, grip, and quality. Both channels work together to build broad market coverage across the region.
- For instance, Spigen’s MIL-STD 810G-516.6 certified hybrid models pass multiple military-grade drop tests, which boosts demand within impact-resistant formats.
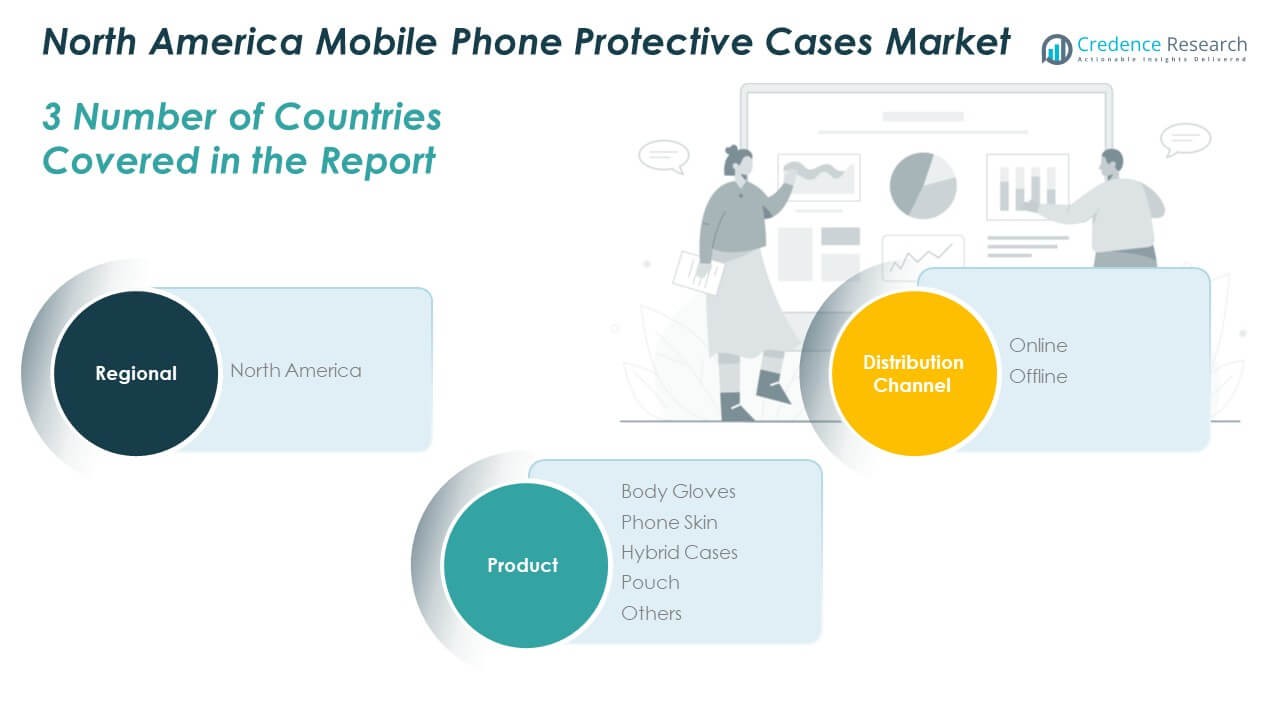
Segmentation:
By Product
- Body Gloves
- Phone Skin
- Hybrid Cases
- Pouch
- Others
By Distribution Channel
By Country (North America)
Regional Analysis:
United States: Leading Market with Strong Consumer Spending Power
The North America Mobile Phone Protective Cases Market is dominated by the United States, which holds the largest regional share of around 70%. High smartphone adoption and frequent device upgrades lift steady demand across major cities. Strong retail networks and rapid online sales help brands reach wide consumer groups. Many buyers choose premium protective cases for expensive flagship phones. The country supports fast design cycles tied to yearly device launches. It remains the primary revenue hub due to strong digital engagement and mature distribution routes.
Canada: Expanding Market with Steady Growth Across Urban Users
Canada contributes roughly 20% of the regional share, supported by rising smartphone use in urban zones. Buyers show strong interest in durable and stylish cases that match changing lifestyle needs. Retail stores stock expanded product ranges to meet seasonal demand. Online channels grow faster due to improved logistics and cross-border options. Many users pick mid-tier and premium models for work and travel use. The market benefits from stable income levels and increasing preference for protective accessories.
Mexico: Emerging Market with Rising Smartphone Penetration
Mexico accounts for nearly 10% of the regional share and shows strong growth potential. The market expands as smartphone adoption increases across urban and semi-urban regions. Many buyers prefer affordable protective cases with basic durability. Online sales rise due to broader access to global and local brands. Retail expansion across metro areas supports higher product visibility. The region creates new opportunities for value-focused and hybrid case formats that target a growing young population.
Shape Your Report to Specific Countries or Regions & Enjoy 30% Off!
Key Player Analysis:
Competitive Analysis:
The North America Mobile Phone Protective Cases Market shows intense competition shaped by strong brand presence and wide product variety. Leading companies focus on rugged, slim, and hybrid formats to meet varied user needs. Many brands strengthen online visibility through targeted campaigns and limited-edition drops. Retail partners work with producers to refresh store shelves during major phone releases. Emerging firms enter the market with low-cost designs that widen consumer choice. Premium brands defend share through quality upgrades and frequent style updates. It maintains steady momentum through continuous design innovation and supply chain improvements.
Recent Developments:
- In January 2024, Incipio announced its comprehensive lineup of protective cases for the new Samsung Galaxy S24, S24+, and S24 Ultra series, marking a significant product launch initiative in the North American market. The announcement introduced three primary case collections designed to balance sustainability, fashion, and reliable device protection. The flagship cru. collection featured elevated faux leather, textile, and camo designs priced at $49.99 MSRP, available in Navy Camo, Navy Canvas (with Verizon exclusive availability), and Brown Perforated Leather (also Verizon exclusive). Additionally, Incipio launched the Forme Protective case at $44.99 MSRP, featuring an Eternal Spring nature-inspired design with dual-layer construction and up to 10-feet drop protection, and the Duo case at $34.99 MSRP, offering 12-feet drop protection with the company’s latest Impact Struts technology. All cases were manufactured with recycled materials and came in plastic-free, recycled packaging, reflecting Incipio’s commitment to sustainability. The cases included intentionally raised edges for screen and camera protection, antimicrobial protection eliminating 99.9% of surface bacteria, and full compatibility with 5G and wireless charging technologies. The new collections became available at Incipio.com, with select models available at retail partners including Verizon, Best Buy Canada, and other leading retailers worldwide.
- In January 2024, Otter Products, the creator of the iconic OtterBox brand—recognized as the number one most trusted smartphone case brand in the United States—launched its innovative OtterBusiness brand to strengthen its presence in the B2B marketplace across North America. This strategic expansion marked a significant milestone, with OtterBusiness designed to serve commercial customers with solution-based approaches that extend beyond traditional cases to enhance productivity and efficiency. The company introduced the award-winning Hardline Series for iPad, which was specifically engineered and certified for use in hazardous industrial environments. To support this expansion, Otter Products recruited seasoned industry executives, including Tim Wagner as Senior Vice President of Commercial Sales and Go-to-Market strategy, who previously served as head of Worldwide Public Sector at Apple and had previously held positions as Senior Vice President and General Manager of Enterprise Sales for Samsung Electronics America.
Report Coverage:
The research report offers an in-depth analysis based on product and distribution channel segments. It details leading market players, providing an overview of their business, product offerings, investments, revenue streams, and key applications. Additionally, the report includes insights into the competitive environment, SWOT analysis, current market trends, as well as the primary drivers and constraints. Furthermore, it discusses various factors that have driven market expansion in recent years. The report also explores market dynamics, regulatory scenarios, and technological advancements that are shaping the industry. It assesses the impact of external factors and global economic changes on market growth. Lastly, it provides strategic recommendations for new entrants and established companies to navigate the complexities of the market.
Future Outlook:
- The market will gain strong traction due to higher smartphone usage and faster upgrade cycles.
- Demand for rugged and hybrid cases will rise as buyers seek better protection features.
- Eco-friendly case lines will grow as sustainability preferences influence purchasing behavior.
- Personalization will expand through print-on-demand tools and custom design platforms.
- Online channels will strengthen reach due to wide catalogs and social media-driven demand.
- Premium case categories will attract fashion-driven consumers across urban centers.
- Tech-ready formats such as MagSafe-compatible cases will see wider adoption.
- Retailers will refine inventory planning to support frequent product refresh cycles.
- New entrants will target affordable and value-focused designs to capture emerging users.
- Innovation in materials and design processes will shape long-term competitiveness across the region.


