
| REPORT ATTRIBUTE | DETAILS |
|---|---|
| Historical Period | 2020-2023 |
| Base Year | 2024 |
| Forecast Period | 2025-2032 |
| North America SAVE Tourism Market Size 2024 | USD 18,012.51 Million |
| North America SAVE Tourism Market, CAGR | 4.82% |
| North America SAVE Tourism Market Size 2032 | USD 26,256.08 Million |
Market Overview
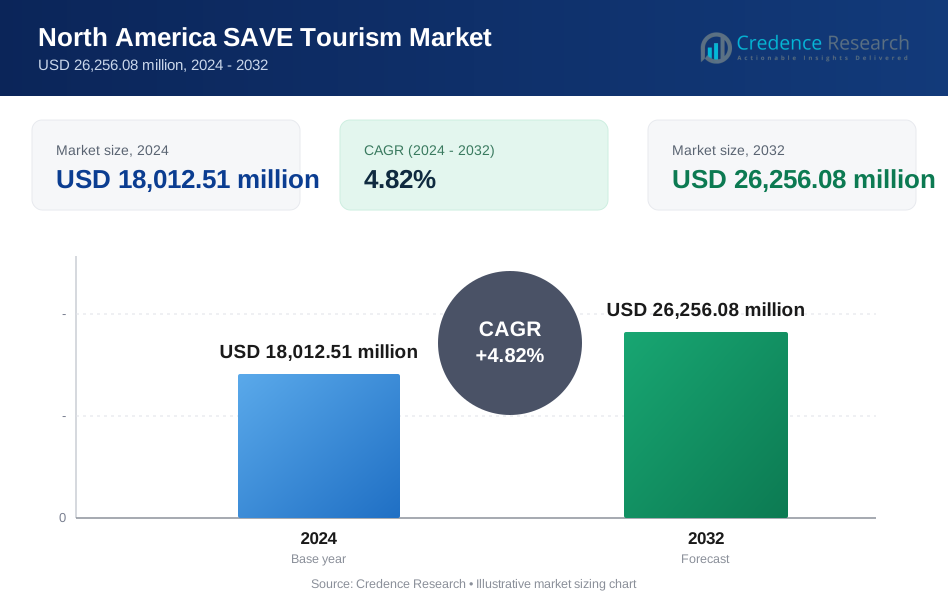
North America SAVE Tourism Market size was valued at USD 18,012.51 million in 2024 and is anticipated to reach USD 26,256.08 million by 2032, at a CAGR of 4.82% during the forecast period (2024-2032).
The North America SAVE Tourism market is driven by growing consumer awareness and demand for sustainable travel options. As environmental concerns rise, travelers are increasingly seeking eco-friendly, responsible tourism experiences that minimize their ecological impact. Governments, tourism boards, and operators are investing in sustainable infrastructure, green accommodations, and eco-conscious travel initiatives, which are further fueling market growth. Additionally, the shift toward accessible tourism, ensuring inclusivity for people with disabilities, is gaining momentum, broadening the market scope. Trends such as the rise of slow travel, nature-based tourism, and the increasing popularity of eco-tours also contribute to the market’s expansion. The integration of technology to enhance the sustainability of tourism, including digital platforms that offer eco-friendly choices, is another key factor driving the sector. Together, these drivers and trends are shaping the future of North America's SAVE Tourism market, creating a robust and dynamic growth trajectory.
The North America SAVE Tourism market is driven by key players across the U.S., Canada, and Mexico, each contributing to the region's sustainable travel offerings. In the U.S., companies like WWF Travel, Earthwatch Institute, and the Wildlife Conservation Society play pivotal roles in promoting eco-tourism and conservation-based travel. Canada follows with significant contributions from organizations such as GVI (North America Vision International) and Conservation Volunteers International Program, which offer volunteer-based travel experiences focused on environmental sustainability. Mexico is emerging as a growing market for SAVE Tourism, with players like PADI and GoAbroad facilitating eco-conscious travel. These key players are shaping the landscape by offering a diverse range of sustainable travel experiences, including wildlife conservation, volunteer programs, and eco-friendly tours. Their efforts are bolstered by strong governmental support for sustainability initiatives, making North America a prominent region for sustainable tourism growth.
Market Insights
- The North America SAVE Tourism market was valued at USD 18,012.51 million in 2024 and is projected to reach USD 26,256.08 million by 2032, growing at a CAGR of 4.82% from 2024 to 2032.
- Growing consumer preference for eco-conscious travel is a significant market driver, with tourists increasingly seeking sustainable and responsible travel options.
- Technological innovations in the tourism sector, such as apps and platforms that promote eco-friendly travel choices, are shaping key market trends.
- Competition is intensifying with major players like WWF Travel, Earthwatch Institute, and GVI, which offer a range of eco-tourism and volunteer-based programs.
- High costs of implementing sustainable infrastructure pose a challenge for smaller operators looking to adopt eco-friendly practices.
- The U.S. holds the largest market share, followed by Canada, while Mexico is steadily emerging as a potential growth region for SAVE Tourism.
- Regional support for sustainable tourism through policies and incentives is driving the growth of eco-tourism in North America.
Market Drivers
Growing Consumer Awareness and Environmental Concerns
The increasing awareness of environmental issues is one of the primary drivers of the North America SAVE Tourism market. As climate change and environmental degradation become more pressing concerns, travelers are shifting toward sustainable tourism practices. For instance, initiatives like the U.S. National Park Service's efforts to reduce carbon emissions and promote sustainable tourism practices have inspired travelers to opt for eco-friendly options, such as green accommodations and responsible wildlife tours. This trend is further supported by the growing availability of sustainable travel choices, such as carbon offset programs, electric vehicle rentals, and eco-conscious activities. As travelers become more knowledgeable about the ecological footprint of their vacations, they are making more deliberate choices that align with sustainability principles, thereby driving the demand for SAVE tourism.
Government and Industry Support for Sustainable Practices
Governments and industry stakeholders in North America are playing a pivotal role in driving the growth of the SAVE Tourism market by implementing policies and investing in sustainable tourism infrastructure. For example, the U.S. government has introduced incentives for businesses adopting green practices, such as tax credits for energy-efficient renovations in hotels and resorts. In addition, tourism boards and private operators are aligning with sustainability goals by incorporating eco-friendly practices in their operations. This includes offering energy-efficient accommodations, waste reduction programs, and responsible sourcing of local products. As these initiatives become more widespread, they not only improve the sector's sustainability but also attract a growing number of eco-conscious travelers, further accelerating market growth.
Increasing Demand for Accessible Tourism
A key driver of the North America SAVE Tourism market is the growing emphasis on accessible tourism. There is an increasing recognition of the need to make travel experiences inclusive for people with disabilities, which aligns with the SAVE principles. Accessibility in tourism encompasses physical, sensory, and cognitive considerations to ensure that all individuals can enjoy travel experiences. This includes offering wheelchair-friendly accommodations, accessible transportation options, and customized itineraries for travelers with specific needs. By promoting accessible tourism, businesses in the sector not only expand their customer base but also meet the rising demand for inclusivity, positioning themselves as leaders in the sustainable tourism movement. This trend supports the overall growth of the SAVE Tourism market as more individuals, regardless of their physical abilities, embrace sustainable travel options.
Technological Advancements and Digital Platforms
Technology is playing a crucial role in driving the growth of the SAVE Tourism market in North America. The rise of digital platforms and mobile apps allows consumers to easily access and book sustainable travel options, from eco-friendly hotels to environmentally conscious activities. These platforms provide travelers with the tools to make informed decisions, such as choosing destinations that promote responsible tourism or selecting transportation modes with a lower carbon footprint. Moreover, technology is enabling the development of innovative solutions to reduce the environmental impact of tourism, such as energy-efficient travel options, virtual tours, and the integration of artificial intelligence to optimize sustainable travel experiences. The seamless integration of technology into the tourism experience not only enhances convenience but also supports the broader movement toward sustainability, making it a key driver of market growth in the region.
Market Trends
Rise of Eco-Conscious Travel Preferences
One of the most significant trends in the North America SAVE Tourism market is the growing preference for eco-conscious travel. Consumers are increasingly choosing vacation options that align with their environmental values, such as nature-based tourism, wildlife conservation programs, and destinations with strong sustainability practices. For instance, the Pacific Northwest region of the United States is leading the way in eco-tourism by offering green resorts powered by renewable energy and outdoor recreation activities that prioritize conservation. Additionally, national parks like Yellowstone and Olympic have implemented sustainable tourism practices to preserve biodiversity while accommodating visitors. This trend reflects a shift from traditional mass tourism to more sustainable alternatives, as travelers prioritize minimizing their ecological footprint. The growing demand for eco-friendly options encourages tourism operators to integrate green initiatives into their services, creating a mutually beneficial relationship that promotes both sustainability and market growth.
Slow Travel and Authentic Experiences
Another prominent trend is the rise of slow travel, which encourages tourists to take a more deliberate and thoughtful approach to their trips. Rather than rushing through multiple destinations, slow travelers prefer to immerse themselves in local cultures, take longer trips, and engage more deeply with the environment. This trend complements the principles of SAVE tourism by promoting meaningful, low-impact travel experiences. By focusing on quality over quantity, slow travelers are helping reduce the negative effects of mass tourism on both the environment and local communities. Moreover, this trend encourages the exploration of lesser-known, less congested destinations, which helps spread the economic benefits of tourism more evenly across regions and supports the sustainability goals of the industry.
Integration of Sustainable Technologies in Tourism
The integration of technology to support sustainability is another key trend shaping the North America SAVE Tourism market. Technological innovations such as green building certifications, energy-efficient transportation, and digital platforms that promote sustainable choices are gaining momentum. For example, apps that help travelers find eco-friendly accommodations or sustainable transportation options are becoming increasingly popular. Additionally, the use of artificial intelligence and big data allows tourism operators to optimize routes, reduce energy consumption, and offer tailored travel experiences that promote sustainability. These technological advancements help minimize the environmental impact of tourism while improving the overall traveler experience, making them essential to the continued growth of the SAVE Tourism market.
Growth of Local and Community-Based Tourism
Community-based tourism, which emphasizes authentic, local experiences, is also a growing trend within the North American SAVE Tourism market. Tourists are increasingly seeking destinations that offer opportunities to engage with local cultures and support local businesses. This form of tourism helps preserve cultural heritage, boosts local economies, and fosters a deeper connection between travelers and the communities they visit. By encouraging sustainable tourism practices at the community level, this trend supports both economic and environmental sustainability. As more travelers seek to make a positive impact, community-based tourism continues to expand, aligning perfectly with the goals of the SAVE Tourism movement.
Market Challenges Analysis
High Costs of Sustainable Tourism Infrastructure
One of the main challenges facing the North America SAVE Tourism market is the high cost of implementing sustainable tourism infrastructure. Developing eco-friendly accommodations, transportation options, and waste management systems requires significant investment from both public and private sectors. For instance, the cost of installing solar panels in hotels can be substantial, often deterring smaller operators from adopting sustainable practices. Additionally, some regions may struggle to fund the development of green infrastructure, which could hinder the overall growth of the market. While larger operators may have the financial resources to transition to sustainable practices, smaller businesses may face difficulties in adopting these changes, thereby affecting the market’s inclusivity and expansion potential.
Resistance to Change and Consumer Awareness
Another challenge is the resistance to change among certain segments of the consumer base and tourism operators. While there is a growing demand for sustainable tourism options, many travelers remain unaware of the environmental impact of their choices or are reluctant to change their travel habits. This lack of consumer awareness can limit the widespread adoption of SAVE tourism. Additionally, some tourism operators may be hesitant to invest in sustainable practices due to concerns about profitability or the complexity of transitioning their business models. Overcoming these barriers requires substantial efforts in education, awareness campaigns, and incentives that encourage both consumers and operators to embrace more sustainable travel behaviors.
Market Opportunities
The North America SAVE Tourism market presents several key opportunities for growth, particularly as the demand for sustainable travel experiences continues to rise. One significant opportunity lies in expanding eco-friendly accommodations and services. As more travelers seek to minimize their environmental impact, there is a growing need for hotels, resorts, and tour operators that prioritize sustainability through energy-efficient practices, waste reduction, and locally sourced products. Investing in green certifications and sustainable practices not only appeals to eco-conscious consumers but also helps businesses differentiate themselves in a competitive market. Additionally, there is an increasing demand for off-the-beaten-path destinations that emphasize conservation, providing a unique opportunity for tourism operators to promote lesser-known regions and experiences while maintaining the principles of sustainability.
Another promising opportunity is the rise of technology-driven solutions to enhance sustainable tourism. Digital platforms that allow travelers to make informed, eco-friendly decisions are gaining popularity, providing opportunities for tech startups and existing travel companies to innovate in the space. By integrating tools that enable easier access to sustainable accommodations, transportation options, and activities, companies can cater to a growing base of environmentally aware consumers. Furthermore, the adoption of smart technology in transportation, such as electric vehicles and energy-efficient travel options, presents opportunities for the tourism industry to reduce its carbon footprint. With consumer interest in sustainable tourism expected to continue rising, there is a clear opportunity for businesses to invest in sustainable infrastructure, digital solutions, and educational campaigns to meet market demand while contributing to the long-term growth of the SAVE Tourism market in North America.
Market Segmentation Analysis:
By Type:
The North America SAVE Tourism market can be segmented into four key types: Scientific, Academic, Volunteer, and Education. The scientific segment involves tourism driven by research and environmental conservation efforts, often organized by institutions or organizations that focus on environmental sustainability. This segment is gaining momentum as more travelers seek to combine leisure with meaningful activities such as wildlife monitoring or conservation projects. Academic tourism, on the other hand, caters to students and researchers attending conferences, study tours, or field research related to sustainability and the environment. Volunteer tourism, which involves tourists engaging in community-based projects or conservation efforts, is experiencing significant growth as individuals seek hands-on opportunities to contribute positively to the environment. Lastly, education-based tourism focuses on learning experiences, such as eco-tourism workshops or sustainability-focused travel programs. This segment is seeing increasing interest, particularly among those looking to gain deeper knowledge about sustainability and environmental stewardship while traveling.
By Age Group:
The age group segmentation of the North America SAVE Tourism market reveals distinct preferences and travel behaviors. The 18-34 years segment is highly engaged in sustainable tourism, driven by a desire for adventure, learning, and environmental responsibility. This group often seeks volunteer opportunities, eco-friendly travel options, and educational experiences that align with their values. The 35-54 years group, which includes professionals and families, values both sustainable practices and the comfort of established travel services. This demographic tends to prefer more structured trips, such as academic tourism or eco-resorts that offer both relaxation and environmental awareness. The 55-64 years age group is becoming more involved in sustainable tourism, particularly through educational experiences or volunteer vacations, as they seek meaningful and enriching travel options. Finally, the 65+ years segment is emerging as a niche market for accessible, eco-friendly travel options, with an increasing demand for slow tourism and educational tours that cater to their specific needs.
Segments:
Based on Type:
- Scientific
- Academic
- Volunteer
- Education
Based on Age Group:
- 18-34 Years
- 35-54 Years
- 55-64 Years
- 65+ Years
Based on Sales Channel:
- Travel Agent
- Online
- Others
Based on the Geography:
- U.S.
- Canada
- Mexico
Regional Analysis
United States
United States holding the largest market share at approximately 75%. The U.S. leads due to its robust tourism infrastructure, widespread awareness of sustainability issues, and growing consumer preference for eco-friendly travel options. Various states in the U.S. are prioritizing green initiatives and eco-tourism, such as California, known for its environmental policies and sustainable tourism offerings. The large number of national parks, wildlife reserves, and conservation programs further contribute to the demand for sustainable travel experiences, attracting eco-conscious travelers from both domestic and international markets. As a result, the U.S. dominates the North American SAVE Tourism market and continues to drive growth within the sector.
Canada
Canada follows with a market share of around 18%, with its rich natural landscapes, including national parks and pristine wilderness areas, making it a prime destination for sustainable tourism. The Canadian government and tourism operators have increasingly focused on promoting eco-tourism initiatives, such as low-impact travel, conservation efforts, and support for Indigenous communities. Canada's commitment to sustainability and the development of green infrastructure is a major driver of growth in the SAVE tourism market. Eco-tourism operators across the country cater to the demand for responsible travel experiences, offering opportunities for tourists to engage with nature, wildlife, and conservation efforts. Additionally, Canada’s emphasis on community-based tourism further aligns with the principles of SAVE tourism, attracting environmentally conscious travelers.
Mexico
Mexico holds a smaller market share of around 7%, but its growing emphasis on sustainable tourism is making it an increasingly popular destination for eco-conscious travelers. The country's diverse ecosystems, including beaches, jungles, and mountain ranges, offer a range of sustainable tourism opportunities, such as eco-lodges, wildlife tours, and community-based tourism initiatives. Mexico is also focusing on promoting responsible tourism practices, particularly in areas like the Yucatan Peninsula and Baja California. While still emerging compared to the U.S. and Canada, Mexico's investment in sustainability infrastructure and partnerships with local communities is steadily boosting its position in the North American SAVE Tourism market.
Key Player Analysis
- WWF Travel
- Earthwatch Institute
- GVI (North America Vision International)
- Wildlife Conservation Society
- PADI
- Conservation Volunteers International Program
- GoAbroad
- Responsible Vacation
- Caribtours Ltd
- ATTITUDE HOSPITALITY LTD (AHL)
- Bookdifferent
- Four Communications
Competitive Analysis
The North America SAVE Tourism market is highly competitive, with several key players shaping the landscape through their eco-conscious travel initiatives and sustainable offerings. Leading players in the market include WWF Travel, Earthwatch Institute, GVI (North America Vision International), Wildlife Conservation Society, PADI, Conservation Volunteers International Program, GoAbroad, Responsible Vacation, Caribtours Ltd, ATTITUDE HOSPITALITY LTD (AHL), Bookdifferent, and Four Communications. These companies differentiate themselves through a wide range of services, including wildlife conservation programs, eco-friendly travel options, volunteer tourism, and educational eco-tourism. For instance, organizations like the Wildlife Conservation Society have developed specialized programs that allow travelers to engage in hands-on conservation efforts, such as habitat restoration and wildlife monitoring. These companies often emphasize unique value propositions such as specialized eco-tourism programs, wildlife conservation efforts, and immersive experiences that align with the growing demand for responsible tourism. Competition within the market is intensifying, with companies continuously innovating to provide sustainable options that cater to the evolving preferences of environmentally-conscious travelers. Many operators are incorporating green certifications, sustainable travel options, and partnerships with local communities to enhance their offerings and ensure authenticity. As sustainability becomes an essential consideration for travelers, companies are also leveraging digital platforms to promote eco-friendly accommodations, travel packages, and activities. However, challenges such as the high cost of implementing sustainable practices and attracting customers who prioritize sustainability over cost remain significant. Companies that succeed in differentiating their offerings and building strong reputations for environmental stewardship will be better positioned to capture the growing demand for SAVE tourism in North America.
Recent Developments
- In June 2024, GoPro, PADI, and the Tourism Authority of Thailand (TAT) collaborated to promote ocean health and sustainable tourism. Activities included GoPro Workshops for capturing underwater beauty and the SeaGlass workshop for repurposing marine debris. The event aimed to inspire responsible travel and marine conservation through storytelling and visual documentation. Additionally, the launch of Thailand's first PADI Instructor course on Koh Tao will enable new instructors to teach the GoPro PADI Distinctive Specialty Course, further supporting marine conservation efforts.
- In January 2024, Agoda expanded its partnership with WWF, pledging USD 1 million to support eight conservation projects in Southeast Asia through the Eco Deals Program. Key initiatives include donating USD 1 per booking to conservation efforts and supporting significant milestones such as volunteer training sessions in Singapore, ranger training in Cambodia, reforestation in Indonesia, and successful anti-poaching patrols in Malaysia.
- In November 2023, Jersey Overseas Aid (JOA) launched its 2024 volunteering projects, expanding from three to four destinations due to high demand. Volunteers could work on diverse initiatives in Malawi, Kenya, Rwanda, and Nepal, including building schools, supporting local teachers, and constructing sand dams. The program, running for over 50 years, focused on sustainability and impactful volunteer work, fostering long-term community connections and personal development. JOA also planned to introduce online volunteering opportunities in Accountancy and Health by Spring 2024.
Market Concentration & Characteristics
The market concentration of North America SAVE Tourism is relatively low, with a wide range of small and medium-sized players offering diverse sustainable travel options. While large organizations dominate certain niches, such as conservation programs and volunteer tourism, smaller companies are also carving out a presence by focusing on specialized eco-tourism experiences and personalized services. The market is characterized by a growing number of eco-conscious travelers seeking responsible and sustainable travel options. Key characteristics include a strong emphasis on environmental stewardship, community-based tourism, and educational travel experiences. As sustainability becomes a key priority for travelers, companies in the market are increasingly investing in green certifications, eco-friendly accommodations, and responsible tourism practices. Additionally, digital platforms and mobile applications are being utilized to connect travelers with sustainable options, further enhancing the market's accessibility and reach. Overall, the market is becoming more competitive as both established and emerging players align with shifting consumer preferences.
Report Coverage
The research report offers an in-depth analysis based on Type, Age Group, Sales Channel and Geography. It details leading market players, providing an overview of their business, product offerings, investments, revenue streams, and key applications. Additionally, the report includes insights into the competitive environment, SWOT analysis, current market trends, as well as the primary drivers and constraints. Furthermore, it discusses various factors that have driven market expansion in recent years. The report also explores market dynamics, regulatory scenarios, and technological advancements that are shaping the industry. It assesses the impact of external factors and global economic changes on market growth. Lastly, it provides strategic recommendations for new entrants and established companies to navigate the complexities of the market.
Future Outlook
- The North America SAVE Tourism market is expected to continue growing as eco-conscious travel becomes more mainstream.
- The demand for sustainable and responsible travel experiences will increase, with more tourists seeking eco-friendly accommodations and activities.
- Governments and tourism bodies are likely to implement more policies promoting sustainability in the travel sector.
- Digital platforms and mobile apps focusing on sustainable travel options will become more prevalent, making eco-tourism more accessible.
- Increased consumer awareness around environmental issues will push more travel companies to adopt green certifications and sustainable practices.
- Collaboration between tourism operators and local communities will foster more authentic and eco-conscious travel experiences.
- The rise of volunteer-based travel programs will create opportunities for individuals to engage in conservation efforts and community-based tourism.
- The market will see innovation in sustainable transportation options, such as electric vehicles and low-carbon travel methods.
- Partnerships with environmental organizations and NGOs will play a crucial role in driving the growth of eco-tourism initiatives.
- The aging population will present a growing market for accessible and eco-friendly travel experiences tailored to older travelers.
Request a Free Sample
Fill in your details and we'll send you a free sample report.
- Sample data tables & charts
- Research methodology
Need a Custom Version of This Report?
Tailor the scope, geography, or segments to your exact requirements.
- Custom geography or segment scope
- Direct access to our analyst team
Frequently Asked Questions
What is the current size of the North America SAVE Tourism Market?
What factors are driving the growth of the North America SAVE Tourism Market?
What are the key segments within the North America SAVE Tourism Market?
What are some challenges faced by the North America SAVE Tourism Market?
Who are the major players in the North America SAVE Tourism Market?
Table of Content
Chapter 1. Report Introduction
- 1.1 Report Description & Purpose
- 1.1.1 Report Title & Market Definition
- 1.1.2 Unique Selling Propositions (USP) & Key Differentiators
- 1.1.3 Value Proposition for Stakeholders
- 1.2 Research Objectives
- 1.2.1 Market Sizing Objectives (Volume & Revenue)
- 1.2.2 Segmentation Objectives
- 1.2.3 Competitive Intelligence Objectives
- 1.2.4 Forecast & Scenario Objectives
- 1.3 Report Scope
- 1.3.1 North America SAVE Tourism Scope – Types & Subtypes Covered
- 1.3.2 Geographic Scope – Regions & Countries Covered
- 1.3.3 Historical Period, Base Year & Forecast Period (2024; forecast to 2032)
- 1.3.4 Inclusions & Exclusions
- 1.4 HS Code & Classification Framework
- 1.5 Currency, Units & Pricing Basis
- 1.6 Target Stakeholders
- 1.7 Limitations & Assumptions
Chapter 2. Executive Summary
- 2.1 Global North America SAVE Tourism Market Snapshot
- 2.1.1 Market Size – Historical (2024) & Forecast (2024-2032) (2024: USD 18,012.51 million → 2032: USD 26,256.08 million)
- 2.1.2 Volume & Revenue – Global Totals
- 2.1.3 Key Market Highlights – Top Five Facts
- 2.2 North America SAVE Tourism Market Segmentation Snapshot
- 2.2.1 Market Split by Region – 2024 vs. 2032
- 2.3 Competitive Snapshot
- 2.3.1 Top 10 Players by Revenue Share – 2024
- 2.3.2 Top 10 Players by Volume Share – 2024
- 2.3.3 Recent Strategic Developments (18-Month Summary)
- 2.4 Key Investment Highlights & Strategic Conclusions
Chapter 3. North America SAVE Tourism Market Dynamics & Industry Analysis
- 3.1 Market Overview & Context
- 3.1.1 North America SAVE Tourism Market Position in the Broader Automotive Value Chain
- 3.1.2 OEM vs. Replacement Market Dynamics
- 3.1.3 Market Maturity & Development Stage by Region
- 3.2 North America SAVE Tourism Market Drivers
- 3.3 North America SAVE Tourism Market Restraints & Challenges
- 3.4 North America SAVE Tourism Market Opportunities
- 3.5 Porter's Five Forces Analysis
- 3.5.1 Threat of New Entrants
- 3.5.2 Bargaining Power of Suppliers
- 3.5.3 Bargaining Power of Buyers
- 3.5.4 Threat of Substitutes
- 3.5.5 Competitive Rivalry – Intensity Assessment
- 3.6 North America SAVE Tourism Value Chain Analysis
- 3.6.1 Upstream – Raw Material/Input Suppliers
- 3.6.1.1 Raw Material/Input 1
- 3.6.1.2 Raw Material/Input 2
- 3.6.1.3 Raw Material/Input 3
- 3.6.2 Midstream – Production/Manufacturing/Service Delivery
- 3.6.2.1 Production/Process Overview
- 3.6.2.2 Key Facility Locations & Capacity by Manufacturer
- 3.6.3 Downstream – Distribution & End Consumer
- 3.6.3.1 Primary Channel – B2B/OEM
- 3.6.3.2 Secondary Channels – Dealer, Retail, Online, Direct
- 3.6.4 Value Chain Profitability Analysis
- 3.6.1 Upstream – Raw Material/Input Suppliers
- 3.7 PESTEL Analysis
- 3.7.1 Political Factors
- 3.7.2 Economic Factors
- 3.7.3 Social Factors
- 3.7.4 Technological Factors
- 3.7.5 Environmental Factors
- 3.7.6 Legal Factors
- 3.8 North America SAVE Tourism Supply Chain Analysis
- 3.8.1 Raw Material/Input Supply Risk Assessment
- 3.8.2 Manufacturing Concentration Risk (Geographic Exposure)
- 3.8.3 Trade Disruption Impact Analysis
- 3.9 Regulatory & Policy Landscape
Note: The regulatory and policy landscape section covers regulations based on their applicability to the market, North America SAVE Tourism category, geography, and scope of the study. Only regulatory frameworks with a material impact on operations, compliance, trade, sustainability, or market access are analyzed in detail.
Chapter 4. Key Investment Pockets & Opportunity Analysis
- 4.1 North America SAVE Tourism Market Attractiveness Analysis
- 4.1.1 By Region – Investment Attractiveness Matrix (Volume × CAGR)
- 4.2 Absolute Revenue Growth Opportunity
- 4.2.1 By Region – Absolute USD Growth Through 2032
- 4.3 Incremental Volume Opportunity
- 4.3.1 By Region – Incremental Volume Through 2032
- 4.3.2 Segment – Incremental Volume
- 4.4 Emerging Submarket Opportunity Deep Dive (Subject to Applicability)
- 4.5 Emerging Market Opportunity Scorecards
- 4.5.1 United States
- 4.5.2 Europe
- 4.5.3 Asia
- 4.5.4 Middle East & Africa
Note: Emerging Market Opportunity Scorecards will be included based on relevance and strategic importance. Regions listed are indicative and may vary depending on data availability and market dynamics.
Chapter 5. North America SAVE Tourism Import-Export Analysis & Trade Flows
- 5.1 Global Trade Overview
- 5.1.1 Global Export Value by Country (2024)
- 5.1.2 Global Export Volume by Country (2024)
- 5.1.3 Global Import Value by Country (2024)
- 5.1.4 Global Import Volume by Country (2024)
- 5.1.5 Net Trade Balance by Country (2024)
- 5.2 Export Analysis – Segment
- 5.2.1 Type 1 (HS Code)
- 5.2.2 Type 2 (HS Code)
- 5.2.3 Type 3 (HS Code)
- 5.2.4 Type 4 (HS Code)
- 5.2.5 Type 5 (HS Code)
- 5.3 Import Analysis – Segment
- 5.3.1 Type 1 (HS Code)
- 5.3.2 Type 2 (HS Code)
- 5.3.3 Type 3 (HS Code)
- 5.3.4 Type 4 (HS Code)
- 5.3.5 Type 5 (HS Code)
- 5.4 Average Unit Trade Prices
- 5.4.1 Average Export Price – Segment & Country
- 5.4.2 Average Import Price – Segment & Source Country
- 5.4.3 Price Trends (2024)
- 5.5 Key Trade Route Analysis
- 5.5.1 Trade Route 1
- 5.5.2 Trade Route 2
- 5.5.3 Trade Route 3
- 5.5.4 Trade Route 4
- 5.5.5 Trade Route 5
- 5.6 Trade Policy Impact Assessment
- 5.6.1 US Anti-Dumping & Section 301 Tariffs
- 5.6.2 EU Customs Union Impact
- 5.6.3 Major Free Trade Agreements
- 5.6.4 USMCA Rules of Origin
Note: Trade policy analysis will be included only where relevant to the North America SAVE Tourism market.
Chapter 6. Competitive Landscape & Company Benchmarking
- 6.1 North America SAVE Tourism Market Concentration & Structure
- 6.1.1 Herfindahl-Hirschman Index (HHI) – vs. 2024
- 6.1.2 Tier 1, Tier 2 & Tier 3 Market Structure
- 6.1.3 Global, Regional & Local Player Dynamics
- 6.2 North America SAVE Tourism Market Share Analysis – 2024
- 6.2.1 Global Revenue Share by Company
- 6.2.2 Global Volume Share by Company
- 6.2.3 Regional Revenue Share
- 6.2.4 Market Share Evolution ( vs. 2024)
- 6.2.5 OEM Segment Share by Company
- 6.2.6 Replacement Segment Share by Company
- 6.3 Production/Delivery Capacity & Facility Analysis
- 6.3.1 Global Installed Capacity
- 6.3.2 Capacity Utilization Rates
- 6.3.3 Production/Output Volume
- 6.3.4 Facility Locations & Capacity Map
- 6.3.5 Planned Capacity Additions
- 6.4 North America SAVE Tourism Competitive Benchmarking Matrix
- 6.4.1 Revenue, Volume, CAGR & Profitability Comparison
- 6.4.2 Channel Revenue Mix
- 6.4.3 Geographic Revenue Exposure
- 6.4.4 R&D Intensity
- 6.4.5 Sustainability Maturity
- 6.5 Strategic Developments in North America SAVE Tourism (Last 24 Months)
- 6.5.1 Mergers, Acquisitions & Divestments
- 6.5.2 New North America SAVE Tourism Launches
- 6.5.3 Facility Expansions
- 6.5.4 Strategic Alliances, Joint Ventures & Partnerships
- 6.5.5 Distribution Expansion & Market Entry
- 6.5.6 Sustainability & ESG Initiatives
- 6.6 Competitive Strategy Mapping
- 6.6.1 Leader, Challenger, Follower & Niche Classification
- 6.6.2 Pricing Strategy Comparison
- 6.6.3 Channel Strategy Matrix
Note: Strategic developments are included based on their materiality and the availability of reliable information.
Chapter 7. Global North America SAVE Tourism Market – By Distribution Channel
- 7.1 Segment Overview
- 7.1.1 Volume & Revenue Split by Channel (2024 & 2032)
- 7.1.2 Channel Mix Evolution (2024-2032)
Chapter 8. Regional Market Analysis – Global Overview
- 8.1 Global Regional Overview
- 8.1.1 Regional Volume Share
- 8.1.2 Regional Revenue Share
- 8.1.3 Regional Volume by Region
- 8.1.4 Regional Revenue by Region
- 8.1.5 Regional Forecast Through 2032
- 8.2 Cross-Regional Segment Analysis
- 8.2.1 By Distribution Channel
- 8.2.2 By Brand/Price Tier
Chapter 9. North America North America SAVE Tourism Market
- 9.1 United States
- 9.2 Canada
- 9.3 Mexico
Chapter 10. Europe North America SAVE Tourism Market
- 10.1 Germany
- 10.2 France
- 10.3 Italy
- 10.4 United Kingdom
- 10.5 Spain
- 10.6 Poland
- 10.7 Russia
- 10.8 Netherlands
- 10.9 Belgium
- 10.10 Sweden
- 10.11 Denmark
- 10.12 Norway
- 10.13 Rest of Europe
Chapter 11. Asia Pacific North America SAVE Tourism Market
- 11.1 China
- 11.2 India
- 11.3 Japan
- 11.4 South Korea
- 11.5 Thailand
- 11.6 Indonesia
- 11.7 Vietnam
- 11.8 Malaysia
- 11.9 Australia
- 11.10 Rest of Asia Pacific
Chapter 12. Latin America North America SAVE Tourism Market
- 12.1 Brazil
- 12.2 Argentina
- 12.3 Colombia
- 12.4 Chile
- 12.5 Rest of Latin America
Chapter 13. Middle East North America SAVE Tourism Market
- 13.1 Saudi Arabia
- 13.2 United Arab Emirates
- 13.3 Turkey
- 13.4 Israel
- 13.5 Iran
- 13.6 Rest of the Middle East
Chapter 14. Africa North America SAVE Tourism Market
- 14.1 South Africa
- 14.2 Egypt
- 14.3 Nigeria
- 14.4 Morocco
- 14.5 Rest of Africa
Chapter 15. North America SAVE Tourism Company Profiles
- 15.1 [Company 01]
- 15.1.1 Company Overview
- 15.1.2 Key Management Personnel
- 15.1.3 Products & Services Portfolio
- 15.1.4 Financial Performance
- 15.1.5 Key Market Focus & Geographic Presence
- 15.1.6 Recent Developments & Strategic Initiatives
Note: The company profile list is preliminary and may change based on research findings, market developments, data availability, and client requirements.
Chapter 16. Appendices
- Appendix A – List of Abbreviations & Acronyms
- Appendix B – Industry Classification Code Reference – Full Series
- Appendix C – Production & Capacity Data Tables
- Appendix D – End-Use & Demand Base Tables
- Appendix E – Consumption & Replacement Rate Assumptions
- Appendix F – ASP Reference Tables
- Appendix G – Manufacturing & Facility Database
- Appendix H – Import-Export Data Tables
- Appendix I – Regulatory Summary Tables
- Appendix J – Primary Research Participant List (Anonymized)
- Appendix K – Primary Research Questionnaire Framework
- Appendix L – Data Sources & Bibliography
- Appendix M – Market Size Divergence & Source Comparison
Chapter 17. Research Methodology
- 17.1 Research Framework & Philosophy
- 17.2 Secondary Research – Sources, Hierarchy & Data Extraction
- 17.3 Data Modeling – Bottom-Up & Top-Down Market Sizing
- 17.4 Primary Research – Stakeholder Framework, LOI & Sample Sizes
- 17.5 Forecast Methodology – Regression, Scenario & Sensitivity Analysis
- 17.6 Quality Control – Four-Layer Validation Framework
- 17.7 Limitations & Standard Assumptions
- 17.8 Disclaimer
