Replacement demand and tariffs shape regional value
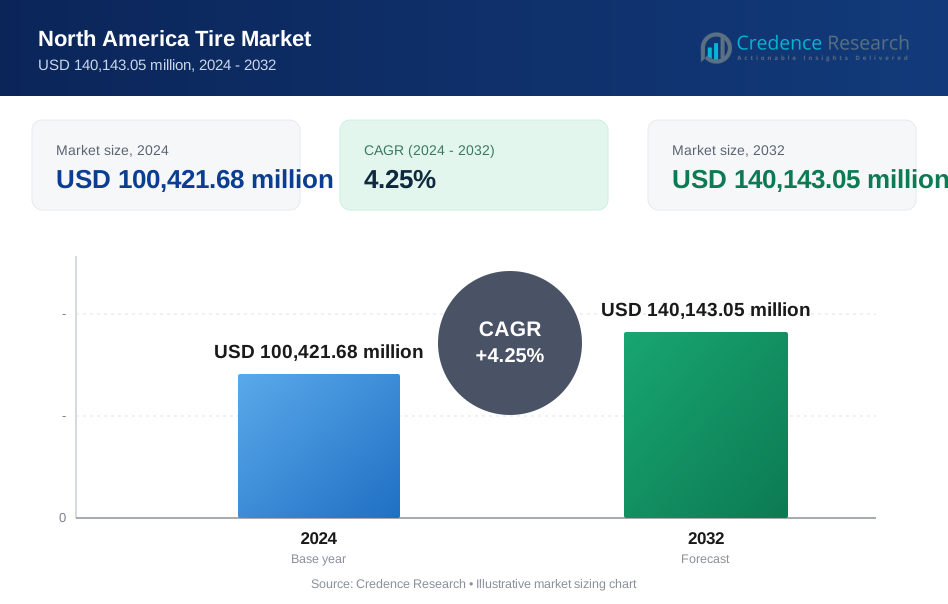
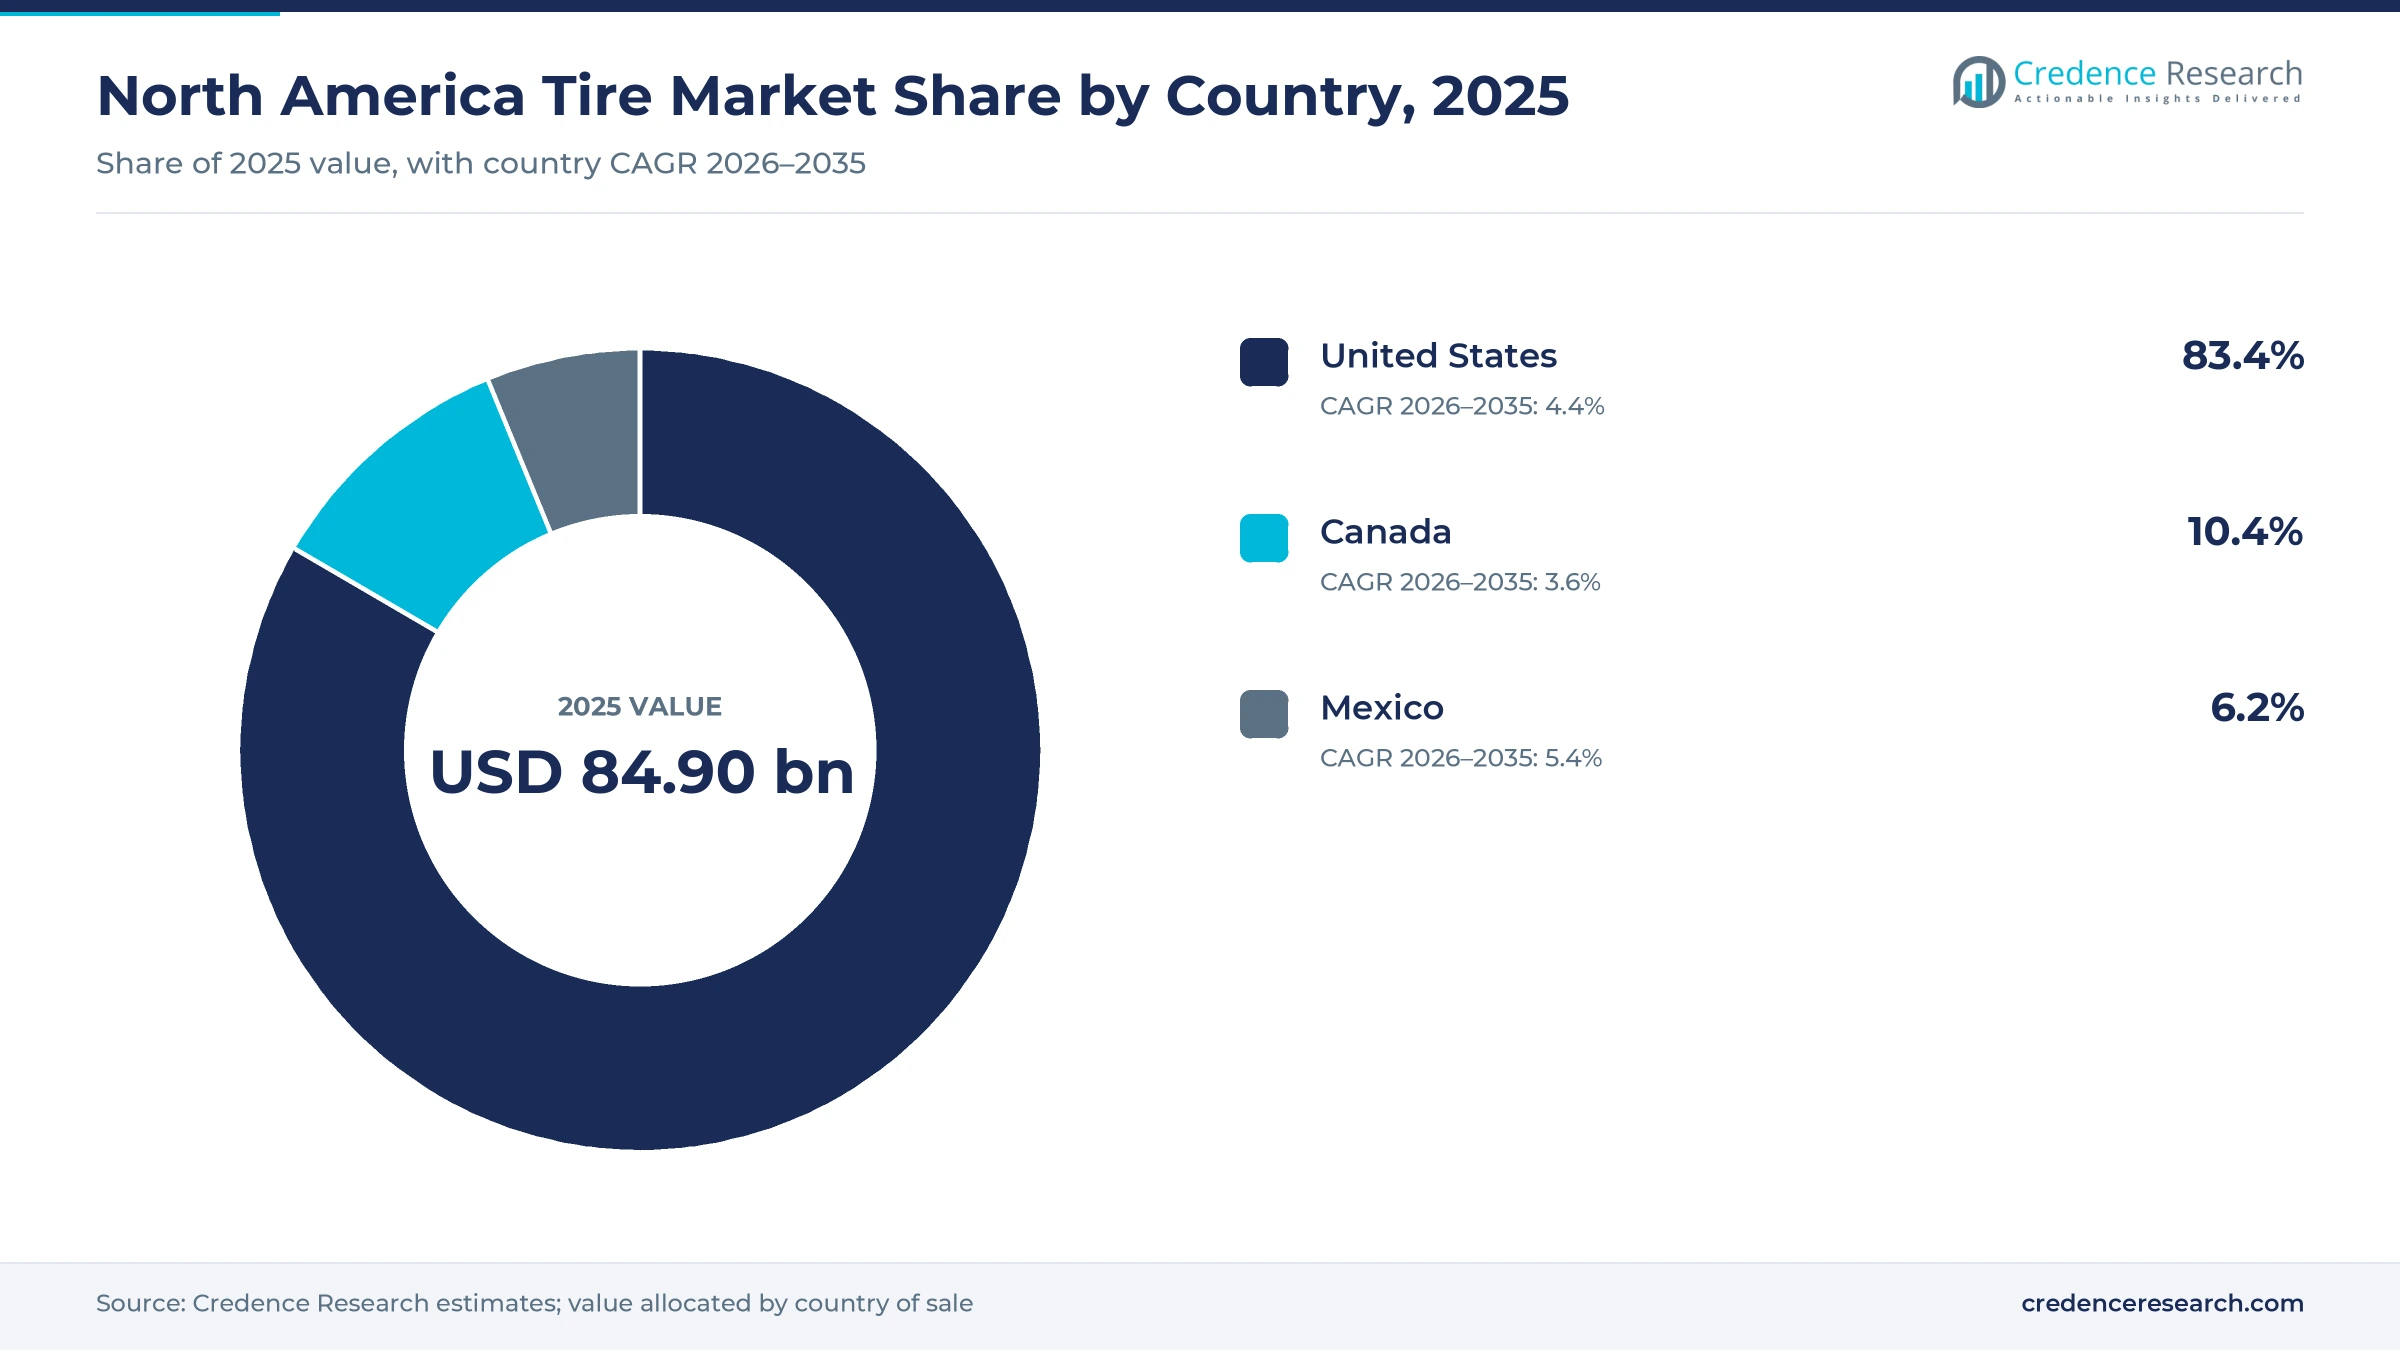
The North America tire market was valued at USD 84.90 billion in 2025 and is projected to increase from USD 88.64 billion in 2026 to USD 130.59 billion by 2035, registering a CAGR of 4.40% during 2026–2035. Demand comes from replacement purchases for an aging car and light truck fleet, from original equipment fitments at U.S., Canadian and Mexican assembly plants, and from truck, bus, farm and off-the-road fleets. The United States held the largest country share, 83.4% in 2025, because it has the largest vehicle fleet and freight network in the region. Mexico is the fastest-growing country at 5.4% a year, as tire makers add capacity there to serve U.S. buyers duty-free. Trade policy is reshaping supply, since the U.S. applied a 25% tariff to imported passenger and light truck tires from May 3, 2025, with an exception for U.S. content eligible under USMCA.
Replacement sets for aging vehicles anchor most value
The market counts the value of new pneumatic tires sold in the United States, Canada and Mexico for passenger cars, light trucks, trucks and buses, motorcycles and special vehicles such as farm, construction and mining equipment. Value is what buyers pay for the tire itself, the shelf price for replacement sets and the contract price for factory fitments, before mounting labor. It covers tires fitted on new vehicles at assembly plants and replacement tires bought through dealers, chains, warehouse clubs, car dealers and online sellers.
The count excludes retreaded tires, inner tubes sold alone, wheels, sensors sold separately and installation labor. Value flows from rubber, carbon black and steel cord suppliers to tire plants in the three countries and in Asia and Europe, then through wholesale distributors to retail bays where most buyers have tires mounted and balanced.
North America Tire Market Insights
- The North America tire market rises from USD 84.90 billion in 2025 to USD 130.59 billion by 2035, a 4.40% CAGR during 2026–2035, as replacement demand from an aging fleet sets the pace.
- The United States held 83.4% of 2025 value, with 336.3 million tire units shipped in 2025, according to the U.S. Tire Manufacturers Association.
- Replacement sales held 83.0% of 2025 value, because U.S. light vehicles averaged 12.8 years of age and 289 million were in operation.
- A 25% U.S. tariff on imported passenger and light truck tires from May 3, 2025, favors plants that qualify under USMCA.
- Goodyear sold its off-the-road business to Yokohama Rubber and Dunlop brand rights to Sumitomo Rubber in 2025, reshaping supply in specialty and replacement lines.
Passenger sets lead while light truck sizes gain
Passenger sets lead as light truck sizes gain share
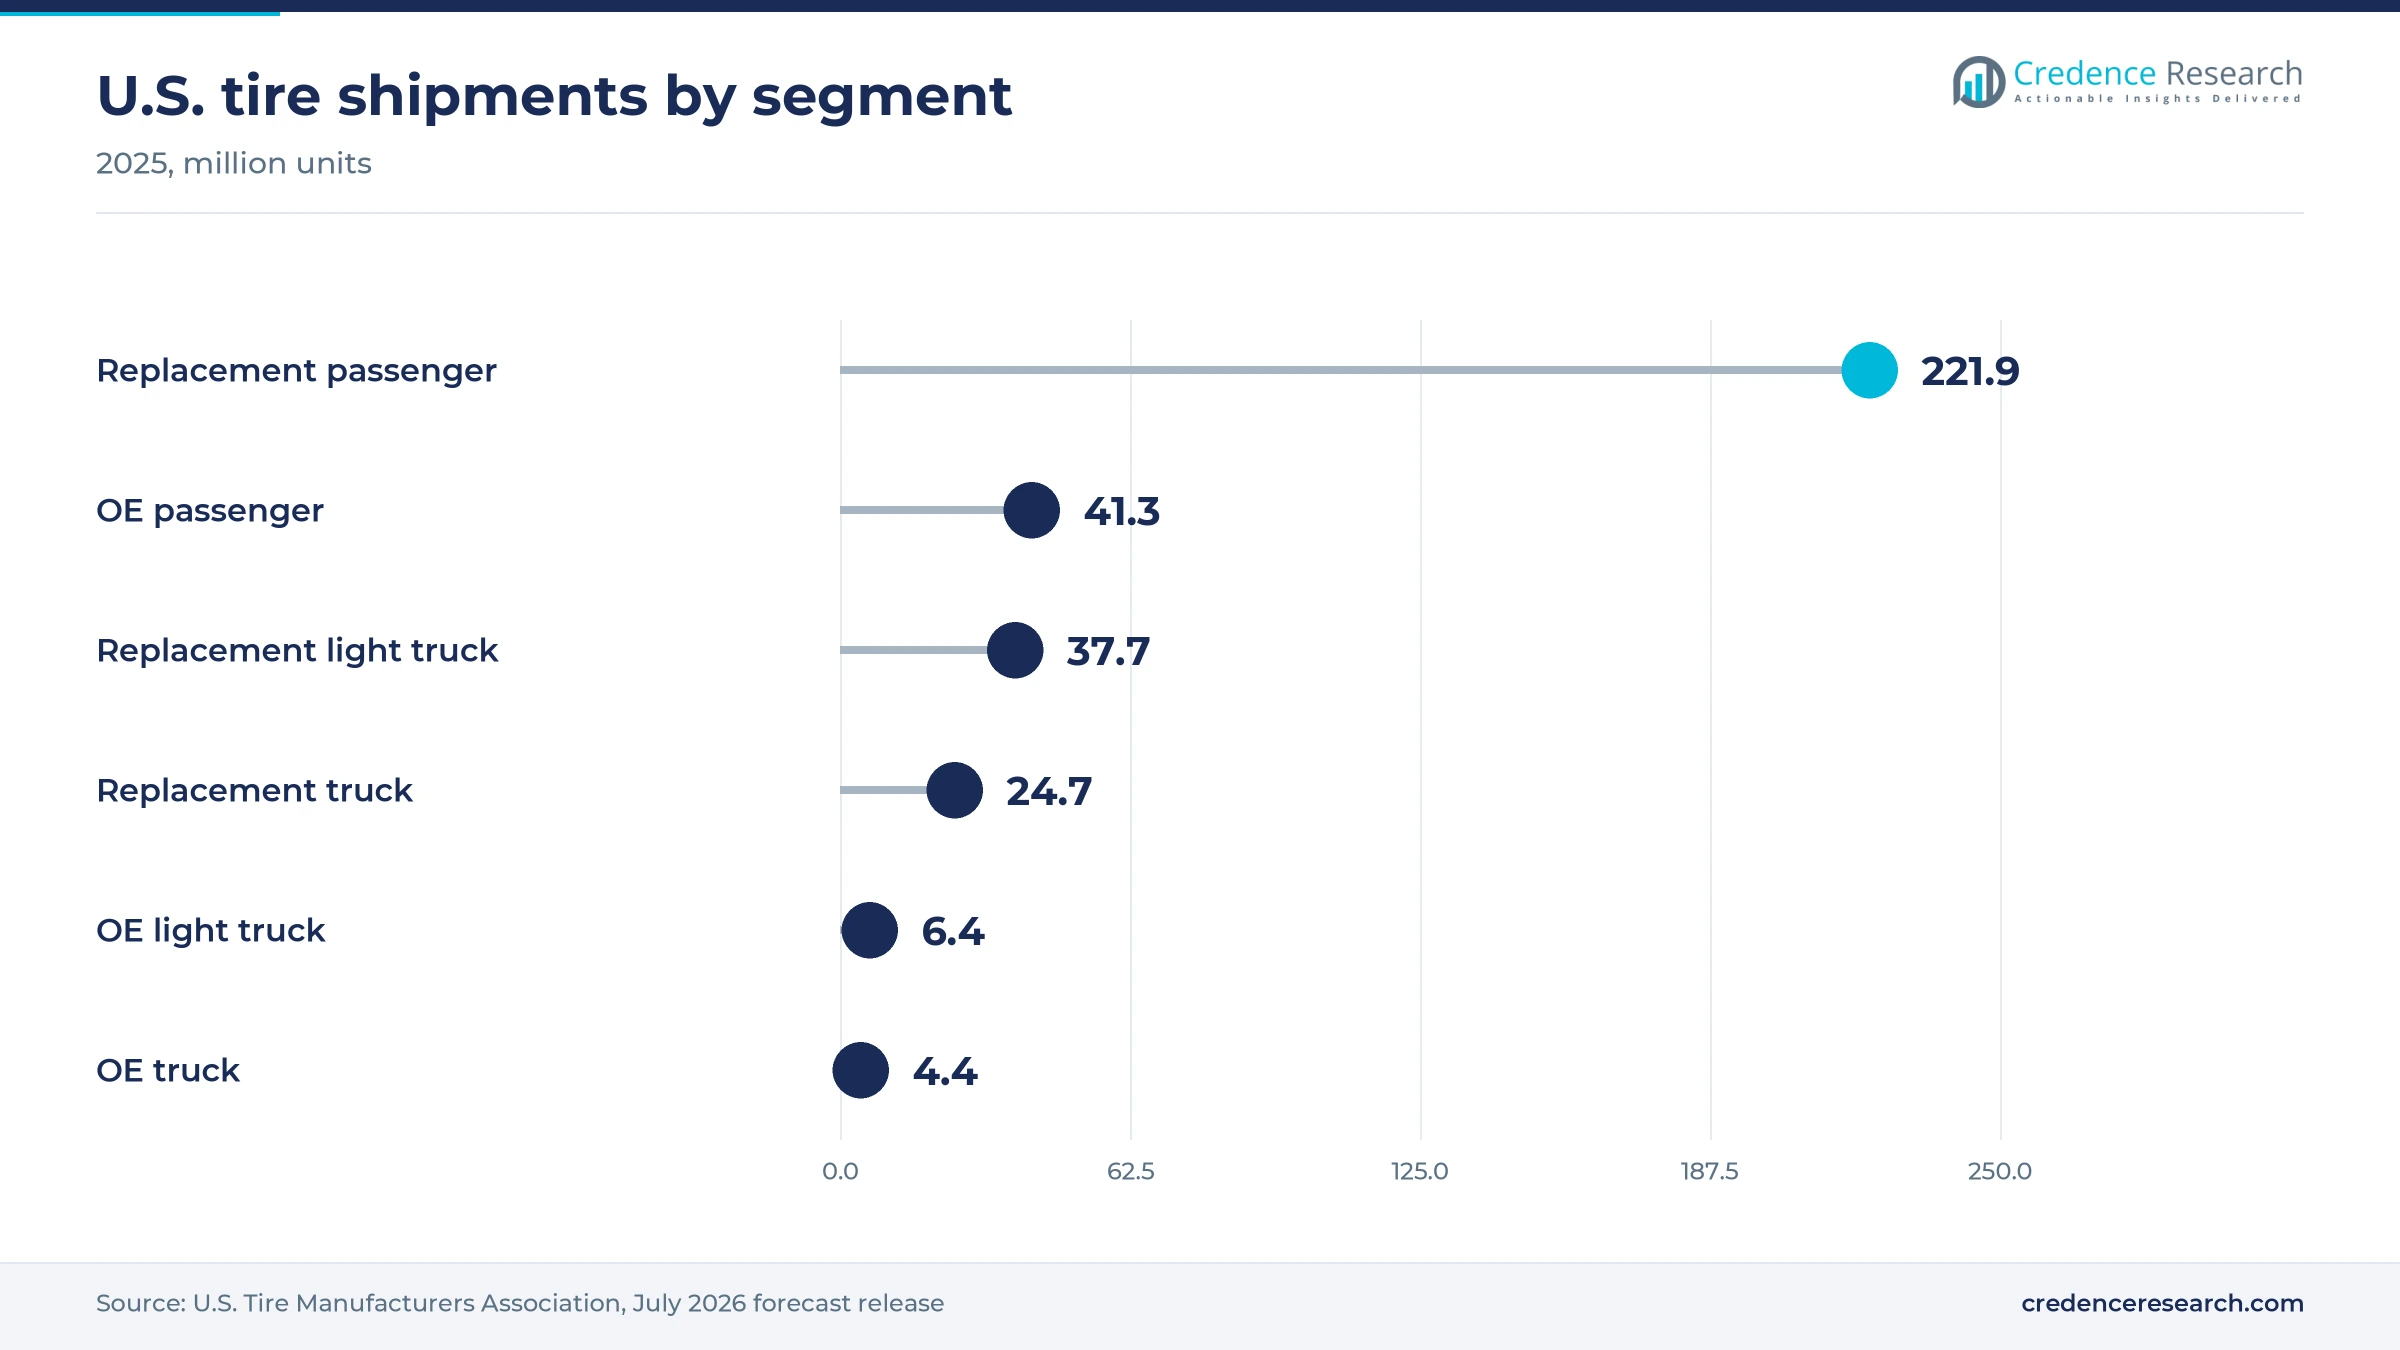
Based on vehicle type, the market is categorized into passenger car tires, light truck tires, truck and bus tires, special vehicle tires and motorcycle tires. Passenger Car Tires led with 52.0% of 2025 value because sedans, crossovers and small SUVs fill most driveways, and passenger sizes made up 41.3 million of the 52.1 million OE tires shipped in the United States in 2025, according to USTMA. Light Truck Tires grow fastest at 5.2% a year as pickups and large SUVs gain in the replacement mix, and Toyo Tire said in August 2025 it would ramp up wide light truck radial output in Georgia, which lifts value per unit.
Replacement buyers outweigh fitments on new vehicles
Based on demand, the market is categorized into OEM and replacement. Replacement led with 83.0% of 2025 value because every vehicle in operation needs new tires several times over its life, while OE volume follows assembly lines. OE passenger, light truck and truck shipments together fell to about 52.1 million units in 2025 from about 55.5 million in 2024, based on U.S. Tire Manufacturers Association segment data. Replacement also grows fastest at 4.6% a year, helped by the fleet aging described in the drivers section. Suppliers with strong dealer pull-through capture most value, while OE programs mainly secure brand exposure.
Radial construction dominates road tire volume
Based on type of tires, the market is categorized into radial and bias. Radial led with 92.0% of 2025 value because passenger, light truck and line-haul truck tires are radial builds, and Hankook expects its Clarksville, Tennessee, plant to make about 10 million passenger and light truck radials and 1 million truck and bus radials a year at full capacity. Radial tires also grow fastest at 4.5% a year, in step with road vehicle replacement demand. Bias tires stay in farm, mining and trailer uses, where Yokohama Rubber took over the Goodyear off-the-road business for about USD 905 million on Feb. 3, 2025, according to a Goodyear filing.
Service bays keep the lead as online orders grow
Based on distribution channel, the market is categorized into dealer/exclusive outlets, online and others. Dealer/Exclusive Outlets led with 61.0% of 2025 value because most tires need mounting and balancing at a service bay, and physical stores still handled about 86% of U.S. replacement tire sales in early 2023, according to Circana. Online grows fastest at 6.2% a year, as the online share rose to 14% from 9% in 2019 and online units grew 45% over three years, Circana reported in April 2023. Online sellers that partner with local installers win buyers who compare prices before booking a bay.
| Segment Group | Leading Sub-segment | Share, 2025 | Fastest-growing Sub-segment | CAGR, 2026–2035 |
|---|---|---|---|---|
| By Vehicle Type | Passenger Car Tires | 52.0% | Light Truck Tires | 5.2% |
| By Demand | Replacement | 83.0% | Replacement | 4.6% |
| By Type of Tires | Radial | 92.0% | Radial | 4.5% |
| By Distribution Channel | Dealer/Exclusive Outlets | 61.0% | Online | 6.2% |
Rim size and brand tier set replacement prices
Tires are priced per unit, but buyers compare the installed price of a set of four, which adds mounting, balancing and disposal fees. Rim size is the biggest single driver of list price within a model line, as the Defender2 range below shows. Manufacturer increases in the first half of 2026 mostly ranged from 1% to 4%, with up to 8% on selected lines, Modern Tire Dealer reported in June 2026. Commercial truck tires carry the highest unit prices, so fleets judge them on cost per mile and casing value. Mid-tier brands that held prices flat have taken share from premium lines, which limits margin recovery.
| Tire and market | Typical price or fee | Basis |
|---|---|---|
| Michelin Defender2 225/65R17, United States | USD 223.09 per tire | TireAgent listing, November 2026 |
| Michelin Defender2, 16-inch to 20-inch sizes, United States | USD 196.59 to 342.00 per tire | TireAgent listing, November 2026 |
| Michelin X Line Grip D 295/75R22.5 drive truck tire, United States | USD 1,041.99 per tire | Priority Tire listing, November 2026 |
| Michelin Energy XM2+ 205/55R16, Mexico | MXN 2,999 per tire | Costco Mexico listing, November 2026 |
| Goodyear Eagle Sport 2 205/55R16, pair, Mexico | MXN 3,359 per pair | Walmart Mexico marketplace listing, November 2026 |
Request a Free Sample
Fill in your details and we'll send you a free sample report.
- Sample data tables & charts
- Research methodology
Older fleets, tariffs and larger rims lift value
Aging vehicles keep replacement demand on a steady cycle
Replacement purchases set the rhythm of regional demand, because a vehicle kept longer needs more replacement sets over its life. U.S. light vehicles averaged 12.8 years of age and 289 million were in operation, according to S&P Global Mobility in May 2025, with a steady 4.5% scrappage rate. Replacement passenger shipments held at 221.9 million units in 2025, nearly level with 2024, the U.S. Tire Manufacturers Association reported. Replacement buyers took 83.0% of 2025 value in this report, against OE fitments that move with vehicle builds. Distributors and dealers with deep inventories of older fitment sizes gain most, while suppliers that rely on new vehicle programs work from a slower base.
Tariffs pull tire capacity and value into the region
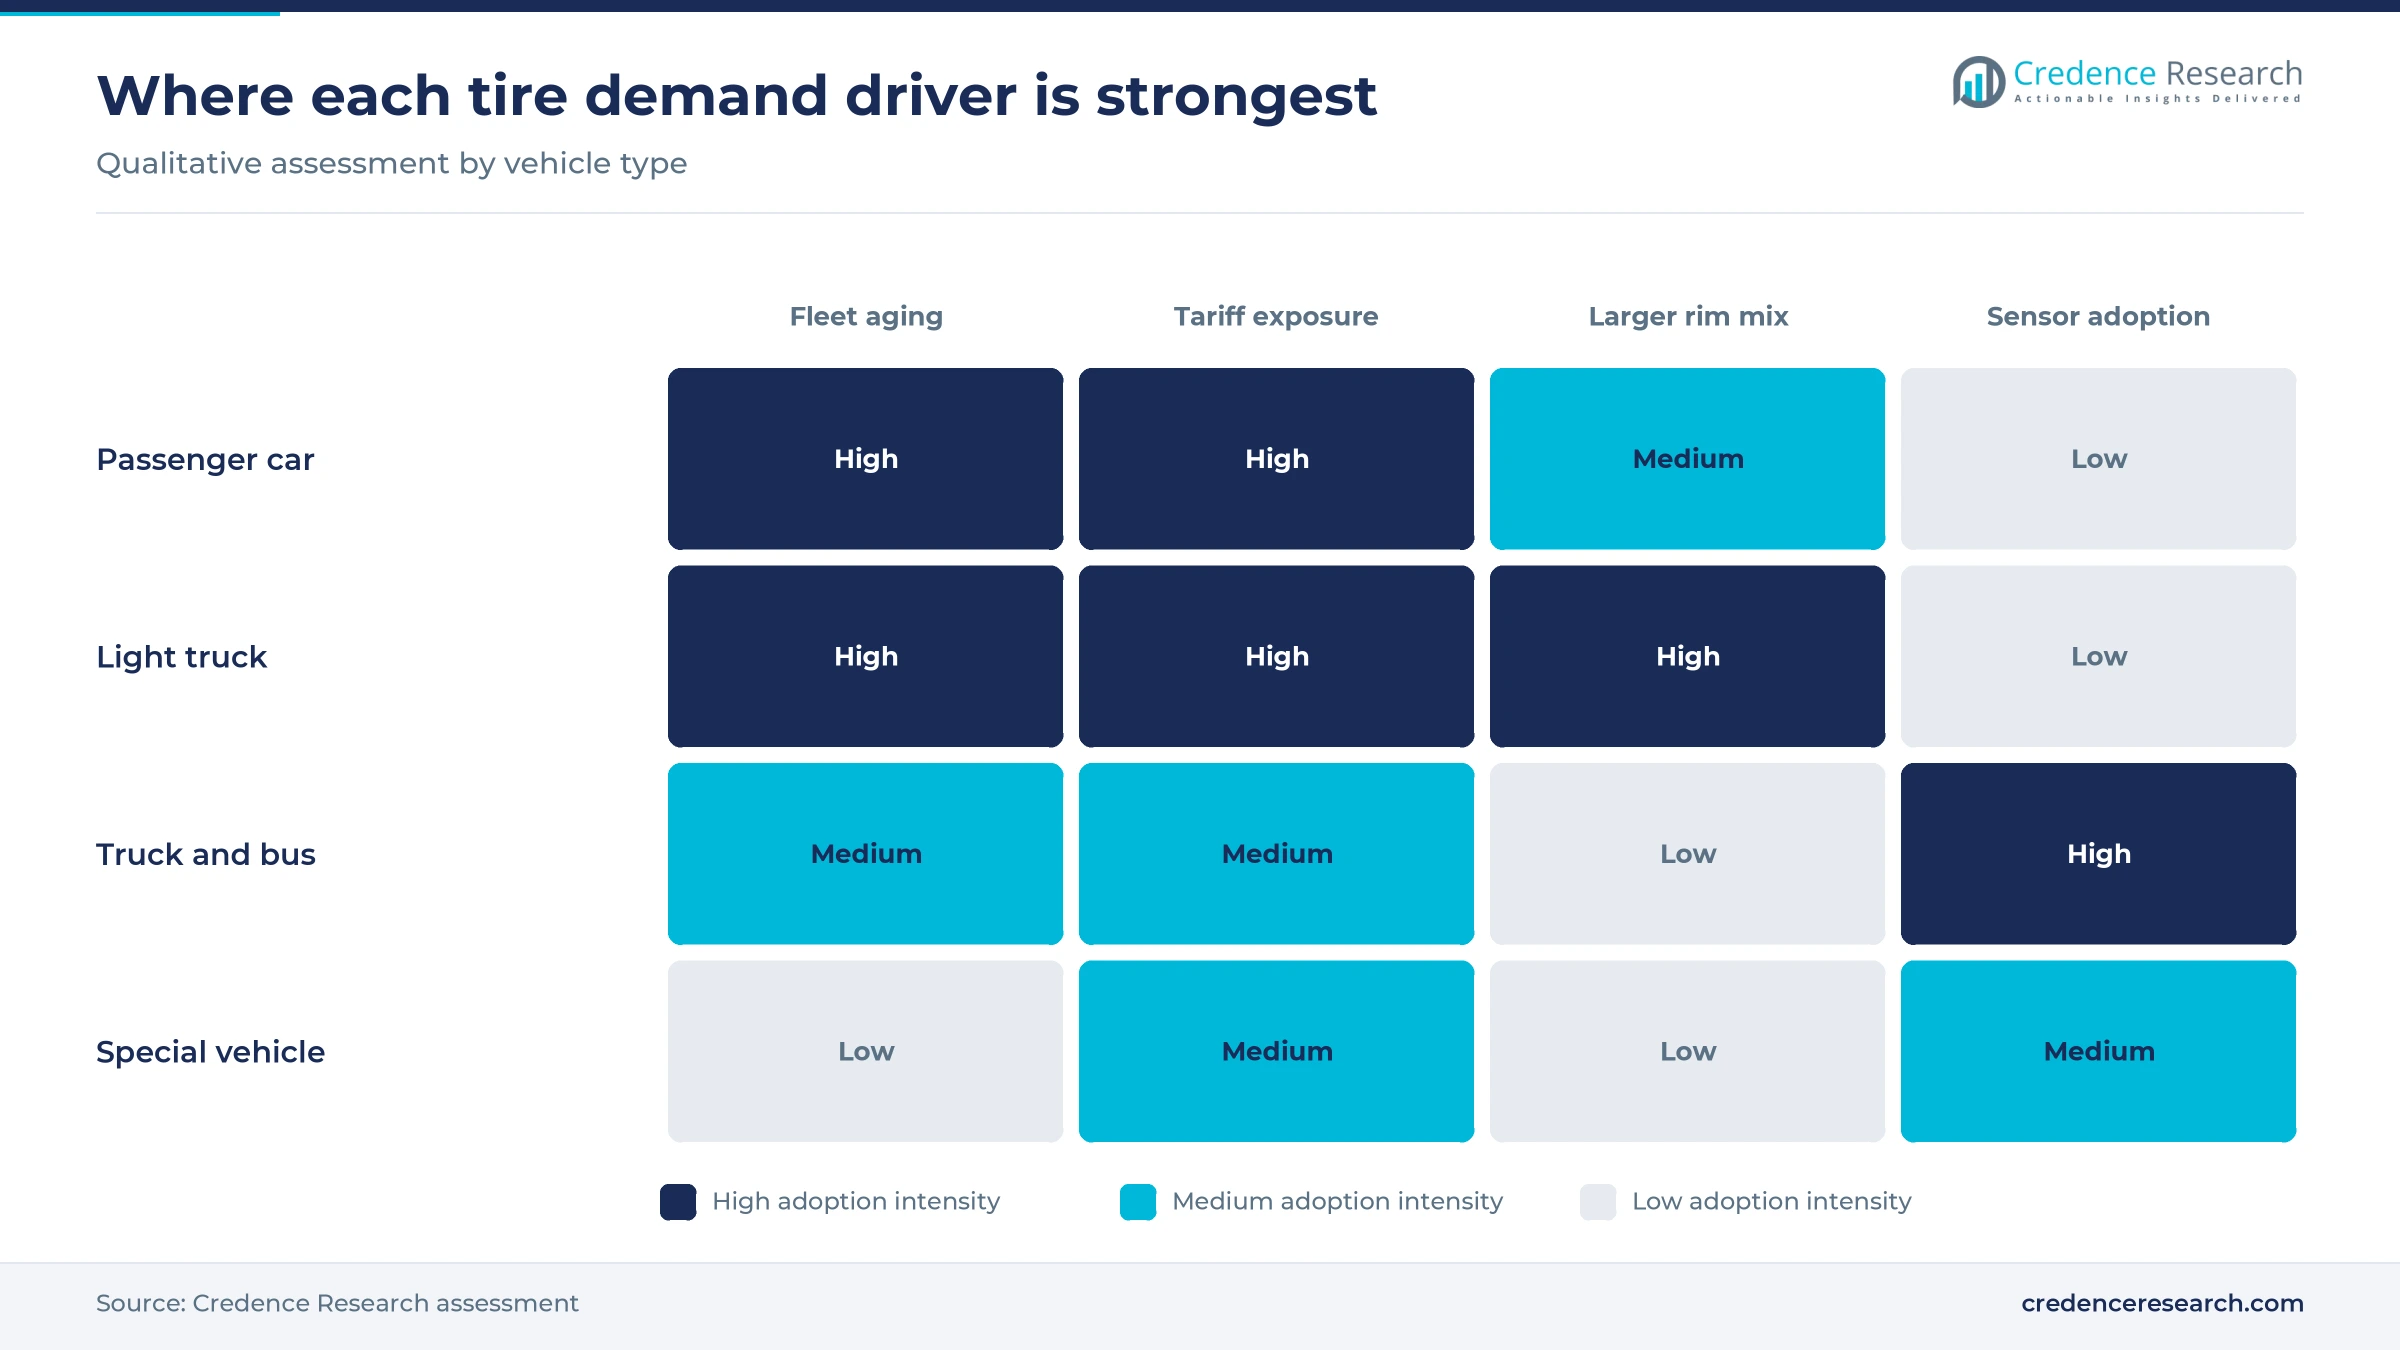
Import tariffs raise the landed cost of offshore supply, which lifts shelf prices and pushes tire makers to build closer to North American buyers. The 25% U.S. tariff on imported passenger and light truck tires took effect on May 3, 2025, with an exception for U.S. content eligible under USMCA, Modern Tire Dealer reported. Pirelli said its Silao plant in Mexico ships a key share of its U.S. supply duty-free and was fully saturated, European Rubber Journal reported in August 2025. Toyo Tire said the same month it would fully use its 14-million-tire plant in White, Georgia, to offset tariff effects. Producers with USMCA-qualified plants gain pricing room, while importers of Asian and European tires absorb higher costs.
Larger wheels and pickups raise value per tire
Buyers are moving to larger rim sizes on SUVs and pickups, which raises the value of each replacement set even when unit volume is flat. TireAgent lists the Michelin Defender2 from USD 196.59 per tire in a 16-inch size to USD 342.00 in a 20-inch size, so rim size alone moves price by about 74%. Replacement light truck shipments reached 37.7 million units in 2025, about 1 million more than in 2024, according to the U.S. Tire Manufacturers Association. Michelin is spending about USD 220 million at three Nova Scotia plants partly to make passenger and light truck tires for larger wheels, Modern Tire Dealer reported in September 2025. Makers with large-rim capacity inside the region capture this mix gain first.
Canadian winter rules create a second set per vehicle
Canada adds demand that the U.S. lacks at scale, because many drivers buy a dedicated winter set on top of their all-season tires. Winter tire use reached 80% of Canadian drivers in 2025, up from 78% in 2024, according to the Tire and Rubber Association of Canada. Quebec has required winter tires on all passenger vehicles from Dec. 1 to March 15 since 2008, so use there is 100%. British Columbia use fell to 64% from 68%, which shows where retailers still have room to convert drivers. Dealers that store and swap seasonal sets earn two service visits a year, and Canada grows at 3.6% a year in this report.
Value tiers, plant moves and sensors reshape supply
Shoppers shift toward value tiers and imported brands
Replacement buyers are shifting toward mid-priced and imported brands to control spending, which caps price gains for premium tire makers. Modern Tire Dealer reported in June 2026 that most manufacturer increases ran 1% to 4%, with up to 8% on selected lines, and that many tier-two and tier-three brands stayed roughly flat while premium brands rose modestly. Thailand remained the top exporter of passenger, light truck and medium truck tires to the U.S. in 2025, although it shipped fewer units than in 2024, the magazine found in its 2026 Facts Issue. Dealers kept ordering imported tires through 2025 despite tariff uncertainty, editor Mike Manges wrote in January 2026. Distributors with broad tier-two lines gain, while premium makers defend share through promotions rather than list increases.
Tire makers shift portfolios and North American plants
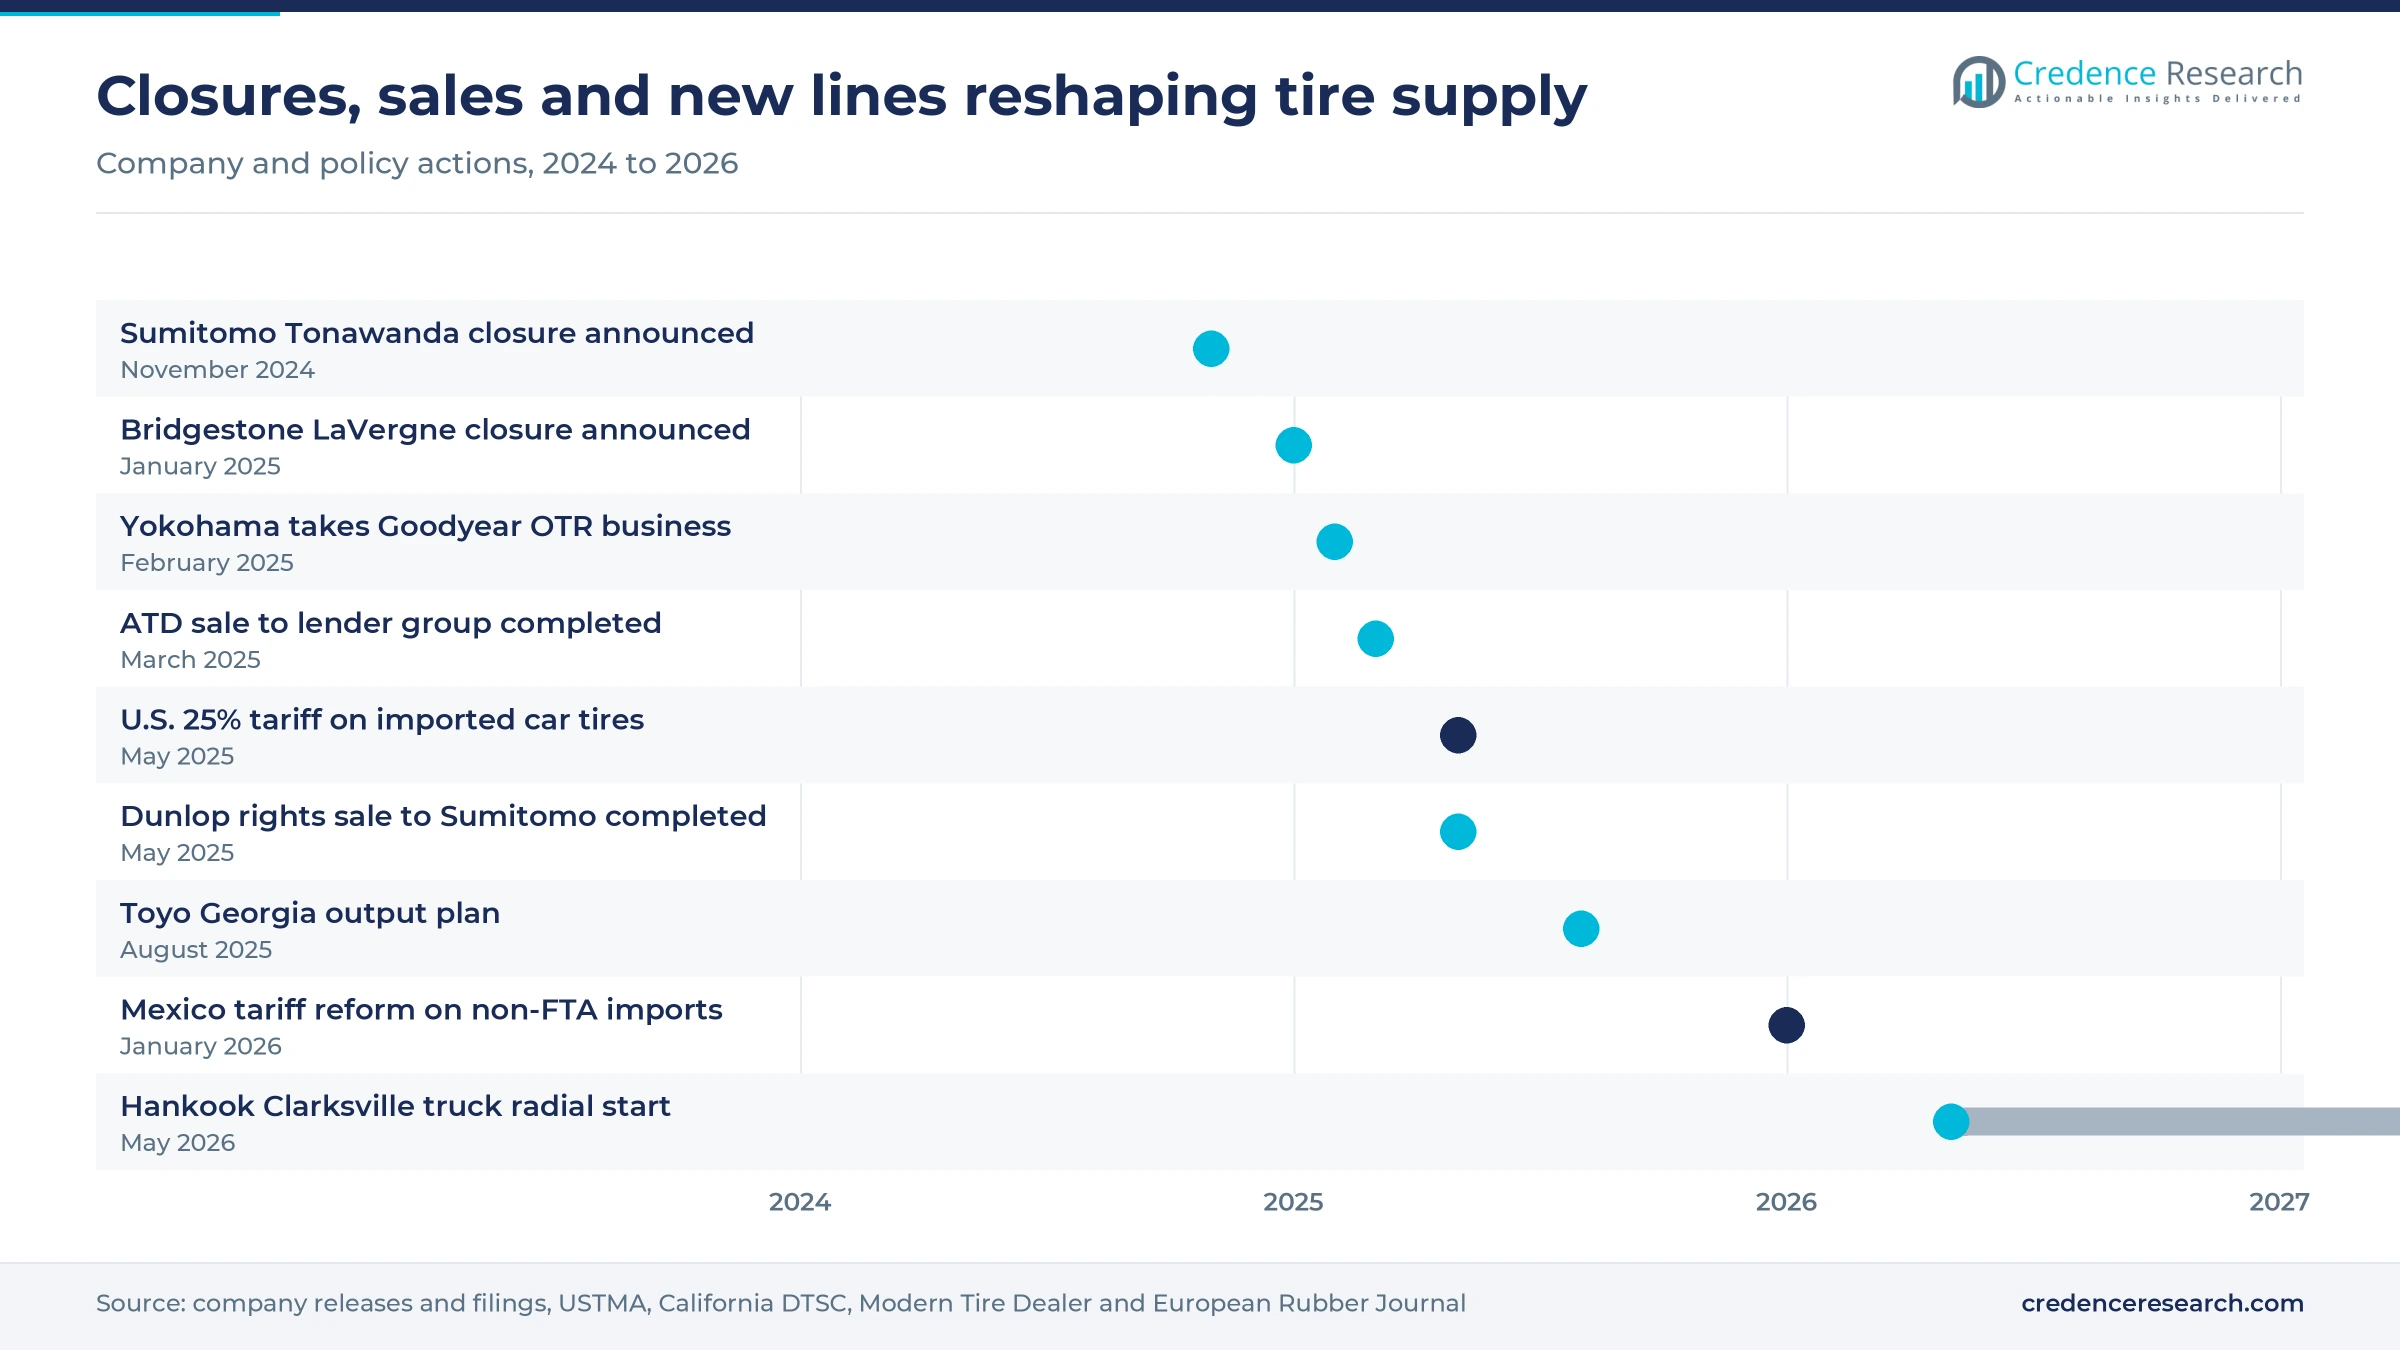
Global tire makers are selling non-core brands and closing older plants to fund modern capacity, which changes who supplies North American buyers. Goodyear sold Dunlop brand rights for North America, Europe and Oceania to Sumitomo Rubber Industries for USD 735 million and announced completion on May 7, 2025, European Rubber Journal reported. Bridgestone closed its LaVergne, Tennessee, truck and bus radial plant in July 2025, affecting about 700 workers, according to its January 2025 announcement. American Tire Distributors completed the sale of substantially all its assets to a lender group in March 2025 and plans to rebuild inventory. Dealers buying Dunlop lines or relying on one wholesaler need to review supply terms and warranties.
Sensor-equipped tires open a fleet data service line
Fleet operators want pressure and wear data before a failure strands a vehicle, which creates an opening for tire makers to sell monitoring services alongside the casing. Goodyear introduced SightLine, its first sensor-enabled tires, for commercial vans in North America and Europe in June 2021. The company plans to build its tire intelligence technology into all new products by 2027, a stated plan rather than a launched line. Replacement truck shipments of 24.7 million units in 2025, according to USTMA, give suppliers a large installed base to equip. Fleets that pair sensor data with automatic inflation systems can cut road calls, so tire makers that bundle data with service contracts lock in repeat casing sales.
Mexico offers a tariff-shielded production base
Mexico offers an opening for suppliers that need USMCA-qualified output and access to a growing local replacement base. INEGI data show Mexico built 3,953,494 light vehicles in 2025, 0.9% fewer than in 2024, and exported 3,385,785 of them, Cluster Industrial reported in January 2026. Pirelli is raising Silao capacity to 8.5 million tires a year by the end of 2025 with a EUR 115 million investment. Mexico raised tariffs on many auto parts from non-FTA countries to between 7% and 36% from Jan. 1, 2026, White & Case noted, although the tire tariff lines under that reform could not be confirmed, an evidence gap. Makers with Mexican plants can serve OE programs and the Mexican aftermarket from one base.
Rubber costs, softer volume and imports squeeze margins
Natural rubber costs lift the cost to build
Raw material inflation squeezes tire makers because list prices lag input costs by several months. Natural rubber prices rose 26% year over year in June 2026, and the average cost to build a tire rose 22.4% in the second quarter, Modern Tire Dealer reported in July 2026. Synthetic rubber fell 18.7%, which only partly offsets the rise, since makers can shift only some compounds toward styrene-butadiene rubber. Mid-tier brands with thin margins are most exposed, because value-minded shoppers resist further price increases.
U.S. unit shipments are forecast to slip in 2026
Unit volume is softening, which leaves price and mix to carry value growth in the near term. The U.S. Tire Manufacturers Association expects total U.S. shipments to fall to 330.3 million units in 2026 from 336.3 million in 2025, with replacement truck units down 1.7 million, according to its August 2026 forecast. Truck fleets that delay purchases hit commercial suppliers hardest, and smaller dealers holding high-cost inventory face markdown risk if demand stays weak into 2027.
Import competition pressures older plants and retreaders
Low-priced imports undercut older North American plants and the retread trade, which shrinks domestic capacity. Sumitomo Rubber said in November 2024 it would close its Tonawanda, New York, plant and lay off all 1,550 employees there, Fortune reported. FleetOwner reported in June 2026 that low-priced imported new tires keep pressure on retreaders, especially among small, price-sensitive fleets. Shops that process retreaded casings for regional fleets are most exposed, while larger retreaders respond by consolidating plants.
6PPD rules force costly compound reformulation
Rules on the antiozonant 6PPD force reformulation work that takes years and adds testing cost. California listed motor vehicle tires containing 6PPD as a Priority Product effective Oct. 1, 2023, according to the Department of Toxic Substances Control, which starts the state's alternatives analysis process for tire makers selling there. The U.S. Tire Manufacturers Association organized a consortium of 16 tire manufacturers to run that analysis, European Rubber Journal reported. Any substitute must match the safety and durability of 6PPD, so smaller importers without compound labs are most exposed.
The United States leads while Mexico adds capacity
| Country | Value, 2025 (USD billion) | Share, 2025 | CAGR, 2026–2035 |
|---|---|---|---|
| United States | 70.81 | 83.4% | 4.4% |
| Canada | 8.83 | 10.4% | 3.6% |
| Mexico | 5.26 | 6.2% | 5.4% |
The United States leads on fleet size and freight volume
The United States held 83.4% of 2025 value and grows at 4.4% a year through 2035. U.S. shipments reached 336.3 million units in 2025, according to USTMA, and most of that volume is replacement demand from an aging fleet. The tariff described in the drivers section shifts purchasing toward plants inside the USMCA zone. Pirelli said its Rome, Georgia, plant meets only 5% of its U.S. demand, with 55% coming from Mexico and 40% from Europe and Brazil, which shows how much supply still crosses borders.
Canada adds seasonal demand from winter tire use
Canada held 10.4% of 2025 value and grows at 3.6% a year, the slowest pace in the region, because its replacement base is mature and member shipments are only now recovering. Seasonal sets lift spending per vehicle, as the winter rules noted above show. Domestic production is concentrated in Nova Scotia, where Michelin is re-equipping its Bridgewater, Waterville and Granton plants, and Waterville makes the X Line Grip D medium truck tire. TRAC members represent about 70% of the Canadian market, and their shipments have trended upward since 2023 back toward 2021 levels.
Mexico grows fastest on export plants and imports
Mexico held 6.2% of 2025 value and is the fastest-growing country at 5.4% a year. Growth rests on OE supply to export-oriented assembly plants and on a replacement base that buys many mid-priced and imported brands. The INEGI production figures noted above keep Mexican plants busy with OE fitments, while premium passenger tires near MXN 3,000 each, as the pricing table shows, keep many buyers in value tiers. Duty-free access to the U.S. under USMCA makes Mexico the main expansion site for Pirelli and other makers.
Divestments, closures and new lines, 2025 to 2026
| Development | Status and market relevance |
|---|---|
| In February 2025, Yokohama Rubber completed its acquisition of the Goodyear off-the-road tire business. | Completed; Goodyear used the proceeds to cut debt under its transformation plan. |
| In May 2025, Goodyear completed the sale of Dunlop brand rights for North America, Europe and Oceania to Sumitomo Rubber Industries. | Completed; Dunlop replacement lines now come from a new brand owner. |
| In July 2025, Bridgestone closed its LaVergne, Tennessee, truck and bus radial plant. | Completed closure; announced in January 2025 as part of a footprint review. |
| In August 2025, Toyo Tire said it would fully use its White, Georgia, plant and add wide light truck radial output. | Plan; production for non-U.S. markets moves to other plants. |
| In May 2026, Hankook started truck and bus radial production in Clarksville, Tennessee. | Operational launch; running at 30% of capacity, with full capacity expected by the end of 2027. |
Sensors, low rolling resistance and EV compounds
- Sensor-equipped tires report pressure, temperature and wear to fleet software, which lets operators plan service before a failure.
- Low rolling resistance compounds cut the energy lost as the tire flexes, which lowers fuel use for long-haul trucks and extends EV range.
- EV-specific tires carry higher loads and resist faster wear from instant torque, with foam liners that reduce cabin noise.
- All-weather tread designs carry the three-peak mountain snowflake mark, which lets some Canadian drivers use one set all year.
Need a Custom Version of This Report?
Tailor the scope, geography, or segments to your exact requirements.
- Custom geography or segment scope
- Direct access to our analyst team
Plant networks and dealer reach decide position
Competition among tire suppliers in North America splits into three distinct groups. Michelin, Bridgestone and Goodyear lead through large U.S., Canadian and Mexican plant networks, broad brand ladders and long OE relationships, and Goodyear also owns the Cooper lines. Continental, Hankook, Yokohama, Toyo, Nokian and Pirelli compete with regional plants plus imports, and several are adding U.S. or Mexican output to limit tariff exposure. Sumitomo Rubber sells Falken and now owns Dunlop brand rights in the region, while Asian importers compete mainly on price in tier-two and tier-three lines. Distributors and dealers judge suppliers on fill rates, warranty support and margin per set, which favors makers that hold inventory close to buyers. Fleet customers add tests of cost per mile, casing quality for retreading and national service coverage.
How concentrated is tire supply in the region?
Supply is concentrated at the manufacturing level and fragmented at retail. Michelin, Bridgestone and Goodyear run the largest networks of North American plants, while Continental, Hankook, Yokohama, Toyo, Pirelli, Nokian and Sumitomo Rubber combine local plants with imports. Entry barriers sit in capital cost, OE approvals and dealer access, since a modern plant such as Hankook's Clarksville site has absorbed about USD 1.6 billion of investment, Transport Topics reported. Margins sit with brand owners in premium and large-rim sizes, while distributors and dealers earn on installation and service work.
Tire makers buyers shortlist in North America
| Company | Type | Role in the market |
|---|---|---|
| Michelin | Full-line tire maker | Makes passenger, light truck and truck tires, including at three Nova Scotia plants |
| Bridgestone Corporation (Bridgestone Americas) | Full-line tire maker | Sells Bridgestone and Firestone passenger, truck and farm tires across the region |
| The Goodyear Tire & Rubber Company (incl. Cooper Tire) | Full-line tire maker | Sells Goodyear and Cooper replacement and OE tires across North America |
| Continental AG | Full-line tire maker | Sells passenger, light truck and commercial truck tires in the region |
| Hankook Tire & Technology | Full-line tire maker | Makes passenger, light truck and truck radials in Clarksville, Tennessee |
| Yokohama Rubber Company | Tire maker | Sells passenger, truck and off-the-road tires, including former Goodyear OTR lines |
| Sumitomo Rubber Industries | Tire maker | Sells Falken tires and owns Dunlop brand rights in North America |
| Toyo Tire Corporation | Tire maker | Makes passenger and light truck tires in White, Georgia |
| Pirelli & C. S.p.A. | Premium tire maker | Supplies premium car tires from Silao, Mexico and Rome, Georgia |
| Nokian Tyres | Specialist tire maker | Makes all-season and all-weather tires in Dayton, Tennessee and sells winter tires in Canada |
Replacement timing and trade rules decide growth
Credence Research's view is that replacement timing and trade rules, not new vehicle builds, will decide North American tire value through 2035. An older fleet keeps replacement demand steady, but buyers are trading down, so value growth depends on large-rim and light truck mix more than on unit volume. Tariffs reward makers with USMCA-qualified plants and push capacity toward Mexico and the U.S. Southeast. Distributors should expect selective price increases tied to natural rubber, while fleets should expect more sensor-linked service offers from tire makers.
Estimates rest on shipment, price and trade data
The report uses 2025 as the base year and 2026 to 2035 as the forecast period. Market values come from the Credence Research model, and the country, vehicle type, demand, construction and channel splits are Credence Research estimates informed by public data. Sources include industry association shipment data, government statistics, regulator notices, company filings and releases, retailer price listings and trade press. The 2025 value was rebuilt from USTMA shipments by segment and listed prices, and it matches, within rounding, the sum of the Credence Research United States, Canada and Mexico tire estimates. No interviews or surveys were used to build these estimates.
Mexico and light truck sizes carry growth to 2035
Credence Research expects North America tire value to reach USD 130.59 billion by 2035 as replacement demand from an aging fleet and a richer size mix offset flat unit volume. Mexico should keep the fastest pace as plants there serve U.S. buyers duty-free, while the United States remains the largest source of value. Light truck tires grow at 5.2% a year during 2026–2035, and online sales gain on physical stores. The main risks are prolonged trading down, natural rubber cost spikes and weaker freight demand.
Tariffs and replacement timing set the range to 2035
The range depends on how long drivers stretch replacement intervals, whether tariffs keep import prices high, and how fast raw material costs pass through to shelf prices. A sustained freight recovery would lift truck and bus demand, while continued trading down to value tiers would hold value per unit flat. Mexico capacity additions matter for supply but shift value between countries more than they change the regional total.
| Scenario | CAGR, 2026–2035 | Value, 2035 | What has to hold |
|---|---|---|---|
| Downside | 3.2% | USD 117.69 billion | Drivers delay replacement, value tiers keep gaining and freight volumes stay weak through 2028 |
| Base | 4.40% | USD 130.59 billion | Replacement cycles, tariff levels and price increases continue at the pace seen in 2025 and 2026 |
| Upside | 5.4% | USD 142.29 billion | Freight recovers, large-rim mix keeps rising and regional plants pass cost increases through |
Frequently Asked Questions
How big is the North America tire market?
How many tires are sold in the U.S. each year?
Which country leads the North America tire market?
Which country grows fastest?
How large is the replacement tire aftermarket in North America?
What do tires cost in the United States and Mexico?
What are the main challenges for tire suppliers?
Who are the main companies in this market?
Table of Content
Chapter 1 Market Segmentation
- 1.1 Segmentation Framework
- 1.1.1 Product and Service Classification
- 1.1.2 Application and End-Use Classification
- 1.1.3 Technology and Solution Classification
- 1.1.4 Customer and Distribution Channel Classification
- 1.1.5 Geographic Segmentation
- 1.1.6 Market Segment Definitions and Boundaries
- 1.2 By Vehicle Type
- 1.2.1 Passenger Car Tires
- 1.2.2 Light Truck Tires
- 1.2.3 Truck and Bus Tires
- 1.2.4 Special Vehicle Tires
- 1.2.5 Motorcycle Tires
- 1.3 By Demand
- 1.3.1 OEM
- 1.3.2 Replacement
- 1.4 By Type of Tires
- 1.4.1 Radial
- 1.4.2 Bias
- 1.5 By Country
- 1.5.1 United States
- 1.5.2 Canada
- 1.5.3 Mexico
Chapter 2 Introduction
- 2.1 Report Objectives and Scope
- 2.2 Product Definition and Industry Terminology
- 2.3 Market Inclusions and Exclusions
- 2.4 Research Process
- 2.4.1 Primary Research and Expert Interviews
- 2.4.2 Secondary Research and Source Review
- 2.4.3 Top-Down and Bottom-Up Estimation
- 2.4.4 Data Triangulation and Verification
- 2.5 Market Size Measurement Basis
- 2.5.1 2025: USD 84.90 billion → 2035: USD 130.59 billion
- 2.6 Historical and Forecast Reference Periods
- 2.6.1 Historical Period: 2018-2025
- 2.6.2 Base Year: 2025
- 2.6.3 Forecast Period: 2025-2035
- 2.7 Research Assumptions and Limitations
Chapter 3 Executive Summary
- 3.1 Market Snapshot and Key Findings
- 3.2 Base-Year Market Size, 2025
- 3.3 Forecast Market Size, 2035
- 3.4 Revenue and Volume Growth Outlook
- 3.5 Key Demand and Supply Indicators
- 3.6 Leading Market Segments
- 3.7 Fastest-Growing Market Opportunities
- 3.8 Regional Performance Highlights
- 3.9 Technology and Industry Transformation
- 3.10 Competitive Landscape Summary
- 3.11 Analyst View and Strategic Implications
Chapter 4 North America Tire Market Trends and Developments
- 4.1 Historical Industry Development, 2018-2025
- 4.2 Recent Market Trends and Developments
- 4.3 Demand and Customer Behavior Trends
- 4.4 Technology and Product Innovation
- 4.5 Artificial Intelligence, Automation and Digitalization
- 4.6 Local Manufacturing and Supply Chain Realignment
- 4.7 Industry Partnerships, Mergers and Acquisitions
- 4.8 Sustainability and Circular Economy Developments
- 4.9 Government and Private Sector Investment Trends
- 4.10 Emerging Business Models and Commercialization
- 4.11 Industry Developments and Announcements
Chapter 5 North America Tire Market Production, Supply and Demand Analysis
- 5.1 Demand Trend and Consumption Analysis, 2018-2025
- 5.2 Demand Forecast, 2025-2035
- 5.3 Production and Output Trend, 2018-2025
- 5.4 Production and Output Forecast, 2025-2035
- 5.5 Installed Capacity and Capacity Utilization
- 5.6 Company-Wise Production Plants and Statistics
- 5.6.1 Installed Production Capacity
- 5.6.2 Actual Production
- 5.6.3 Planned Capacity and Expansion Targets
- 5.7 Supply Chain Structure and Procurement Trends
- 5.8 Supply-Demand Gap and Bottlenecks
- 5.9 Import Dependence and Sourcing Structure
- 5.10 Contract Manufacturing and Outsourcing
- 5.11 Regional Supply and Demand Concentration
Chapter 6 North America Tire Market Pricing Analysis
- 6.1 Pricing Structure and Measurement
- 6.2 Historical Pricing Trends, 2018-2025
- 6.3 Pricing Outlook, 2025-2035
- 6.4 Average Selling Price and Unit Economics
- 6.5 Pricing by Product and Market Segment
- 6.6 Geographic Pricing Differences
- 6.7 Key Input, Energy, Labor and Logistics Costs
- 6.8 Contract Pricing and Purchasing Models
- 6.9 Pricing Sensitivity and Competitive Positioning
- 6.10 Price, Margin and Profitability Implications
Chapter 7 North America Tire Market Dynamics
- 7.1 Market Growth Drivers
- 7.1.1 Demand-Side Drivers
- 7.1.2 Technology and Innovation Drivers
- 7.1.3 Infrastructure and Investment Drivers
- 7.1.4 Regulatory and Policy Drivers
- 7.2 Market Restraints
- 7.2.1 Cost and Affordability Constraints
- 7.2.2 Technology and Adoption Barriers
- 7.2.3 Supply Chain and Operational Constraints
- 7.3 Market Challenges
- 7.3.1 Competitive Pressure and Margin Erosion
- 7.3.2 Skills, Infrastructure and Implementation Gaps
- 7.4 Emerging Market Opportunities
- 7.5 Market Dynamics Impact and Time-Horizon Assessment
Chapter 8 North America Tire Value Chain Analysis
- 8.1 Industry Value Chain Overview
- 8.2 Upstream Suppliers and Critical Inputs
- 8.3 Technology and Component Providers
- 8.4 Manufacturing or Service Delivery
- 8.5 Distribution, Channel Partners and Integrators
- 8.6 Downstream Applications and End Users
- 8.7 Value Addition and Profit Pools
- 8.8 Vertical Integration and Outsourcing
- 8.9 Supplier Concentration and Risk
- 8.10 Supply Chain Localization and Resilience
Chapter 9 North America Tire Market Regulations and Policies
- 9.1 Relevant Laws, Standards and Compliance Frameworks
- 9.2 Product, Service, Safety and Quality Requirements
- 9.3 Government Policies, Incentives and Subsidies
- 9.4 Imports, Exports and Trade Barriers
- 9.5 Public Procurement and Local Content Requirements
- 9.6 Environmental and Sustainability Compliance
- 9.7 Upcoming Policy Changes and Market Implications
Chapter 10 North America Tire Market Hotspots and Opportunities
- 10.1 Market Opportunity Mapping and Growth Hotspots
- 10.2 High-Growth Applications and Customer Groups
- 10.3 Underserved Markets and White-Space Opportunities
- 10.4 Emerging Technology and Product Opportunities
- 10.5 New Capacity and Investment Hotspots
- 10.6 Market Entry and Expansion Opportunities
- 10.7 Distribution and Partnership Opportunities
- 10.8 Near-Term and Long-Term Commercial Potential
- 10.9 Opportunity Attractiveness and Execution Risks
Chapter 11 North America Tire Market Outlook, 2025-2035
- 11.1 Market Size and Analysis
- 11.1.1 Revenue (Market Measurement: 2025: USD 84.90 billion → 2035: USD 130.59 billion)
- 11.1.2 Market Volume and Quantity Sold
- 11.1.3 Historical Market Size, 2018-2025
- 11.1.4 Base-Year Market Size, 2025
- 11.2 Market Forecast, 2025-2035
- 11.2.1 Revenue Forecast to 2035
- 11.2.2 Volume Forecast to 2035
- 11.2.3 CAGR and Year-on-Year Growth
- 11.2.4 Incremental Revenue Opportunity
- 11.3 Forecast Assumptions and Scenario Analysis
- 11.3.1 Base-Case Forecast
- 11.3.2 Optimistic and Conservative Scenarios
- 11.3.3 Technology, Pricing and Policy Sensitivities
- 11.4 Market Attractiveness and Growth Outlook
Chapter 12 North America Tire Market Segmentation and Outlook
- 12.1 Segmentation Summary and Market Shares, 2025
- 12.2 Largest and Fastest-Growing Segments
- 12.3 By Vehicle Type - Market Size and Forecast, 2025-2035
- 12.3.1 Segment Definition and Scope
- 12.3.2 Historical Market Size, 2018-2025
- 12.3.3 Revenue Forecast, 2025-2035
- 12.3.4 Volume Forecast, 2025-2035
- 12.3.5 Base-Year Market Share, 2025
- 12.3.6 Segment CAGR and Growth Drivers
- 12.3.7 Subsegment Market Size and Forecast
- 12.3.7.1 Passenger Car Tires
- 12.3.7.2 Light Truck Tires
- 12.3.7.3 Truck and Bus Tires
- 12.3.7.4 Special Vehicle Tires
- 12.3.7.5 Motorcycle Tires
- 12.3.8 Subsegment Pricing and Adoption Trends
- 12.3.9 Leading Suppliers and Competition
- 12.3.10 Regional Demand and Opportunities
- 12.4 By Demand - Market Size and Forecast, 2025-2035
- 12.4.1 Segment Definition and Scope
- 12.4.2 Historical Market Size, 2018-2025
- 12.4.3 Revenue Forecast, 2025-2035
- 12.4.4 Volume Forecast, 2025-2035
- 12.4.5 Base-Year Market Share, 2025
- 12.4.6 Segment CAGR and Growth Drivers
- 12.4.7 Subsegment Market Size and Forecast
- 12.4.7.1 OEM
- 12.4.7.2 Replacement
- 12.4.8 Subsegment Pricing and Adoption Trends
- 12.4.9 Leading Suppliers and Competition
- 12.4.10 Regional Demand and Opportunities
- 12.5 By Type of Tires - Market Size and Forecast, 2025-2035
- 12.5.1 Segment Definition and Scope
- 12.5.2 Historical Market Size, 2018-2025
- 12.5.3 Revenue Forecast, 2025-2035
- 12.5.4 Volume Forecast, 2025-2035
- 12.5.5 Base-Year Market Share, 2025
- 12.5.6 Segment CAGR and Growth Drivers
- 12.5.7 Subsegment Market Size and Forecast
- 12.5.7.1 Radial
- 12.5.7.2 Bias
- 12.5.8 Subsegment Pricing and Adoption Trends
- 12.5.9 Leading Suppliers and Competition
- 12.5.10 Regional Demand and Opportunities
- 12.6 By Country - Market Size and Forecast, 2025-2035
- 12.6.1 Segment Definition and Scope
- 12.6.2 Historical Market Size, 2018-2025
- 12.6.3 Revenue Forecast, 2025-2035
- 12.6.4 Volume Forecast, 2025-2035
- 12.6.5 Base-Year Market Share, 2025
- 12.6.6 Segment CAGR and Growth Drivers
- 12.6.7 Subsegment Market Size and Forecast
- 12.6.7.1 United States
- 12.6.7.2 Canada
- 12.6.7.3 Mexico
- 12.6.8 Subsegment Pricing and Adoption Trends
- 12.6.9 Leading Suppliers and Competition
- 12.6.10 Regional Demand and Opportunities
- 12.7 Segment Growth Comparison
- 12.8 Segment Attractiveness and Priority Matrix
Chapter 13 North America Tire Geographic Market Outlook, 2025-2035
- 13.1 Regional Market Size and Country-Level Shares, 2025
- 13.2 Country Market Size Comparison, 2025
- 13.3 Country Market Forecasts, 2025-2035
- 13.4 Subregional Industrial and Demand Clusters
- 13.5 Intra-Regional Pricing and Cost Differences
- 13.6 Cross-Border Trade and Supply Networks
- 13.7 Regional Supply and Demand Balances
- 13.8 Country Opportunity Comparison and Prioritization
Note: Every listed country is covered on the structure shown under the first country.
Chapter 14 North America Tire Technology, Innovation and Sustainability Outlook
- 14.1 Technology Landscape and Maturity
- 14.2 Product, Process and Service Innovation
- 14.3 AI, Automation and Digital Tools in the Industry
- 14.4 Technology Adoption and Performance Benchmarking
- 14.5 Innovation Pipeline and R&D Investment
- 14.6 Patent and Intellectual Property Trends
- 14.7 Energy Efficiency and Resource Management
- 14.8 Sustainability, Recycling and Circularity
- 14.9 Technology Roadmap, 2025-2035
- 14.10 Risks of Obsolescence and Technology Substitution
Chapter 15 North America Tire Market Key Strategic Imperatives
- 15.1 Growth and Market Entry Priorities
- 15.2 High-Return Products and Segments
- 15.3 Pricing, Profitability and Cost Optimization
- 15.4 Technology Investment and Product Differentiation
- 15.5 Supply Chain Localization and Resilience
- 15.6 Distribution and Customer Acquisition
- 15.7 Partnership, Acquisition and Capacity Strategy
- 15.8 Regional Expansion Priorities
- 15.9 Short-, Medium- and Long-Term Actions
Chapter 16 Competition Outlook
- 16.1 Industry Competition Characteristics
- 16.2 Market Structure and Concentration
- 16.3 Market Share and Competitive Positioning, 2025
- 16.4 Company-Wise Revenue and Product Benchmarking
- 16.5 Production and Service Capacity Benchmarking
- 16.6 Technology, Pricing and Differentiation
- 16.7 Regional Footprint and Distribution Strength
- 16.8 Mergers, Acquisitions and Strategic Alliances
- 16.9 New Entrants and Competitive Threats
- 16.10 Porter's Five Forces and Industry Attractiveness
- 16.11 Competitive Outlook, 2025-2035
Chapter 17 Company Profiles
- 17.1 Company Coverage and Selection Criteria
- 17.2 Michelin
- 17.2.1 Business Description
- 17.2.2 Company Ownership and Geographic Presence
- 17.2.3 Product and Service Portfolio
- 17.2.4 Manufacturing and Operating Footprint
- 17.2.5 Production Capacity and Expansion Plans
- 17.2.6 Financial Performance and Investment
- 17.2.7 Market Share and Competitive Position
- 17.2.8 Technology and Innovation Capabilities
- 17.2.9 Strategic Alliances or Partnerships
- 17.2.10 Recent Developments
- 17.2.11 Growth Strategy and Outlook
- 17.3 Bridgestone Corporation (Bridgestone Americas)
- 17.4 The Goodyear Tire & Rubber Company (incl. Cooper Tire)
- 17.5 Continental AG
- 17.6 Hankook Tire & Technology
- 17.7 Yokohama Rubber Company
- 17.8 Sumitomo Rubber Industries
- 17.9 Toyo Tire Corporation
- 17.10 Pirelli & C. S.p.A.
- 17.11 Nokian Tyres
- 17.12 Other Relevant Market Participants
Note: Every listed company is profiled on the structure shown under the first company. The company list is preliminary and may change based on research findings, market developments, data availability and client requirements.
Chapter 18 Disclaimer
- 18.1 Research and Forecast Disclaimer
- 18.2 Data Source and Estimation Limitations
Note: The depth of individual sections depends on data availability for this market. Volume, capacity, trade and other unit-based metrics are included where applicable.