
Market overview
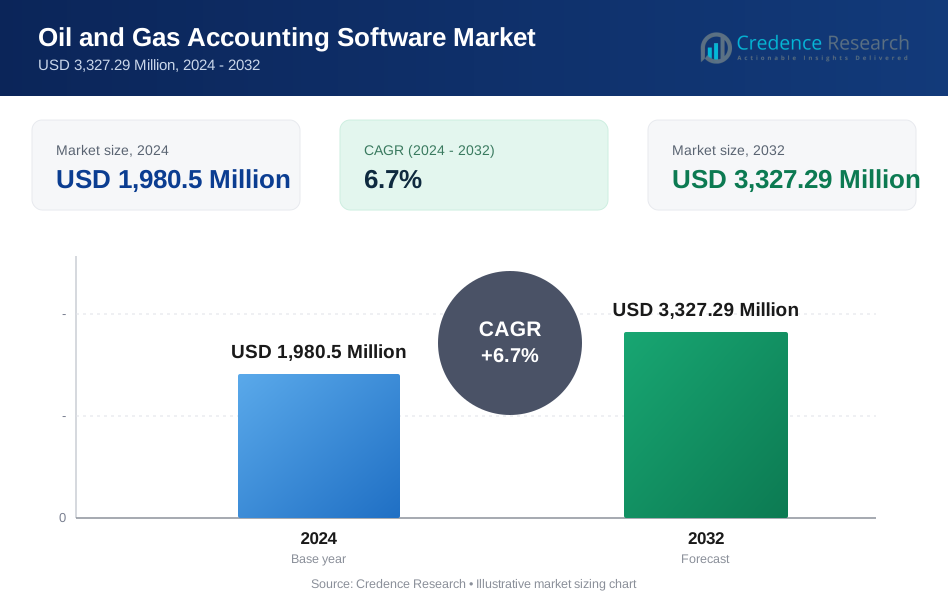
The Oil And Gas Accounting Software Market size was valued USD 1,980.5 Million in 2024 and is anticipated to reach USD 3,327.29 Million by 2032, at a CAGR of 6.7 % during the forecast period.
| REPORT ATTRIBUTE | DETAILS |
|---|---|
| Historical Period | 2020-2023 |
| Base Year | 2024 |
| Forecast Period | 2025-2032 |
| Oil and Gas Accounting Software Market Size 2024 | USD 1,980.5 Million |
| Oil and Gas Accounting Software Market, CAGR | 6.7% |
| Oil and Gas Accounting Software Market Size 2032 | USD 3,327.29 Million |
The Oil And Gas Accounting Software Market features prominent companies such as SAP SE (Germany), Oracle Corporation (USA), Microsoft Corporation (USA), Infor Inc. (USA), Quorum Software (USA) and P2 Energy Solutions (USA). North America leads the market with a regional share of 40%, driven by major upstream, midstream and downstream operators and significant adoption of digital accounting platforms. These companies differentiate by offering scalable, cloud‑based solutions, deep industry functionality and strong global service networks. Their combined strength positions them to address complex accounting needs, integrate with ERP environments and support regulatory compliance across multiple geographies.
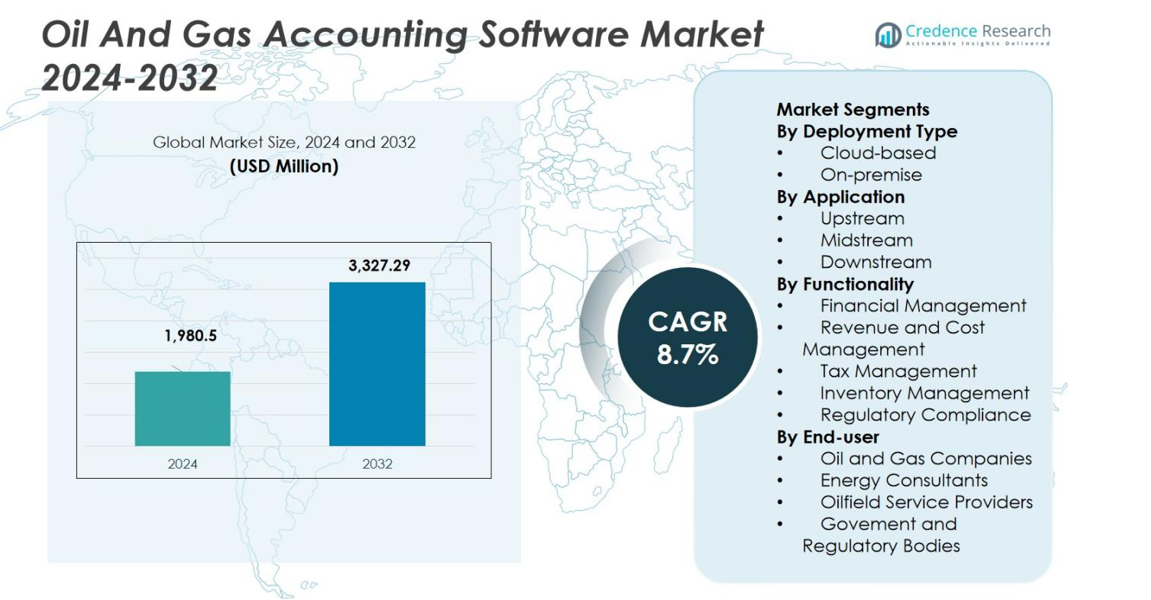
Market Insights
- The Oil And Gas Accounting Software Market size stood at USD 1,980.5 Million in 2024 and is projected to reach USD 3,327.29 Million by 2032, registering a CAGR of 6.7%.
- The dominant deployment segment is cloud‑based, capturing 60% of the market share, driven by scalability, remote access and reduced upfront infrastructure costs, while on‑premise holds the remaining 40%.
- A key trend shows the upstream application segment leading with a 45% share, while midstream and downstream account for 30% and 25% respectively, reflecting higher complexity and capital intensity in upstream operations.
- Restraints in the market include high implementation costs and the complexity of legacy system integration, which slow adoption especially in large enterprises with established infrastructures.
- Regional analysis shows North America leading with a 40% share, followed by Europe at 30%, Asia‑Pacific at 15%, Latin America at 8%, and Middle East & Africa at 7%, as digital transformation and regulatory pressures vary significantly by geography.
Market Segmentation Analysis:
By Deployment Type
In the deployment‑type segment of the oil & gas accounting software market, the cloud‑based sub‑segment holds the dominant share at 60%, with on‑premise solutions capturing the remaining 40%. Cloud‑based deployment is driven by operators’ growing preference for scalability, remote accessibility, and lower upfront capital expenditure, especially as many firms expand globally and adopt hybrid workforces. On‑premise installations, while smaller, continue to be adopted by large legacy operators that prioritize data control and existing infrastructure optimization.
- For instance, Oracle NetSuite's cloud ERP enables real-time financial and operational visibility for oil and gas firms, helping reduce manual work and speeding up key processes.
By Application
Within the application segment, the upstream (exploration & production) sub‑segment is the dominant player, accounting for 45% of the market share. The upstream sector drives demand due to its high capital intensity, complex joint‑venture accounting, fluctuating commodity prices, and need for robust cost and revenue tracking. Midstream and downstream segments, while growing, lag upstream, with midstream holding around 30% and downstream at 25%, as they face fewer complexity layers and have simpler financial structures.
- For instance, midstream operators like Enterprise Products Partners focus on optimizing pipeline operations through replacement CAPEX and brownfield expansions, reflecting the simpler financial and operational structure compared to upstream activities.
By Functionality
In the functionality segment, the financial management (or capital‑expenditure/financial reporting) sub‑segment leads, capturing 35% of the market share. This dominance is driven by oil & gas firms’ pressing need to manage large‑scale investments, multi‑entity structures, and regulatory financial disclosures. Sub‑functions such as revenue & cost management hold 25%, tax management 20%, inventory management 10%, and regulatory compliance 10%, as they follow behind financial management due to the foundational nature of finance‑centric processes in upstream operations.
Key Growth Drivers
Operational Efficiency and Cost Reduction
The market for oil‑and‑gas accounting software is significantly driven by companies’ need to streamline complex financial and operational workflows, increase process automation and reduce manual errors. Organizations operating in the upstream, midstream, and downstream segments encounter large volumes of transactions, joint‑venture accounting, and multi‑entity consolidation issues, prompting the adoption of specialized software. The push to optimize resource allocation and enhance productivity creates demand for solutions that integrate operational data with financial accounting. This imperative for improved efficiency constitutes a major catalyst for the growth of the oil & gas accounting software market.
- For instance, IFS ERP offers a comprehensive oil and gas accounting platform that integrates financial and operational data, enabling real-time automation of key accounting tasks such as invoicing and revenue allocation, thereby improving productivity and financial accuracy.
Regulatory Compliance and Reporting Requirements
Strict and evolving regulations across financial reporting standards, environmental obligations, and industry‑specific compliance drive oil & gas companies to upgrade their accounting systems. Firms face mounting pressure from regulatory bodies to deliver transparent audit trails, accurate cost‑and‑revenue tracking, and compliance aligned with global frameworks. Consequently, software capable of handling complex requirements – such as multi‑currency, joint interest billing, tax, and reporting workflows – sees heightened demand. This regulatory imperative therefore acts as a second major growth driver for the market.
- For instance, IFS software enables companies to meet stringent regulatory requirements such as GAAP and SOX while supporting market-leading state regulatory frameworks.
Digital Transformation and Cloud Adoption
The drive toward digitalisation within the oil & gas sector – including cloud‑based deployments, real‑time analytics, and advanced integration capabilities – underpins growth in the accounting‑software segment. The shift to scalable cloud‑based solutions enables remote access, faster deployment, and improved collaboration across global operations. As oil‑and‑gas operators move to modernize legacy infrastructures and adopt next‑generation technologies (such as AI, ML, and IoT), the need for accounting solutions that support this transformation becomes critical. This forms a third significant growth driver in the market.
Key Trends & Opportunities
Emergence of Cloud‑Based and SaaS Models
The increasing prevalence of cloud‑based deployment models and SaaS offerings represents a clear trend and opportunity in the oil & gas accounting software market. Organisations are increasingly favouring these models because of their lower upfront capital costs, quicker implementation times, and improved scalability for geographically dispersed operations. The opportunity lies in vendors expanding cloud platforms tailored for upstream, midstream, and downstream workflows, thereby addressing the needs of smaller operators and remote sites. This trend opens doors for increased uptake and recurring revenue models.
- For instance, Quorum Software’s On Demand Accounting platform offers a scalable cloud-based solution that supports exploration to distribution workflows, enabling faster implementation and flexible integration for companies of all sizes.
Integration of Advanced Analytics and Digital Technologies
Another key opportunity arises from the integration of advanced analytics, artificial intelligence, machine‑learning, and blockchain capabilities into accounting solutions. These technologies enable real‑time financial insights, predictive cost forecasting, and enhanced decision‑making support within oil & gas operations. As companies look to derive strategic value from data, accounting‑software providers that embed analytics and automation gain a competitive advantage. The trend toward smart, data‑driven accounting workflows presents a substantive growth opportunity for the market.
- For instance, Hilcorp Energy implemented SAP S/4HANA with AI capabilities in accounts payable, automating invoice processing for over 35,000 monthly invoices, which drastically cut errors and operational costs.
Key Challenges
High Implementation Costs and Legacy System Integration
Despite strong market momentum, many oil & gas companies face significant barriers due to high implementation costs, complexity of customisation, and integration with legacy systems. Upgrading to specialised accounting software often involves substantial investment in training, data migration, and ongoing maintenance, particularly for large enterprises. The challenge of aligning new systems with existing ERP, production, and operational platforms slows adoption and inhibits faster market penetration. This cost‑and‑integration burden remains a key obstacle.
Data Security, Cyber‑Risk, and Changing Industry Dynamics
Another challenge lies in ensuring robust data security, managing cyber‑risks, and adapting to evolving industry dynamics such as volatile commodity prices, geopolitical disruptions, and energy‑transition pressures. Oil & gas accounting software must protect sensitive financial and operational data while being flexible enough to respond to changing business models (for example, low‑carbon operations). The convergence of digitalisation and heightened cyber‑threats places pressure on vendors and users alike, making security and adaptability a key challenge for market growth.
Regional Analysis
North America
In North America, the Oil and Gas Accounting Software Market commands a leading share of 40%, stemming from the established presence of large upstream, midstream and downstream oil and gas operators and a high rate of digital‑transformation adoption. The region’s strong technological infrastructure, stringent regulatory environment and extensive use of integrated software solutions drive demand for advanced accounting platforms. Vendors capitalise on remote workforce support and cloud migration trends among U.S. and Canadian firms. Competitive differentiation hinges on compliance‑capability, interoperability with ERP systems and scalable deployments that suit global operator footprints.
Europe
Europe holds 30% of the oil and gas accounting software market, underpinned by mature energy markets in the UK, Norway, Germany and the Netherlands. Operators face increasingly complex tax frameworks, cross‑border joint ventures and rigorous environmental and financial reporting standards, which heighten the demand for specialised software tools. The region’s emphasis on energy transition, decarbonisation and merger‑activity among oil and gas players further stimulates accounting‑software uptake. Vendors position offerings around localisation, multi‑currency consolidation and regulatory compliance to capture growth in the European market.
Asia‑Pacific
The Asia‑Pacific region accounts for around 15% of the oil and gas accounting software market and exhibits one of the fastest expansion rates. Rapid infrastructure development in countries such as China, India, Australia and Southeast‑Asia oil & gas hubs drives operator investment in transparency, joint‑venture accounting and upstream expansion projects. The push for digitalisation and adoption of cloud‑based systems supports market acceleration in the region. Software vendors targeting APAC emphasise regional compliance modules, scalable cloud deployments and multilingual user interfaces to address the diverse operator base and rapid growth momentum.
Latin America
Latin America contributes 8% to the global oil and gas accounting software market, with growth powered by offshore deep‑water projects and expanding upstream activity in Brazil, Mexico and Argentina. Operators in the region increasingly adopt modern accounting solutions to manage cost control, joint‑venture billing and complex tax regimes. While adoption rates trail North America and Europe, cloud‑based deployment and improved connectivity are unlocking new opportunities. Vendors must tailor strategies to address local infrastructure constraints, currency volatility and regional regulatory dynamics to succeed in Latin America.
Middle East & Africa
The Middle East & Africa region holds 7% of the oil and gas accounting software market, supported by large oil‑and‑gas operations, sovereign‑wealth‑fund investments and national‑development programmes. Major GCC countries and African producers are modernising financial systems and embracing software to manage revenue‑sharing, tax compliance and shared‑infrastructure cost accounting. The region’s long‑term energy‑transition strategies and drive for transparency increasingly favour cloud‑based and analytics‑enabled solutions. Vendors with strong regional support networks and experience in local regulatory frameworks gain competitive advantage in this evolving market.
Market Segmentations:
By Deployment Type
- Cloud-based
- On-premise
By Application
- Upstream
- Midstream
- Downstream
By Functionality
- Financial Management
- Revenue and Cost Management
- Tax Management
- Inventory Management
- Regulatory Compliance
By End-user
- Oil and Gas Companies
- Energy Consultants
- Oilfield Service Providers
- Govement and Regulatory Bodies
By Region
- North America
- U.S.
- Canada
- Mexico
- Europe
- Germany
- France
- U.K.
- Italy
- Spain
- Rest of Europe
- Asia Pacific
- China
- Japan
- India
- South Korea
- South-east Asia
- Rest of Asia Pacific
- Latin America
- Brazil
- Argentina
- Rest of Latin America
- Middle East & Africa
- GCC Countries
- South Africa
- Rest of the Middle East and Africa
Competitive Landscape
The competitive landscape of the oil and gas accounting software market is shaping around major players such as SAP SE (Germany), Oracle Corporation (USA), Microsoft Corporation (USA), Infor Inc. (USA), Quorum Software (USA) and P2 Energy Solutions (USA). These firms hold a combined market share of roughly 59%, with Oracle at 15 %, SAP at 14 %, IBM at 12 %, Microsoft at 11 % and the remaining major players collectively accounting for 7 % in aggregate. They compete intensely through product innovation, geographic expansion, strategic partnerships and cloud‑migration offerings. Larger vendors leverage scalable platforms and service ecosystems, while mid‑tier and niche providers target tailored solutions for upstream, midstream and downstream segments. As the market evolves, differentiation increasingly depends on analytics functionality, seamless integration with enterprise ERP systems, and ability to meet evolving regulatory and revenue‑management complexities.
Key Player Analysis
- IFS (Sweden)
- SAP SE (Germany)
- Infor (USA)
- Enverus (USA)
- Quorum Software (USA)
- AVEVA Group plc (UK)
- Oracle Corporation (USA)
- Enertia Software (USA)
- P2 Energy Solutions (USA)
- Microsoft Corporation (USA)
Recent Developments
- In May 2025, Quorum Software and Dragon Oil signed a Memorandum of Understanding (MoU) to collaborate on digital transformation and upstream operational excellence, including integration of accounting, asset development & planning and production data forecasting.
- In September 2025, PakEnergy launched an embedded AI‑powered lease provision capability for its energy software platform, reducing processing time from hours to seconds part of its oil & gas accounting/ERP product suite modernization.
- In April 2025, Quorum Software launched the “Global Partner Advantage Program”, a strategic initiative to strengthen its partner ecosystem (channel partners, system integrators) and accelerate growth in the energy software market
Report Coverage
The research report offers an in-depth analysis based on Deployment Type, Application, Functionality, End User and Region. It details leading market players, providing an overview of their business, product offerings, investments, revenue streams, and key applications. Additionally, the report includes insights into the competitive environment, SWOT analysis, current market trends, as well as the primary drivers and constraints. Furthermore, it discusses various factors that have driven market expansion in recent years. The report also explores market dynamics, regulatory scenarios, and technological advancements that are shaping the industry. It assesses the impact of external factors and global economic changes on market growth. Lastly, it provides strategic recommendations for new entrants and established companies to navigate the complexities of the market.
Future Outlook
- The market will expand steadily as oil & gas companies intensify focus on digitalising financial operations and reducing manual accounting overhead.
- Adoption of cloud‑based accounting solutions will rise sharply as firms prioritise scalability, remote collaboration and lower upfront infrastructure investments.
- Upstream, midstream and downstream operators will increasingly demand integrated software covering joint venture accounting, multi‑currency cost consolidation and real‑time revenue tracking.
- Vendors that embed artificial intelligence, machine learning and predictive analytics into their platforms will gain a competitive edge by enabling advanced financial forecasting and scenario modelling.
- Regulatory and environmental reporting requirements will drive uptake of specialised accounting modules that support audit trails, tax‑compliance and sustainability disclosures.
- Expansion of oil & gas activity in emerging markets will create growth opportunities in regions such as Asia‑Pacific, Latin America and Middle East & Africa for accounting software providers.
- Partnerships, mergers and strategic alliances among software vendors will accelerate innovation and broaden suite functionality, thereby influencing vendor landscape dynamics.
- The shift from on‑premise to hybrid and full‑cloud deployment models will intensify, pushing legacy platform upgrades and migration projects across large enterprises.
- Data security, cyber‑resilience and interoperability with enterprise systems (ERP, IoT, production platforms) will become critical differentiators for software solutions in the sector.
- Software vendors will increasingly offer subscription‑based pricing, modular functionality and service‑oriented delivery models to meet the needs of both global majors and smaller operators.
Request a Free Sample
Fill in your details and we'll send you a free sample report.
- Sample data tables & charts
- Research methodology
Need a Custom Version of This Report?
Tailor the scope, geography, or segments to your exact requirements.
- Custom geography or segment scope
- Direct access to our analyst team
Frequently Asked Questions
What is the current market size for Oil And Gas Accounting Software Market, and what is its projected size in 2032?
At what Compound Annual Growth Rate is the Oil And Gas Accounting Software Market projected to grow between 2025 and 2032?
Which is the leading region of the market for Oil & Gas Accounting Software?
What are the key drivers for the growth of the Oil & Gas Accounting Software market?
Which is the major segment in the Oil & Gas Accounting Software market by application?
Who are the leading companies in the Oil And Gas Accounting Software Market?
Table of Content
Chapter 1. Report Introduction
- 1.1 Report Description & Purpose
- 1.1.1 Report Title & Market Definition
- 1.1.2 Unique Selling Propositions (USP) & Key Differentiators
- 1.1.3 Value Proposition for Stakeholders
- 1.2 Research Objectives
- 1.2.1 Market Sizing Objectives (Volume & Revenue)
- 1.2.2 Segmentation Objectives
- 1.2.3 Competitive Intelligence Objectives
- 1.2.4 Forecast & Scenario Objectives
- 1.3 Report Scope
- 1.3.1 Oil and Gas Accounting Software Scope – Types & Subtypes Covered
- 1.3.2 Geographic Scope – Regions & Countries Covered
- 1.3.3 Historical Period, Base Year & Forecast Period (2024; forecast to 2032)
- 1.3.4 Inclusions & Exclusions
- 1.4 HS Code & Classification Framework
- 1.5 Currency, Units & Pricing Basis
- 1.6 Target Stakeholders
- 1.7 Limitations & Assumptions
Chapter 2. Executive Summary
- 2.1 Global Oil and Gas Accounting Software Market Snapshot
- 2.1.1 Market Size – Historical (2024) & Forecast (2024-2032) (2024: USD 1,980.5 Million → 2032: USD 3,327.29 Million)
- 2.1.2 Volume & Revenue – Global Totals
- 2.1.3 Key Market Highlights – Top Five Facts
- 2.2 Oil and Gas Accounting Software Market Segmentation Snapshot
- 2.2.1 Market Split by Region – 2024 vs. 2032
- 2.3 Competitive Snapshot
- 2.3.1 Top 10 Players by Revenue Share – 2024
- 2.3.2 Top 10 Players by Volume Share – 2024
- 2.3.3 Recent Strategic Developments (18-Month Summary)
- 2.4 Key Investment Highlights & Strategic Conclusions
Chapter 3. Oil and Gas Accounting Software Market Dynamics & Industry Analysis
- 3.1 Market Overview & Context
- 3.1.1 Oil and Gas Accounting Software Market Position in the Broader Automotive Value Chain
- 3.1.2 OEM vs. Replacement Market Dynamics
- 3.1.3 Market Maturity & Development Stage by Region
- 3.2 Oil and Gas Accounting Software Market Drivers
- 3.3 Oil and Gas Accounting Software Market Restraints & Challenges
- 3.4 Oil and Gas Accounting Software Market Opportunities
- 3.5 Porter's Five Forces Analysis
- 3.5.1 Threat of New Entrants
- 3.5.2 Bargaining Power of Suppliers
- 3.5.3 Bargaining Power of Buyers
- 3.5.4 Threat of Substitutes
- 3.5.5 Competitive Rivalry – Intensity Assessment
- 3.6 Oil and Gas Accounting Software Value Chain Analysis
- 3.6.1 Upstream – Raw Material/Input Suppliers
- 3.6.1.1 Raw Material/Input 1
- 3.6.1.2 Raw Material/Input 2
- 3.6.1.3 Raw Material/Input 3
- 3.6.2 Midstream – Production/Manufacturing/Service Delivery
- 3.6.2.1 Production/Process Overview
- 3.6.2.2 Key Facility Locations & Capacity by Manufacturer
- 3.6.3 Downstream – Distribution & End Consumer
- 3.6.3.1 Primary Channel – B2B/OEM
- 3.6.3.2 Secondary Channels – Dealer, Retail, Online, Direct
- 3.6.4 Value Chain Profitability Analysis
- 3.6.1 Upstream – Raw Material/Input Suppliers
- 3.7 PESTEL Analysis
- 3.7.1 Political Factors
- 3.7.2 Economic Factors
- 3.7.3 Social Factors
- 3.7.4 Technological Factors
- 3.7.5 Environmental Factors
- 3.7.6 Legal Factors
- 3.8 Oil and Gas Accounting Software Supply Chain Analysis
- 3.8.1 Raw Material/Input Supply Risk Assessment
- 3.8.2 Manufacturing Concentration Risk (Geographic Exposure)
- 3.8.3 Trade Disruption Impact Analysis
- 3.9 Regulatory & Policy Landscape
Note: The regulatory and policy landscape section covers regulations based on their applicability to the market, Oil and Gas Accounting Software category, geography, and scope of the study. Only regulatory frameworks with a material impact on operations, compliance, trade, sustainability, or market access are analyzed in detail.
Chapter 4. Key Investment Pockets & Opportunity Analysis
- 4.1 Oil and Gas Accounting Software Market Attractiveness Analysis
- 4.1.1 By Region – Investment Attractiveness Matrix (Volume × CAGR)
- 4.2 Absolute Revenue Growth Opportunity
- 4.2.1 By Region – Absolute USD Growth Through 2032
- 4.3 Incremental Volume Opportunity
- 4.3.1 By Region – Incremental Volume Through 2032
- 4.3.2 Segment – Incremental Volume
- 4.4 Emerging Submarket Opportunity Deep Dive (Subject to Applicability)
- 4.5 Emerging Market Opportunity Scorecards
- 4.5.1 United States
- 4.5.2 Europe
- 4.5.3 Asia
- 4.5.4 Middle East & Africa
Note: Emerging Market Opportunity Scorecards will be included based on relevance and strategic importance. Regions listed are indicative and may vary depending on data availability and market dynamics.
Chapter 5. Oil and Gas Accounting Software Import-Export Analysis & Trade Flows
- 5.1 Global Trade Overview
- 5.1.1 Global Export Value by Country (2024)
- 5.1.2 Global Export Volume by Country (2024)
- 5.1.3 Global Import Value by Country (2024)
- 5.1.4 Global Import Volume by Country (2024)
- 5.1.5 Net Trade Balance by Country (2024)
- 5.2 Export Analysis – Segment
- 5.2.1 Type 1 (HS Code)
- 5.2.2 Type 2 (HS Code)
- 5.2.3 Type 3 (HS Code)
- 5.2.4 Type 4 (HS Code)
- 5.2.5 Type 5 (HS Code)
- 5.3 Import Analysis – Segment
- 5.3.1 Type 1 (HS Code)
- 5.3.2 Type 2 (HS Code)
- 5.3.3 Type 3 (HS Code)
- 5.3.4 Type 4 (HS Code)
- 5.3.5 Type 5 (HS Code)
- 5.4 Average Unit Trade Prices
- 5.4.1 Average Export Price – Segment & Country
- 5.4.2 Average Import Price – Segment & Source Country
- 5.4.3 Price Trends (2024)
- 5.5 Key Trade Route Analysis
- 5.5.1 Trade Route 1
- 5.5.2 Trade Route 2
- 5.5.3 Trade Route 3
- 5.5.4 Trade Route 4
- 5.5.5 Trade Route 5
- 5.6 Trade Policy Impact Assessment
- 5.6.1 US Anti-Dumping & Section 301 Tariffs
- 5.6.2 EU Customs Union Impact
- 5.6.3 Major Free Trade Agreements
- 5.6.4 USMCA Rules of Origin
Note: Trade policy analysis will be included only where relevant to the Oil and Gas Accounting Software market.
Chapter 6. Competitive Landscape & Company Benchmarking
- 6.1 Oil and Gas Accounting Software Market Concentration & Structure
- 6.1.1 Herfindahl-Hirschman Index (HHI) – vs. 2024
- 6.1.2 Tier 1, Tier 2 & Tier 3 Market Structure
- 6.1.3 Global, Regional & Local Player Dynamics
- 6.2 Oil and Gas Accounting Software Market Share Analysis – 2024
- 6.2.1 Global Revenue Share by Company
- 6.2.2 Global Volume Share by Company
- 6.2.3 Regional Revenue Share
- 6.2.4 Market Share Evolution ( vs. 2024)
- 6.2.5 OEM Segment Share by Company
- 6.2.6 Replacement Segment Share by Company
- 6.3 Production/Delivery Capacity & Facility Analysis
- 6.3.1 Global Installed Capacity
- 6.3.2 Capacity Utilization Rates
- 6.3.3 Production/Output Volume
- 6.3.4 Facility Locations & Capacity Map
- 6.3.5 Planned Capacity Additions
- 6.4 Oil and Gas Accounting Software Competitive Benchmarking Matrix
- 6.4.1 Revenue, Volume, CAGR & Profitability Comparison
- 6.4.2 Channel Revenue Mix
- 6.4.3 Geographic Revenue Exposure
- 6.4.4 R&D Intensity
- 6.4.5 Sustainability Maturity
- 6.5 Strategic Developments in Oil and Gas Accounting Software (Last 24 Months)
- 6.5.1 Mergers, Acquisitions & Divestments
- 6.5.2 New Oil and Gas Accounting Software Launches
- 6.5.3 Facility Expansions
- 6.5.4 Strategic Alliances, Joint Ventures & Partnerships
- 6.5.5 Distribution Expansion & Market Entry
- 6.5.6 Sustainability & ESG Initiatives
- 6.6 Competitive Strategy Mapping
- 6.6.1 Leader, Challenger, Follower & Niche Classification
- 6.6.2 Pricing Strategy Comparison
- 6.6.3 Channel Strategy Matrix
Note: Strategic developments are included based on their materiality and the availability of reliable information.
Chapter 7. Global Oil and Gas Accounting Software Market – By Distribution Channel
- 7.1 Segment Overview
- 7.1.1 Volume & Revenue Split by Channel (2024 & 2032)
- 7.1.2 Channel Mix Evolution (2024-2032)
Chapter 8. Regional Market Analysis – Global Overview
- 8.1 Global Regional Overview
- 8.1.1 Regional Volume Share
- 8.1.2 Regional Revenue Share
- 8.1.3 Regional Volume by Region
- 8.1.4 Regional Revenue by Region
- 8.1.5 Regional Forecast Through 2032
- 8.2 Cross-Regional Segment Analysis
- 8.2.1 By Distribution Channel
- 8.2.2 By Brand/Price Tier
Chapter 9. North America Oil and Gas Accounting Software Market
- 9.1 United States
- 9.2 Canada
- 9.3 Mexico
Chapter 10. Europe Oil and Gas Accounting Software Market
- 10.1 Germany
- 10.2 France
- 10.3 Italy
- 10.4 United Kingdom
- 10.5 Spain
- 10.6 Poland
- 10.7 Russia
- 10.8 Netherlands
- 10.9 Belgium
- 10.10 Sweden
- 10.11 Denmark
- 10.12 Norway
- 10.13 Rest of Europe
Chapter 11. Asia Pacific Oil and Gas Accounting Software Market
- 11.1 China
- 11.2 India
- 11.3 Japan
- 11.4 South Korea
- 11.5 Thailand
- 11.6 Indonesia
- 11.7 Vietnam
- 11.8 Malaysia
- 11.9 Australia
- 11.10 Rest of Asia Pacific
Chapter 12. Latin America Oil and Gas Accounting Software Market
- 12.1 Brazil
- 12.2 Argentina
- 12.3 Colombia
- 12.4 Chile
- 12.5 Rest of Latin America
Chapter 13. Middle East Oil and Gas Accounting Software Market
- 13.1 Saudi Arabia
- 13.2 United Arab Emirates
- 13.3 Turkey
- 13.4 Israel
- 13.5 Iran
- 13.6 Rest of the Middle East
Chapter 14. Africa Oil and Gas Accounting Software Market
- 14.1 South Africa
- 14.2 Egypt
- 14.3 Nigeria
- 14.4 Morocco
- 14.5 Rest of Africa
Chapter 15. Oil and Gas Accounting Software Company Profiles
- 15.1 [Company 01]
- 15.1.1 Company Overview
- 15.1.2 Key Management Personnel
- 15.1.3 Products & Services Portfolio
- 15.1.4 Financial Performance
- 15.1.5 Key Market Focus & Geographic Presence
- 15.1.6 Recent Developments & Strategic Initiatives
Note: The company profile list is preliminary and may change based on research findings, market developments, data availability, and client requirements.
Chapter 16. Appendices
- Appendix A – List of Abbreviations & Acronyms
- Appendix B – Industry Classification Code Reference – Full Series
- Appendix C – Production & Capacity Data Tables
- Appendix D – End-Use & Demand Base Tables
- Appendix E – Consumption & Replacement Rate Assumptions
- Appendix F – ASP Reference Tables
- Appendix G – Manufacturing & Facility Database
- Appendix H – Import-Export Data Tables
- Appendix I – Regulatory Summary Tables
- Appendix J – Primary Research Participant List (Anonymized)
- Appendix K – Primary Research Questionnaire Framework
- Appendix L – Data Sources & Bibliography
- Appendix M – Market Size Divergence & Source Comparison
Chapter 17. Research Methodology
- 17.1 Research Framework & Philosophy
- 17.2 Secondary Research – Sources, Hierarchy & Data Extraction
- 17.3 Data Modeling – Bottom-Up & Top-Down Market Sizing
- 17.4 Primary Research – Stakeholder Framework, LOI & Sample Sizes
- 17.5 Forecast Methodology – Regression, Scenario & Sensitivity Analysis
- 17.6 Quality Control – Four-Layer Validation Framework
- 17.7 Limitations & Standard Assumptions
- 17.8 Disclaimer
