
Key Growth Drivers
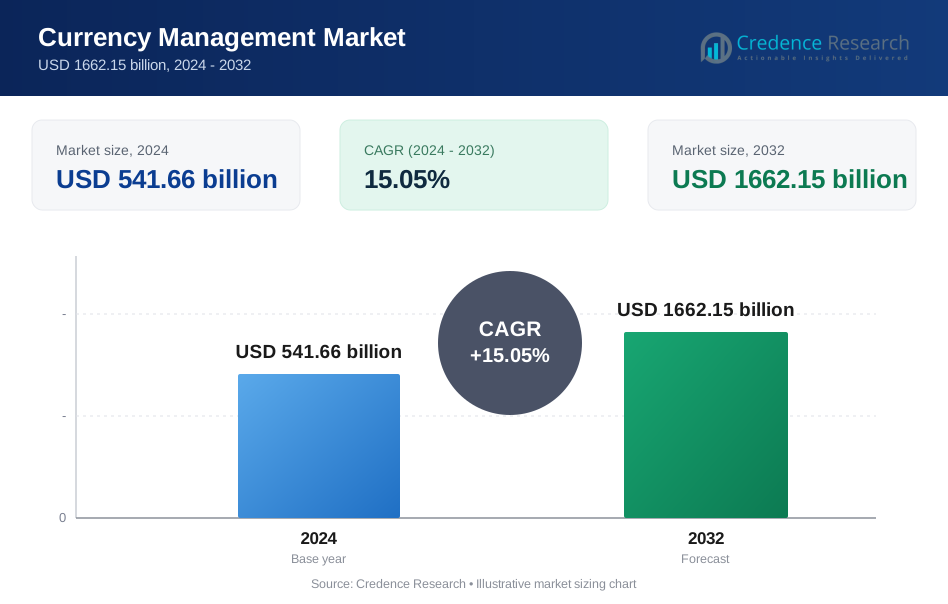
Currency Management Market size was valued USD 541.66 billion in 2024 and is anticipated to reach USD 1662.15 billion by 2032, at a CAGR of 15.05% during the forecast period.
| REPORT ATTRIBUTE | DETAILS |
|---|---|
| Historical Period | 2020-2023 |
| Base Year | 2024 |
| Forecast Period | 2025-2032 |
| Currency Management Market Size 2024 | USD 541.66 Billion |
| Currency Management Market, CAGR | 15.05% |
| Currency Management Market Size 2032 | USD 1662.15 Billion |
The currency management market is dominated by global financial institutions and fintech firms that offer integrated treasury, hedging, and risk-management solutions. These leading companies leverage AI, cloud platforms, and automation to deliver scalable, real-time foreign-exchange exposure management. Their strong product portfolios, broad geographic reach, and deep capital markets expertise allow them to serve both large corporations and financial institutions. On the demand side, North America remains the top region, capturing approximately 45 % of the global market share, driven by its mature financial infrastructure and technologically advanced treasury operations.
Market Insights
- The Currency Management Market was valued at USD 541.66 billion in 2024 and is projected to reach USD 1662.15 billion by 2032, growing at a CAGR of 15.05%.
- Rising demand for automated FX risk-management and real-time treasury solutions drives market expansion across large enterprises and financial institutions.
- AI-enabled analytics, cloud-based platforms, and integrated hedging systems represent the strongest market trends, improving accuracy, speed, and multi-currency optimization.
- The competitive landscape intensifies as global financial institutions and fintech firms expand product portfolios and enhance operational capabilities to capture larger enterprise segments.
- Market restraints include regulatory complexity, high implementation costs, and integration challenges across legacy treasury systems.
- North America leads the market with about 45% share, supported by a mature financial ecosystem and advanced corporate treasury operations.
- Europe contributes a significant regional portion due to strong banking systems and strict compliance frameworks.
- Asia-Pacific shows the fastest growth as cross-border trade and digital treasury adoption accelerate across emerging economies.
- Cloud deployment segments continue to gain traction, supported by scalability and lower operational costs.
- Demand from large enterprises remains dominant, although SMEs increasingly adopt flexible, automated currency-management tools.
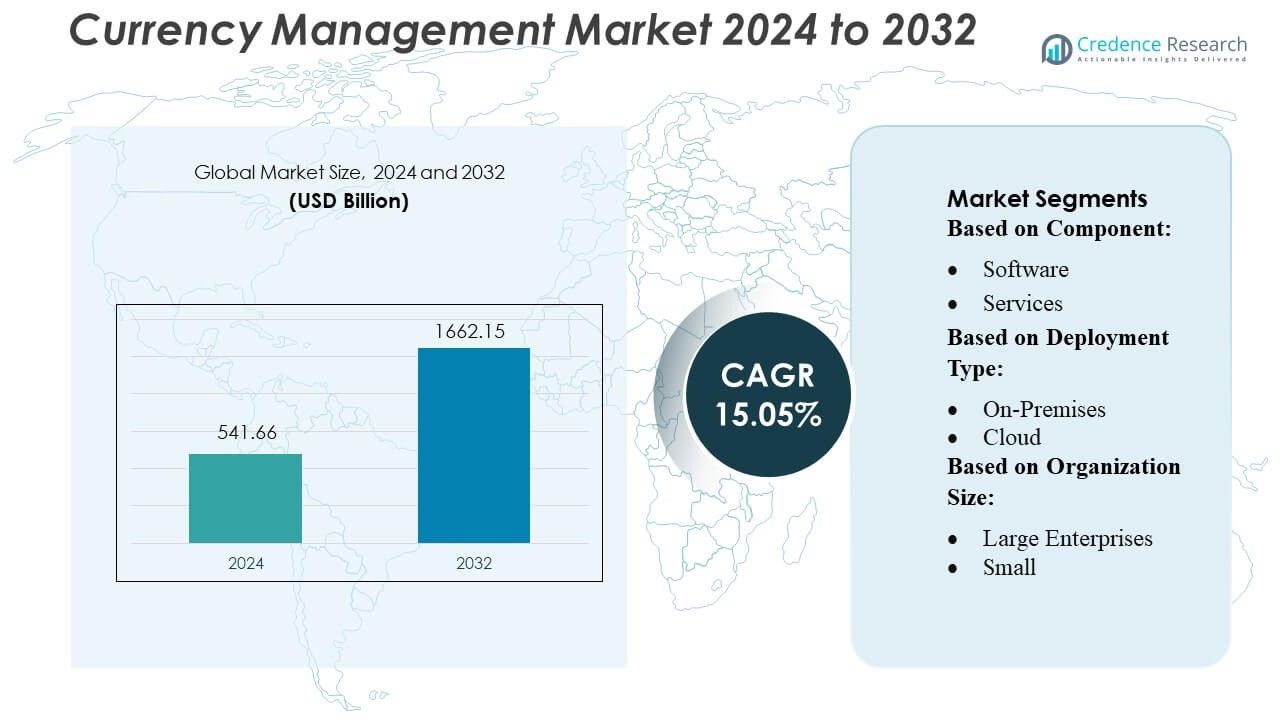
Market Segmentation Analysis:
By Component
The market divides into software and services, with software holding the largest share due to its strong adoption for real-time FX tracking, automated exposure management, and integrated treasury workflows. Its dominance is driven by growing demand for accuracy, faster processing, and centralized control in cross-border operations. Services continue to grow as firms seek implementation support, customization, and ongoing system optimization, but software remains the primary driver of market expansion.
- For instance, Freshworks Inc. has reported that its Freddy AI-powered offerings—Agent and Copilot—generated over US$ 20 million in annual recurring revenue, while more than 24,000 customers now contribute over US$ 5,000 in ARR, underscoring its push into intelligent, large-scale SaaS deployments.
By Deployment Type
Cloud deployment leads the market with the highest share, supported by its lower upfront cost, easy scalability, and ability to provide real-time currency data across global teams. Companies prefer cloud platforms because they improve accessibility, automate updates, and reduce IT maintenance. On-premises solutions remain relevant for organizations with strict security or compliance needs, but the convenience and flexibility of cloud systems keep this sub-segment dominant.
- For instance, Microsoft Sentinel, the cloud-native security information and event management (SIEM) platform, offers over 350 ready-to-use data connectors. Leveraging AI and machine learning, it processes trillions of security signals daily to provide real-time threat detection and strengthen risk visibility across enterprises.
By Organization Size
Among organization sizes, SMEs dominate due to their rapid shift toward cost-efficient, cloud-based currency tools that help them manage FX exposure without heavy investment. Large enterprises adopt more complex systems, but SMEs lead overall usage. In terms of function, risk and compliance management holds the largest share, driven by rising FX volatility and the need for accurate reporting and regulatory compliance. Customer experience and other functions grow steadily but remain secondary to risk-focused capabilities.
Market Overview
- Rising Volatility in Global Foreign Exchange Markets
Increasing foreign exchange volatility continues to push enterprises and institutional investors to adopt sophisticated currency management solutions. Frequent fluctuations driven by geopolitical tensions, monetary policy divergence, inflationary cycles, and commodity price instability elevate exposure to FX risk, making hedging essential for maintaining earnings stability. As organizations expand global operations and cross-border transactions accelerate, demand grows for automated platforms capable of real-time rate tracking, predictive analytics, and dynamic hedging strategies. This broader risk landscape fuels steady investment in currency management tools and advisory services.
- For instance, Moody’s introduced its “Research Assistant” GenAI tool in early 2025, which enabled users during its initial analysis to access 60% more data and insights and reduce their task time by 30%, significantly enhancing decision-making efficiency.
- Expansion of International Trade and Investment Flows
The rapid growth of cross-border trade, international e-commerce, and capital flows strengthens the need for robust currency management frameworks. Multinational corporations increasingly rely on integrated systems to manage multi-currency invoicing, settlement, and treasury operations while optimizing cash flow. Emerging markets’ rising participation in global supply chains further contributes to greater exposure to foreign exchange movements. As companies prioritize operational efficiency and financial resilience, they invest in advanced solutions that automate transaction workflows, support compliance, and improve visibility into currency positions across regional subsidiaries.
- For instance, ServiceNow introduced the AI Control Tower module, which supports integrated oversight of AWS Bedrock, Azure Foundry, and ServiceNow’s own LLMs, enabling centralized tracking of over 1,000 AI agents and models in a single environment.
- Adoption of Advanced Treasury Technologies and Automation
Widespread adoption of digital treasury systems, AI-driven forecasting tools, and algorithmic hedging platforms significantly accelerates market growth. Organizations seek automation to reduce manual errors, enhance decision-making, and streamline FX exposure workflows across multiple jurisdictions. Cloud-based currency management solutions offer scalability, integration with ERP systems, and enhanced real-time analytics. Financial institutions and corporates increasingly deploy machine learning models to optimize hedging efficiency, detect anomalies, and assess potential market scenarios. This shift toward data-driven treasury operations drives demand for innovative currency management technologies globally.
Key Trends & Opportunities
1. Growth of Cloud-Based Currency Management Platforms
Cloud deployments continue to gain traction as enterprises prioritize flexibility, cost efficiency, and faster implementation cycles. These platforms offer seamless integration with existing financial systems, real-time exposure visibility, and enhanced security layers that meet global regulatory standards. Subscription-based models lower operational costs and enable treasury teams to access updates and risk analytics remotely. Vendors are expanding platform capabilities with AI, API-based connectivity, and collaborative dashboards, creating stronger opportunities for adoption among mid-sized firms and multinational businesses that require agile, scalable solutions.
- For instance, NAVEX's 2025 State of Risk & Compliance survey (conducted by The Harris Poll on behalf of NAVEX) gathered responses from exactly 999 risk and compliance professionals across 6 countries to benchmark threat and compliance metrics.
2. Increasing Demand for Real-Time Analytics and AI-Based Hedging
The market is witnessing strong interest in real-time data analytics, machine learning–enabled forecasting, and automated hedging modules that adjust positions dynamically. Treasury teams rely on these tools to interpret rapid market movements, streamline rate calculations, and enhance the precision of exposure assessments. AI-driven insights support predictive modeling and scenario planning, helping firms proactively mitigate risks. As technology providers continue to innovate, opportunities emerge for integrated platforms offering advanced visualization, automated alerting, and faster decision-making to address evolving market volatility.
- For instance, Fiserv has a network of approximately 10,000 financial institution clients. The company also serves around 6 million merchant locations. Fiserv's network processes 90 billion transactions annually.
3. Expansion of Regulatory Compliance and Reporting Requirements
Growing regulatory scrutiny surrounding currency transactions and derivative usage is creating demand for automated compliance features. Requirements such as EMIR, Dodd-Frank, MiFID II, and IFRS standards push organizations to adopt platforms capable of generating accurate audit trails, centralizing documentation, and ensuring transparent reporting. Vendors that offer built-in regulatory modules, multi-jurisdictional support, and automated data reconciliation stand to benefit as corporates and financial institutions seek to simplify complex compliance processes. This trend presents significant opportunities for solution providers with strong governance and risk management capabilities.
Key Challenges
1. High Implementation Costs and Integration Complexity
Despite strong demand, many organizations face challenges in adopting advanced currency management systems due to high initial investment, customization needs, and integration requirements. Connecting platforms with legacy ERP, treasury, and accounting systems often results in lengthy implementation cycles and operational disruptions. Smaller enterprises may struggle to justify the financial and technical resources required. These barriers slow adoption, particularly in markets with limited digital maturity, and compel solution providers to innovate toward more modular, cost-efficient deployment models.
2. Limited Skilled Workforce and Technical Expertise
Effective currency management requires specialized knowledge of FX markets, hedging strategies, regulatory frameworks, and analytical tools. Many organizations lack sufficiently trained treasury professionals capable of interpreting advanced risk models and leveraging sophisticated technology platforms. This skills gap reduces the effectiveness of digital solutions and hinders broader adoption. Additionally, rapid advancements in AI, data analytics, and automation demand continuous upskilling. Without targeted workforce development and user-friendly platform designs, organizations may struggle to fully realize the benefits of modern currency management systems.
Regional Analysis
North America
North America leads the global currency management market with about 45% share. The region benefits from a strong financial ecosystem and high adoption of advanced risk-management and treasury systems. Large corporations and financial institutions rely heavily on currency hedging tools due to significant international trade exposure. The presence of major technology vendors and strict regulatory standards also supports market expansion. Growing use of cloud-based treasury platforms and analytics continues to strengthen North America’s dominance in currency management solutions.
Europe
Europe holds roughly 30% of the market, driven by a mature banking sector and the strong presence of global financial hubs such as London, Frankfurt, and Zurich. European firms actively use currency hedging tools to manage exchange-rate exposure tied to trade within the EU and globally. Regulatory emphasis on transparency and compliance encourages wider adoption of structured treasury solutions. Technological modernization, including digital platforms and automation, continues to enhance Europe’s competitiveness and supports sustained demand for advanced currency management services.
Asia-Pacific
The Asia-Pacific region is the fastest-growing market, supported by rapid economic expansion, rising cross-border trade, and increased participation in global financial markets. While its market share is still developing, APAC is quickly gaining ground as companies in China, India, Japan, and Southeast Asia adopt modern currency management tools. Growing FX exposure, higher digital adoption, and expanding multinational operations drive demand. Cloud-based treasury platforms and real-time risk analytics are increasingly used, making APAC a high-potential growth region in global currency management.
Latin America
Latin America represents a smaller but expanding portion of the global market. Growth is fueled by rising trade flows, fluctuating local currencies, and increased use of risk-management solutions by firms in Brazil, Mexico, and Argentina. Currency volatility remains a major driver for adopting hedging tools. Although digital treasury systems are less widespread compared to advanced regions, growing financial modernization and foreign investment are encouraging adoption. Overall, Latin America shows steady development but remains limited by economic instability and slower technology penetration.
Middle East & Africa
The Middle East & Africa region accounts for around 5% of the market, supported by growing trade activity, increasing foreign investment, and the modernization of financial systems. Countries like the UAE, Saudi Arabia, and South Africa are leading adoption as local institutions integrate global treasury practices. Digital transformation and regulatory improvements are encouraging greater use of currency management solutions. While the market size is still small, rising corporate activity and strengthening financial sectors indicate steady long-term growth potential.
Market Segmentations:
By Component:
- Software
- Services
By Deployment Type:
- On-Premises
- Cloud
By Organization Size:
- Large Enterprises
- Small
By Geography
- North America
- U.S.
- Canada
- Mexico
- Europe
- Germany
- France
- U.K.
- Italy
- Spain
- Rest of Europe
- Asia Pacific
- China
- Japan
- India
- South Korea
- South-east Asia
- Rest of Asia Pacific
- Latin America
- Brazil
- Argentina
- Rest of Latin America
- Middle East & Africa
- GCC Countries
- South Africa
- Rest of the Middle East and Africa
Competitive Landscape
The Currency Management Market features a diverse competitive ecosystem led by major technology and analytics providers such as Miraway, Freshworks Inc., Oracle Corporation, Clarabridge, Adobe Inc., Medallia Inc., Avaya Inc., Open Text Corp., Genesys, and International Business Machines Corp. The Currency Management Market continues to intensify as providers expand their capabilities across automation, analytics, and cloud-based treasury functions. Vendors increasingly differentiate themselves through advanced risk-mitigation tools, real-time FX visibility, and integrated platforms that unify hedging, compliance, and forecasting. The market shows a clear shift toward AI-driven insights, enabling institutions to optimize exposure strategies and reduce operational inefficiencies. Partnerships with banks, fintech firms, and global financial institutions further strengthen solution ecosystems, while the rising adoption of multi-currency payment systems fuels innovation. As organizations demand faster execution, stronger regulatory adherence, and deeper analytical precision, competition accelerates around scalability, interoperability, and cost-efficient deployment models. This environment encourages continuous product enhancements and investment in technologies such as machine learning, API-based connectivity, and automated reporting frameworks to maintain market relevance and capture evolving enterprise needs.
Key Player Analysis
- Miraway
- Freshworks Inc.
- Oracle Corporation
- Clarabridge
- Adobe Inc.
- Medallia Inc.
- Avaya Inc.
- Open Text Corp.
- Genesys
- International Business Machines Corp.
Recent Developments
- In June 2025, DKSH Brunei, which is a leading provider of Market Expansion Services in Asia and beyond in Brunei. This inauguration will help to support the resilience and growth of the healthcare supply chain of the nation and will solidify the capabilities of DKSH Brunei.
- In May 2025, ThingsRecon's enhanced platform connects organizations with asset discovery, vulnerability management and supply chain attack surface. To provide the government and organizations the next-generation, comprehensive security solutions and to support cybersecurity consultancies, managed security service providers (MSSPs), and application cybersecurity partners, the initiative will be utilized.
- In March 2024, Adobe Inc. launched a new set of suites aimed at the enterprise sector, enabling brands to achieve individualized personalization on a large scale by leveraging generative AI and instantaneous insights.
Report Coverage
The research report offers an in-depth analysis based on Component, Deployment Type, Organization Size and Geography. It details leading market players, providing an overview of their business, product offerings, investments, revenue streams, and key applications. Additionally, the report includes insights into the competitive environment, SWOT analysis, current market trends, as well as the primary drivers and constraints. Furthermore, it discusses various factors that have driven market expansion in recent years. The report also explores market dynamics, regulatory scenarios, and technological advancements that are shaping the industry. It assesses the impact of external factors and global economic changes on market growth. Lastly, it provides strategic recommendations for new entrants and established companies to navigate the complexities of the market.
Future Outlook
- The market will adopt more AI-driven forecasting systems to improve currency risk prediction.
- Cloud-based currency management platforms will expand as enterprises seek scalable solutions.
- Automation will streamline treasury workflows and reduce manual intervention in FX processes.
- Adoption of real-time analytics will grow as firms demand faster visibility into currency exposures.
- Integration of currency tools with ERP and payment systems will become standard across industries.
- Regulatory reforms will push companies to enhance compliance in global currency operations.
- Multinationals will increase hedging activities to manage rising volatility in global currencies.
- Blockchain-enabled settlement frameworks will gain traction for secure cross-border transactions.
- Emerging markets will drive strong demand due to expanding international trade activities.
- Cybersecurity enhancements will become critical as digital currency management platforms scale.
Request a Free Sample
Fill in your details and we'll send you a free sample report.
- Sample data tables & charts
- Research methodology
Need a Custom Version of This Report?
Tailor the scope, geography, or segments to your exact requirements.
- Custom geography or segment scope
- Direct access to our analyst team
Frequently Asked Questions
What is the current market size for the Currency Management Market, and what is its projected size in 2032?
At what Compound Annual Growth Rate is the Currency Management Market projected to grow between 2025 and 2032?
Which Currency Management Market segment held the largest share in 2024?
What are the primary factors fueling the growth of the Currency Management Market?
Who are the leading companies in the Currency Management Market?
Which region commanded the largest share of the Currency Management Market in 2024?
Table of Content
Chapter 1. Report Introduction
- 1.1 Report Description & Purpose
- 1.1.1 Report Title & Market Definition
- 1.1.2 Unique Selling Propositions (USP) & Key Differentiators
- 1.1.3 Value Proposition for Stakeholders
- 1.2 Research Objectives
- 1.2.1 Market Sizing Objectives (Volume & Revenue)
- 1.2.2 Segmentation Objectives
- 1.2.3 Competitive Intelligence Objectives
- 1.2.4 Forecast & Scenario Objectives
- 1.3 Report Scope
- 1.3.1 Currency Management Scope – Types & Subtypes Covered
- 1.3.2 Geographic Scope – Regions & Countries Covered
- 1.3.3 Historical Period, Base Year & Forecast Period (2024; forecast to 2032)
- 1.3.4 Inclusions & Exclusions
- 1.4 HS Code & Classification Framework
- 1.5 Currency, Units & Pricing Basis
- 1.6 Target Stakeholders
- 1.7 Limitations & Assumptions
Chapter 2. Executive Summary
- 2.1 Global Currency Management Market Snapshot
- 2.1.1 Market Size – Historical (2024) & Forecast (2024-2032) (2024: USD 541.66 billion → 2032: USD 1662.15 billion)
- 2.1.2 Volume & Revenue – Global Totals
- 2.1.3 Key Market Highlights – Top Five Facts
- 2.2 Currency Management Market Segmentation Snapshot
- 2.2.1 Market Split by Region – 2024 vs. 2032
- 2.3 Competitive Snapshot
- 2.3.1 Top 10 Players by Revenue Share – 2024
- 2.3.2 Top 10 Players by Volume Share – 2024
- 2.3.3 Recent Strategic Developments (18-Month Summary)
- 2.4 Key Investment Highlights & Strategic Conclusions
Chapter 3. Currency Management Market Dynamics & Industry Analysis
- 3.1 Market Overview & Context
- 3.1.1 Currency Management Market Position in the Broader Automotive Value Chain
- 3.1.2 OEM vs. Replacement Market Dynamics
- 3.1.3 Market Maturity & Development Stage by Region
- 3.2 Currency Management Market Drivers
- 3.3 Currency Management Market Restraints & Challenges
- 3.4 Currency Management Market Opportunities
- 3.5 Porter's Five Forces Analysis
- 3.5.1 Threat of New Entrants
- 3.5.2 Bargaining Power of Suppliers
- 3.5.3 Bargaining Power of Buyers
- 3.5.4 Threat of Substitutes
- 3.5.5 Competitive Rivalry – Intensity Assessment
- 3.6 Currency Management Value Chain Analysis
- 3.6.1 Upstream – Raw Material/Input Suppliers
- 3.6.1.1 Raw Material/Input 1
- 3.6.1.2 Raw Material/Input 2
- 3.6.1.3 Raw Material/Input 3
- 3.6.2 Midstream – Production/Manufacturing/Service Delivery
- 3.6.2.1 Production/Process Overview
- 3.6.2.2 Key Facility Locations & Capacity by Manufacturer
- 3.6.3 Downstream – Distribution & End Consumer
- 3.6.3.1 Primary Channel – B2B/OEM
- 3.6.3.2 Secondary Channels – Dealer, Retail, Online, Direct
- 3.6.4 Value Chain Profitability Analysis
- 3.6.1 Upstream – Raw Material/Input Suppliers
- 3.7 PESTEL Analysis
- 3.7.1 Political Factors
- 3.7.2 Economic Factors
- 3.7.3 Social Factors
- 3.7.4 Technological Factors
- 3.7.5 Environmental Factors
- 3.7.6 Legal Factors
- 3.8 Currency Management Supply Chain Analysis
- 3.8.1 Raw Material/Input Supply Risk Assessment
- 3.8.2 Manufacturing Concentration Risk (Geographic Exposure)
- 3.8.3 Trade Disruption Impact Analysis
- 3.9 Regulatory & Policy Landscape
Note: The regulatory and policy landscape section covers regulations based on their applicability to the market, Currency Management category, geography, and scope of the study. Only regulatory frameworks with a material impact on operations, compliance, trade, sustainability, or market access are analyzed in detail.
Chapter 4. Key Investment Pockets & Opportunity Analysis
- 4.1 Currency Management Market Attractiveness Analysis
- 4.1.1 By Region – Investment Attractiveness Matrix (Volume × CAGR)
- 4.2 Absolute Revenue Growth Opportunity
- 4.2.1 By Region – Absolute USD Growth Through 2032
- 4.3 Incremental Volume Opportunity
- 4.3.1 By Region – Incremental Volume Through 2032
- 4.3.2 Segment – Incremental Volume
- 4.4 Emerging Submarket Opportunity Deep Dive (Subject to Applicability)
- 4.5 Emerging Market Opportunity Scorecards
- 4.5.1 United States
- 4.5.2 Europe
- 4.5.3 Asia
- 4.5.4 Middle East & Africa
Note: Emerging Market Opportunity Scorecards will be included based on relevance and strategic importance. Regions listed are indicative and may vary depending on data availability and market dynamics.
Chapter 5. Currency Management Import-Export Analysis & Trade Flows
- 5.1 Global Trade Overview
- 5.1.1 Global Export Value by Country (2024)
- 5.1.2 Global Export Volume by Country (2024)
- 5.1.3 Global Import Value by Country (2024)
- 5.1.4 Global Import Volume by Country (2024)
- 5.1.5 Net Trade Balance by Country (2024)
- 5.2 Export Analysis – Segment
- 5.2.1 Type 1 (HS Code)
- 5.2.2 Type 2 (HS Code)
- 5.2.3 Type 3 (HS Code)
- 5.2.4 Type 4 (HS Code)
- 5.2.5 Type 5 (HS Code)
- 5.3 Import Analysis – Segment
- 5.3.1 Type 1 (HS Code)
- 5.3.2 Type 2 (HS Code)
- 5.3.3 Type 3 (HS Code)
- 5.3.4 Type 4 (HS Code)
- 5.3.5 Type 5 (HS Code)
- 5.4 Average Unit Trade Prices
- 5.4.1 Average Export Price – Segment & Country
- 5.4.2 Average Import Price – Segment & Source Country
- 5.4.3 Price Trends (2024)
- 5.5 Key Trade Route Analysis
- 5.5.1 Trade Route 1
- 5.5.2 Trade Route 2
- 5.5.3 Trade Route 3
- 5.5.4 Trade Route 4
- 5.5.5 Trade Route 5
- 5.6 Trade Policy Impact Assessment
- 5.6.1 US Anti-Dumping & Section 301 Tariffs
- 5.6.2 EU Customs Union Impact
- 5.6.3 Major Free Trade Agreements
- 5.6.4 USMCA Rules of Origin
Note: Trade policy analysis will be included only where relevant to the Currency Management market.
Chapter 6. Competitive Landscape & Company Benchmarking
- 6.1 Currency Management Market Concentration & Structure
- 6.1.1 Herfindahl-Hirschman Index (HHI) – vs. 2024
- 6.1.2 Tier 1, Tier 2 & Tier 3 Market Structure
- 6.1.3 Global, Regional & Local Player Dynamics
- 6.2 Currency Management Market Share Analysis – 2024
- 6.2.1 Global Revenue Share by Company
- 6.2.2 Global Volume Share by Company
- 6.2.3 Regional Revenue Share
- 6.2.4 Market Share Evolution ( vs. 2024)
- 6.2.5 OEM Segment Share by Company
- 6.2.6 Replacement Segment Share by Company
- 6.3 Production/Delivery Capacity & Facility Analysis
- 6.3.1 Global Installed Capacity
- 6.3.2 Capacity Utilization Rates
- 6.3.3 Production/Output Volume
- 6.3.4 Facility Locations & Capacity Map
- 6.3.5 Planned Capacity Additions
- 6.4 Currency Management Competitive Benchmarking Matrix
- 6.4.1 Revenue, Volume, CAGR & Profitability Comparison
- 6.4.2 Channel Revenue Mix
- 6.4.3 Geographic Revenue Exposure
- 6.4.4 R&D Intensity
- 6.4.5 Sustainability Maturity
- 6.5 Strategic Developments in Currency Management (Last 24 Months)
- 6.5.1 Mergers, Acquisitions & Divestments
- 6.5.2 New Currency Management Launches
- 6.5.3 Facility Expansions
- 6.5.4 Strategic Alliances, Joint Ventures & Partnerships
- 6.5.5 Distribution Expansion & Market Entry
- 6.5.6 Sustainability & ESG Initiatives
- 6.6 Competitive Strategy Mapping
- 6.6.1 Leader, Challenger, Follower & Niche Classification
- 6.6.2 Pricing Strategy Comparison
- 6.6.3 Channel Strategy Matrix
Note: Strategic developments are included based on their materiality and the availability of reliable information.
Chapter 7. Global Currency Management Market – By Distribution Channel
- 7.1 Segment Overview
- 7.1.1 Volume & Revenue Split by Channel (2024 & 2032)
- 7.1.2 Channel Mix Evolution (2024-2032)
Chapter 8. Regional Market Analysis – Global Overview
- 8.1 Global Regional Overview
- 8.1.1 Regional Volume Share
- 8.1.2 Regional Revenue Share
- 8.1.3 Regional Volume by Region
- 8.1.4 Regional Revenue by Region
- 8.1.5 Regional Forecast Through 2032
- 8.2 Cross-Regional Segment Analysis
- 8.2.1 By Distribution Channel
- 8.2.2 By Brand/Price Tier
Chapter 9. North America Currency Management Market
- 9.1 United States
- 9.2 Canada
- 9.3 Mexico
Chapter 10. Europe Currency Management Market
- 10.1 Germany
- 10.2 France
- 10.3 Italy
- 10.4 United Kingdom
- 10.5 Spain
- 10.6 Poland
- 10.7 Russia
- 10.8 Netherlands
- 10.9 Belgium
- 10.10 Sweden
- 10.11 Denmark
- 10.12 Norway
- 10.13 Rest of Europe
Chapter 11. Asia Pacific Currency Management Market
- 11.1 China
- 11.2 India
- 11.3 Japan
- 11.4 South Korea
- 11.5 Thailand
- 11.6 Indonesia
- 11.7 Vietnam
- 11.8 Malaysia
- 11.9 Australia
- 11.10 Rest of Asia Pacific
Chapter 12. Latin America Currency Management Market
- 12.1 Brazil
- 12.2 Argentina
- 12.3 Colombia
- 12.4 Chile
- 12.5 Rest of Latin America
Chapter 13. Middle East Currency Management Market
- 13.1 Saudi Arabia
- 13.2 United Arab Emirates
- 13.3 Turkey
- 13.4 Israel
- 13.5 Iran
- 13.6 Rest of the Middle East
Chapter 14. Africa Currency Management Market
- 14.1 South Africa
- 14.2 Egypt
- 14.3 Nigeria
- 14.4 Morocco
- 14.5 Rest of Africa
Chapter 15. Currency Management Company Profiles
- 15.1 [Company 01]
- 15.1.1 Company Overview
- 15.1.2 Key Management Personnel
- 15.1.3 Products & Services Portfolio
- 15.1.4 Financial Performance
- 15.1.5 Key Market Focus & Geographic Presence
- 15.1.6 Recent Developments & Strategic Initiatives
Note: The company profile list is preliminary and may change based on research findings, market developments, data availability, and client requirements.
Chapter 16. Appendices
- Appendix A – List of Abbreviations & Acronyms
- Appendix B – Industry Classification Code Reference – Full Series
- Appendix C – Production & Capacity Data Tables
- Appendix D – End-Use & Demand Base Tables
- Appendix E – Consumption & Replacement Rate Assumptions
- Appendix F – ASP Reference Tables
- Appendix G – Manufacturing & Facility Database
- Appendix H – Import-Export Data Tables
- Appendix I – Regulatory Summary Tables
- Appendix J – Primary Research Participant List (Anonymized)
- Appendix K – Primary Research Questionnaire Framework
- Appendix L – Data Sources & Bibliography
- Appendix M – Market Size Divergence & Source Comparison
Chapter 17. Research Methodology
- 17.1 Research Framework & Philosophy
- 17.2 Secondary Research – Sources, Hierarchy & Data Extraction
- 17.3 Data Modeling – Bottom-Up & Top-Down Market Sizing
- 17.4 Primary Research – Stakeholder Framework, LOI & Sample Sizes
- 17.5 Forecast Methodology – Regression, Scenario & Sensitivity Analysis
- 17.6 Quality Control – Four-Layer Validation Framework
- 17.7 Limitations & Standard Assumptions
- 17.8 Disclaimer
