
| REPORT ATTRIBUTE | DETAILS |
|---|---|
| Historical Period | 2020-2023 |
| Base Year | 2024 |
| Forecast Period | 2025-2032 |
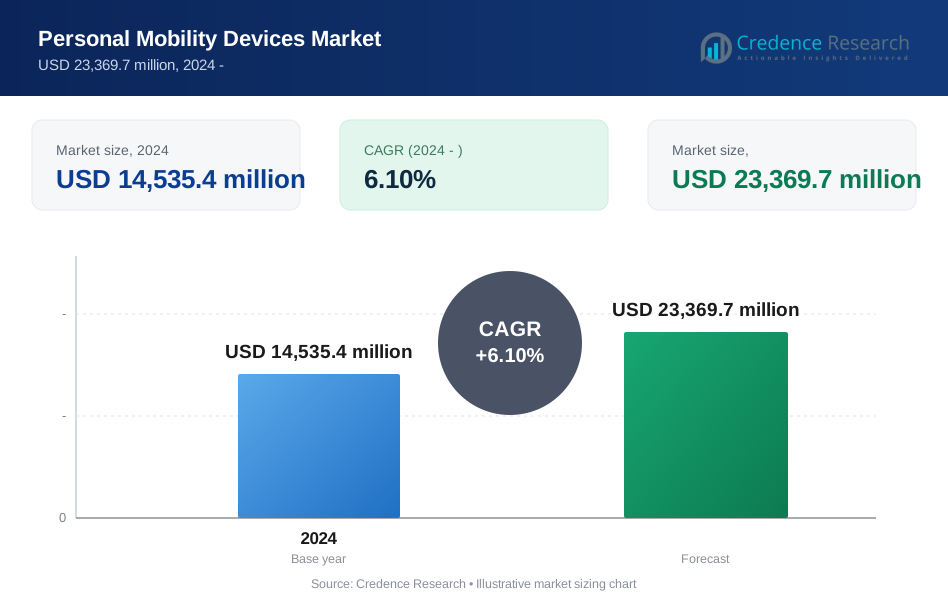
| Personal Mobility Devices market Size 2024 | USD 14,535.4 million |
| Personal Mobility Devices market, CAGR | 6.10% |
| Personal Mobility Devices market Size 2032 | USD 23,369.7 million |
Market Overview:
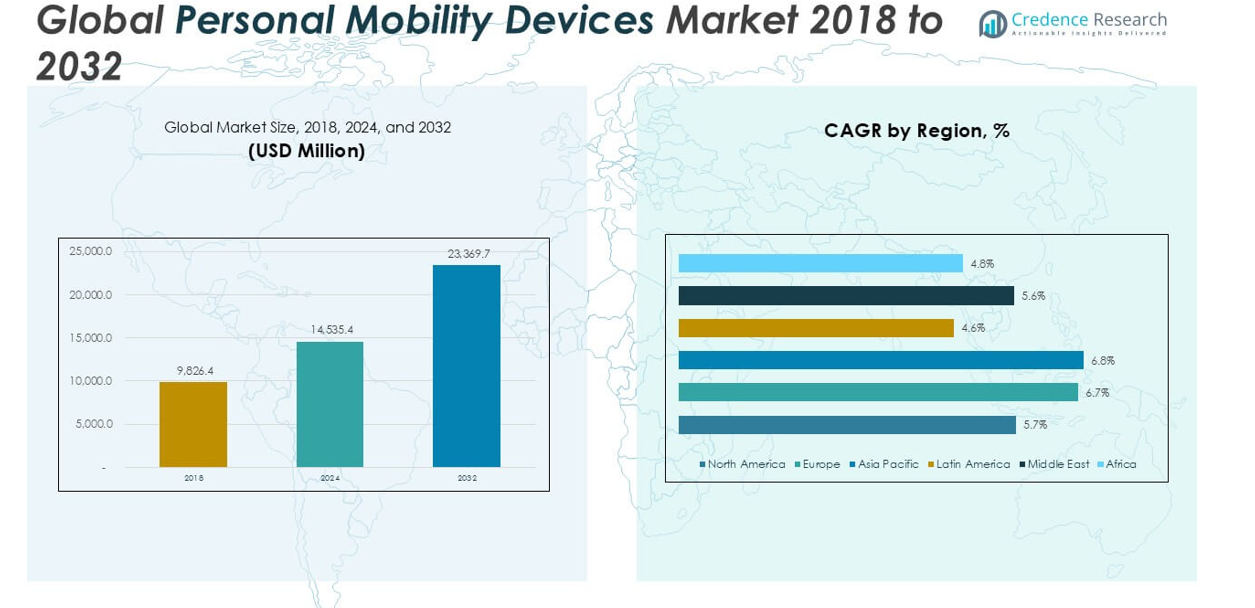
The Personal Mobility Devices market size was valued at USD 9,826.4 million in 2018, increased to USD 14,535.4 million in 2024, and is anticipated to reach USD 23,369.7 million by 2032, at a CAGR of 6.10% during the forecast period.
The Personal Mobility Devices market features key players such as Pride Mobility Products Corp., Invacare Corporation, Drive DeVilbiss Healthcare, Sunrise Medical LLC, Permobil AB, and Stryker Corporation, all recognized for their comprehensive product portfolios and strong innovation capabilities. These companies maintain a competitive edge through continuous product development and strategic partnerships. North America leads the market, accounting for approximately 32% of the global share, driven by advanced healthcare infrastructure and high adoption rates of mobility solutions. Europe and Asia Pacific follow as significant regions, benefiting from growing elderly populations and rising awareness of assistive technologies.
Market Insights
- The Personal Mobility Devices market reached USD 14,535.4 million in 2024 and is expected to grow to USD 23,369.7 million by 2032, reflecting a CAGR of 6.10%.
- Rising geriatric population and increasing prevalence of mobility-related disabilities are major drivers, supporting higher demand for advanced wheelchairs, walking aids, and mobility scooters.
- The market shows a strong trend towards smart and powered devices, with powered wheelchairs and mobility scooters holding the largest segment shares due to enhanced independence and technological innovation.
- Key players such as Pride Mobility Products Corp., Invacare Corporation, and Sunrise Medical LLC compete through product differentiation, but high device costs and limited insurance coverage act as significant restraints for market expansion.
- North America leads the market with a 32% share, followed by Asia Pacific at 27% and Europe at 21%, while powered wheelchairs remain the dominant sub-segment across all regions.
Market Segmentation Analysis:
By Product Type:
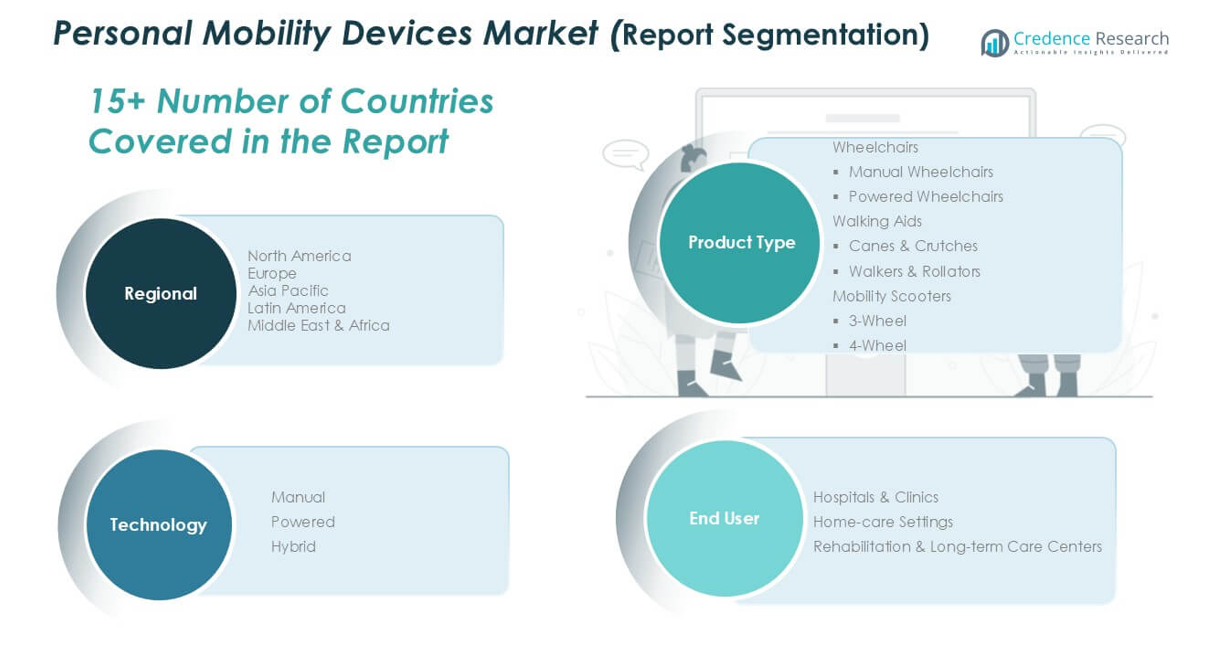
The Personal Mobility Devices market segments by product type into wheelchairs, walking aids, and mobility scooters. Wheelchairs dominate the market, accounting for the largest share due to high adoption in both acute and chronic mobility impairments. Within wheelchairs, powered wheelchairs represent the dominant sub-segment, driven by their growing use among the elderly and disabled population seeking greater independence and comfort. The increased prevalence of disabilities, the aging global population, and technological advancements in powered mobility solutions further support the robust market position of powered wheelchairs over manual options and other device types.
- For instance, Permobil’s M3 Corpus powered wheelchair includes an ActiveReach seat elevation system, allowing users to elevate their seat by up to 300 millimeters (mm) and maintain speeds of 5 kilometers per hour (km/h) while elevated.
By Technology:
Based on technology, the market is categorized into manual, powered, and hybrid mobility devices. Powered devices hold the largest market share, fueled by rising demand for advanced mobility assistance and user-friendly controls. Technological innovations in battery performance, lightweight frames, and enhanced maneuverability drive the adoption of powered mobility devices, especially among users with severe mobility limitations. The manual segment continues to serve users requiring basic functionality and cost-effectiveness, while the hybrid category remains niche but is gradually expanding through integration of smart features.
- For instance, Invacare’s TDX SP2 Power Wheelchair utilizes LiNX technology with up to 6 programmable driving profiles and provides a battery range of up to 32 kilometers (km) per full charge.
By End-user:
Among end-users, hospitals & clinics, home-care settings, and rehabilitation & long-term care centers comprise the major segments. Home-care settings lead the market with the highest share, reflecting the global shift toward at-home patient care and the preference for maintaining independence among elderly and disabled individuals. This dominance is supported by the rising availability of customized mobility devices and the expansion of home healthcare services. Rehabilitation & long-term care centers and hospitals & clinics continue to play critical roles but see slower growth compared to the robust demand in home-care environments.
Market Overview
Growing Geriatric Population
An expanding geriatric population drives demand in the Personal Mobility Devices market, as aging individuals experience a higher incidence of mobility impairments and chronic health conditions. This demographic shift significantly increases the need for advanced wheelchairs, walking aids, and mobility scooters. Healthcare systems worldwide focus on improving quality of life for seniors, leading to greater adoption of mobility devices designed for comfort, independence, and safety. Rising life expectancy and increased healthcare access further accelerate market growth, positioning elderly care as a central driver for device adoption.
- For instance, Sunrise Medical’s QUICKIE Q500 M SEDEO PRO wheelchair offers a multi-adjustable seat with a tilt-in-space function up to 50 degrees, and a backrest recline range of up to 170 degrees, supporting users with complex postural needs.
Technological Advancements in Mobility Solutions
Rapid innovation in mobility technology boosts market growth, with manufacturers introducing devices featuring lightweight materials, longer-lasting batteries, smart controls, and ergonomic designs. Powered wheelchairs and scooters equipped with advanced navigation and connectivity options enhance user independence. These technological improvements increase device appeal among a broader demographic, including younger users with mobility challenges. The integration of telehealth, IoT, and remote monitoring features not only improves user experience but also opens new avenues for market expansion in the personal mobility segment.
- For instance, Pride Mobility’s Jazzy Air 2 elevating power chair can raise users by 305 millimeters (mm) in just 11 seconds, while maintaining a driving speed of up to 6.4 kilometers per hour (km/h) in the elevated position.
Expanding Home Healthcare Services
A global shift toward home healthcare and patient-centered services significantly supports market growth. More individuals and families opt for in-home care due to convenience, cost-effectiveness, and a desire for personalized medical attention. This trend drives higher adoption of personal mobility devices suitable for home environments, including compact scooters, foldable wheelchairs, and adaptable walking aids. The rising availability of home care support and reimbursement policies strengthens this growth driver, making mobility solutions more accessible to patients outside of clinical settings.
Key Trends & Opportunities
Emergence of Smart and Connected Devices
The market is witnessing a growing trend toward smart and connected mobility devices. Manufacturers incorporate features like GPS tracking, fall detection, remote diagnostics, and app-based controls, which significantly enhance user safety and device management. This trend meets the rising expectations of tech-savvy consumers and healthcare professionals who seek real-time health and usage data. The integration of digital health technologies not only differentiates products but also creates new revenue streams for manufacturers, shaping future opportunities in the market.
- For instance, Permobil’s MyPermobil app delivers real-time location tracking and battery status for power wheelchairs, and can store and display up to 30 days’ worth of travel data, allowing users and clinicians to review daily mobility patterns.
Customization and Personalization Opportunities
Personalization has emerged as a key opportunity in the Personal Mobility Devices market. Increasingly, end-users demand tailored mobility solutions that address their specific medical needs, comfort preferences, and lifestyle requirements. Companies respond by offering customizable options such as adjustable seat heights, modular accessories, and aesthetic choices. This trend supports user satisfaction and device compliance, while also allowing manufacturers to cater to niche segments and differentiate their brands in a competitive landscape.
- For instance, Ottobock’s Avantgarde 4 manual wheelchair is available in over 20 frame configurations and up to 15 different color choices, supporting weights up to 140 kilograms (kg), and offering precise adaptation to individual user needs.
Key Challenges
High Cost of Advanced Devices
One of the main challenges in the Personal Mobility Devices market is the high cost associated with advanced powered devices and smart features. Many end-users, especially in developing regions, find these products financially inaccessible despite their benefits. Limited insurance coverage and reimbursement for mobility aids further hinder market penetration, particularly for technologically sophisticated options.
Regulatory and Reimbursement Complexities
Navigating diverse regulatory standards and complex reimbursement procedures presents a significant challenge for manufacturers and end-users. Variability in device approval processes and insurance reimbursement policies across regions creates barriers to market entry and slows adoption. Companies face additional costs and delays in bringing innovative products to market, impacting overall growth potential.
Limited Awareness and Training
Limited awareness about the full spectrum of available personal mobility devices, coupled with inadequate user training, restricts market growth. Many potential users remain unaware of advanced features or the suitability of different devices for their conditions. Lack of proper training and support can lead to device misuse, poor user experience, and increased risk of accidents or injuries, underscoring the need for better education and after-sales service.
Regional Analysis
North America:
North America commands the largest share of the Personal Mobility Devices market, with its value reaching USD 4,653.81 million in 2024, up from USD 3,221.08 million in 2018. The region accounts for approximately 32% of the global market and is projected to reach USD 7,244.60 million by 2032, growing at a CAGR of 5.7%. High adoption rates of advanced mobility solutions, robust healthcare infrastructure, and a large geriatric population support regional market growth. Strong reimbursement frameworks and continuous technological innovation further consolidate North America's leadership in the global landscape.
Europe:
Europe holds the second-largest share in the Personal Mobility Devices market, accounting for nearly 21% of the global total. The market stood at USD 1,998.68 million in 2018 and rose to USD 3,066.13 million in 2024, with expectations to reach USD 5,164.70 million by 2032 at a CAGR of 6.7%. The region benefits from widespread public healthcare systems, high awareness of assistive technologies, and a rapidly aging population. Favorable government initiatives and rising demand for premium mobility devices strengthen Europe’s position as a significant contributor to global market expansion.
Asia Pacific:
Asia Pacific represents a dynamic and fast-growing region in the Personal Mobility Devices market, contributing around 27% of the global share. The market expanded from USD 2,587.28 million in 2018 to USD 3,993.49 million in 2024 and is expected to reach USD 6,777.21 million by 2032, at a CAGR of 6.8%. Factors such as a large aging population, improving healthcare infrastructure, and rising disposable incomes drive regional demand. Increasing investments in healthcare and government focus on elderly care services are boosting adoption of advanced mobility devices in the region.
Latin America:
Latin America’s share of the Personal Mobility Devices market remains moderate, with the market valued at USD 1,408.06 million in 2024, up from USD 1,026.86 million in 2018. The region is projected to reach USD 2,026.15 million by 2032, registering a CAGR of 4.6%. Market growth is driven by improving access to healthcare and rising awareness of assistive devices. While adoption rates lag behind more developed regions, ongoing efforts to expand healthcare coverage and increasing urbanization contribute positively to the market’s outlook in Latin America.
Middle East:
The Middle East accounts for a smaller but steadily growing share in the Personal Mobility Devices market. Market value increased from USD 698.65 million in 2018 to USD 1,007.92 million in 2024 and is anticipated to reach USD 1,565.77 million by 2032, reflecting a CAGR of 5.6%. Factors such as improving healthcare infrastructure, increasing prevalence of chronic diseases, and growing investments in elder care drive demand. Expanding insurance coverage and government health initiatives also support regional market growth, positioning the Middle East as an emerging opportunity in the sector.
Africa:
Africa contributes a limited share to the global Personal Mobility Devices market, valued at USD 405.95 million in 2024 from USD 293.81 million in 2018. The market is forecasted to reach USD 591.25 million by 2032, achieving a CAGR of 4.8%. Growth is primarily supported by increasing healthcare investments and expanding awareness of mobility solutions across urban centers. Despite ongoing challenges related to affordability and healthcare access, Africa’s market outlook remains positive as efforts continue to improve healthcare delivery and assistive device accessibility for the region’s aging and disabled population.
Market Segmentations:
By Product Type:
- Wheelchairs
- Manual Wheelchairs
- Powered Wheelchairs
- Walking Aids
- Canes & Crutches
- Walkers & Rollators
- Mobility Scooters
- 3-Wheel
- 4-Wheel
By Technology:
- Manual
- Powered
- Hybrid
By End-user:
- Hospitals & Clinics
- Home-care Settings
- Rehabilitation & Long-term Care Centers
By Geography:
- North America
- U.S.
- Canada
- Mexico
- Europe
- Germany
- France
- U.K.
- Italy
- Spain
- Rest of Europe
- Asia Pacific
- China
- Japan
- India
- South Korea
- South-east Asia
- Rest of Asia Pacific
- Latin America
- Brazil
- Argentina
- Rest of Latin America
- Middle East & Africa
- GCC Countries
- South Africa
- Rest of the Middle East and Africa
Competitive Landscape
The competitive landscape of the Personal Mobility Devices market is characterized by the presence of several prominent players focused on innovation, product quality, and expanding global reach. Leading companies such as Pride Mobility Products Corp., Invacare Corporation, Drive DeVilbiss Healthcare, Sunrise Medical LLC, Permobil AB, and GF Health Products Inc. command significant market shares due to their robust product portfolios and established distribution networks. These firms invest heavily in research and development to introduce advanced mobility solutions with features like lightweight materials, enhanced battery life, and smart connectivity. Strategic collaborations, mergers, and acquisitions enable market participants to strengthen their market positions and expand their offerings. New entrants and regional manufacturers intensify competition by targeting niche segments and cost-sensitive customers. Continuous advancements in technology and growing demand for customized devices drive companies to differentiate their products, fostering a dynamic and competitive environment in the global Personal Mobility Devices market.
Key Player Analysis
- Pride Mobility Products Corp.
- Invacare Corporation
- Drive DeVilbiss Healthcare
- Sunrise Medical LLC
- Permobil AB
- GF Health Products Inc.
- Stryker Corporation
- Ottobock SE & Co. KGaA
- Medline Industries LP
- Arjo AB
- Kaye Products Inc.
- Amigo Mobility International
Recent Developments
- In March 2025, Stryker showcased the next generation of its Mako SmartRobotics™ system at the AAOS 2025 Annual Meeting, highlighting advancements in robotic-assisted procedures for hip, knee, spine, and shoulder surgeries. While primarily surgical, these robotics systems enhance post-surgical mobility outcomes for patients.
- In September 2024, Invacare Corporation celebrated winning a WebAward for their "Move For Mobility" campaign. The campaign, a collaboration with Free Wheelchair Mission, earned awards in the "Medical Standard of Excellence" and "Non-Profit Standard of Excellence" categories.
- In April 2023, Medline Industries LP Partnered with Martha Stewart to introduce a line of stylish, functional safety and mobility aids, including adjustable walking canes and home safety products designed for both aesthetics and support.
Market Concentration & Characteristics
The Personal Mobility Devices Market displays a moderate to high level of concentration, with a few leading companies accounting for a significant share of global revenue. It features well-established players such as Pride Mobility Products Corp., Invacare Corporation, Drive DeVilbiss Healthcare, Sunrise Medical LLC, Permobil AB, and Stryker Corporation, all recognized for their innovation and comprehensive product offerings. The market’s characteristics include a strong emphasis on technological advancement, customization, and user comfort, with powered devices and smart solutions gaining traction. Entry barriers remain moderate due to regulatory requirements, investment in research and development, and established distribution networks. The market is highly responsive to demographic shifts, particularly the global increase in the elderly population and rising incidence of mobility-related disabilities. Regional market shares reflect mature demand in North America and Europe, while Asia Pacific’s growing healthcare infrastructure supports rapid adoption. The ability to offer cost-effective and technologically advanced solutions continues to shape competitive dynamics.
Report Coverage
The research report offers an in-depth analysis based on Product Type, Technology, End-user and Geography. It details leading market players, providing an overview of their business, product offerings, investments, revenue streams, and key applications. Additionally, the report includes insights into the competitive environment, SWOT analysis, current market trends, as well as the primary drivers and constraints. Furthermore, it discusses various factors that have driven market expansion in recent years. The report also explores market dynamics, regulatory scenarios, and technological advancements that are shaping the industry. It assesses the impact of external factors and global economic changes on market growth. Lastly, it provides strategic recommendations for new entrants and established companies to navigate the complexities of the market.
Future Outlook
- Increasing automation and AI integration will enhance navigation and safety in personal mobility devices.
- Battery technology improvements will enable longer usage times and faster charging capabilities.
- Growing demand for compact and foldable designs will suit urban and constrained living environments.
- Expansion of telehealth and remote monitoring systems will optimize device performance and maintenance.
- Customization options will proliferate to cater to specific medical and lifestyle needs.
- Enhanced connectivity through app-based controls will improve user experience and device management.
- Entry of new regional manufacturers will create price competition and expand accessibility.
- Stricter safety standards and regulatory frameworks will drive higher-quality, reliable products.
- Integration of lightweight materials will reduce device weight and improve maneuverability.
- Collaboration between manufacturers and insurance providers will increase affordability and adoption rates.
Request a Free Sample
Fill in your details and we'll send you a free sample report.
- Sample data tables & charts
- Research methodology
Need a Custom Version of This Report?
Tailor the scope, geography, or segments to your exact requirements.
- Custom geography or segment scope
- Direct access to our analyst team
Frequently Asked Questions
What is the size of Personal Mobility Devices Market?
What factors are driving the growth of the Personal Mobility Devices Market?
What are the key segments within the Personal Mobility Devices Market?
Who are the major players in this market?
Table of Content
Chapter 1. Report Introduction
- 1.1 Report Description & Purpose
- 1.1.1 Report Title & Market Definition
- 1.1.2 Unique Selling Propositions (USP) & Key Differentiators
- 1.1.3 Value Proposition for Stakeholders
- 1.2 Research Objectives
- 1.2.1 Market Sizing Objectives (Volume & Revenue)
- 1.2.2 Segmentation Objectives
- 1.2.3 Competitive Intelligence Objectives
- 1.2.4 Forecast & Scenario Objectives
- 1.3 Report Scope
- 1.3.1 Personal Mobility Devices Scope – Types & Subtypes Covered
- 1.3.2 Geographic Scope – Regions & Countries Covered
- 1.3.3 Historical Period, Base Year & Forecast Period (2024; forecast to the forecast period)
- 1.3.4 Inclusions & Exclusions
- 1.4 HS Code & Classification Framework
- 1.5 Currency, Units & Pricing Basis
- 1.6 Target Stakeholders
- 1.7 Limitations & Assumptions
Chapter 2. Executive Summary
- 2.1 Global Personal Mobility Devices Market Snapshot
- 2.1.1 Market Size – Historical (2024) & Forecast (the forecast period) (2024: USD 14,535.4 million → forecast year: USD 23,369.7 million)
- 2.1.2 Volume & Revenue – Global Totals
- 2.1.3 Key Market Highlights – Top Five Facts
- 2.2 Personal Mobility Devices Market Segmentation Snapshot
- 2.2.1 Market Split by Region – 2024 vs.
- 2.3 Competitive Snapshot
- 2.3.1 Top 10 Players by Revenue Share – 2024
- 2.3.2 Top 10 Players by Volume Share – 2024
- 2.3.3 Recent Strategic Developments (18-Month Summary)
- 2.4 Key Investment Highlights & Strategic Conclusions
Chapter 3. Personal Mobility Devices Market Dynamics & Industry Analysis
- 3.1 Market Overview & Context
- 3.1.1 Personal Mobility Devices Market Position in the Broader Automotive Value Chain
- 3.1.2 OEM vs. Replacement Market Dynamics
- 3.1.3 Market Maturity & Development Stage by Region
- 3.2 Personal Mobility Devices Market Drivers
- 3.3 Personal Mobility Devices Market Restraints & Challenges
- 3.4 Personal Mobility Devices Market Opportunities
- 3.5 Porter's Five Forces Analysis
- 3.5.1 Threat of New Entrants
- 3.5.2 Bargaining Power of Suppliers
- 3.5.3 Bargaining Power of Buyers
- 3.5.4 Threat of Substitutes
- 3.5.5 Competitive Rivalry – Intensity Assessment
- 3.6 Personal Mobility Devices Value Chain Analysis
- 3.6.1 Upstream – Raw Material/Input Suppliers
- 3.6.1.1 Raw Material/Input 1
- 3.6.1.2 Raw Material/Input 2
- 3.6.1.3 Raw Material/Input 3
- 3.6.2 Midstream – Production/Manufacturing/Service Delivery
- 3.6.2.1 Production/Process Overview
- 3.6.2.2 Key Facility Locations & Capacity by Manufacturer
- 3.6.3 Downstream – Distribution & End Consumer
- 3.6.3.1 Primary Channel – B2B/OEM
- 3.6.3.2 Secondary Channels – Dealer, Retail, Online, Direct
- 3.6.4 Value Chain Profitability Analysis
- 3.6.1 Upstream – Raw Material/Input Suppliers
- 3.7 PESTEL Analysis
- 3.7.1 Political Factors
- 3.7.2 Economic Factors
- 3.7.3 Social Factors
- 3.7.4 Technological Factors
- 3.7.5 Environmental Factors
- 3.7.6 Legal Factors
- 3.8 Personal Mobility Devices Supply Chain Analysis
- 3.8.1 Raw Material/Input Supply Risk Assessment
- 3.8.2 Manufacturing Concentration Risk (Geographic Exposure)
- 3.8.3 Trade Disruption Impact Analysis
- 3.9 Regulatory & Policy Landscape
Note: The regulatory and policy landscape section covers regulations based on their applicability to the market, Personal Mobility Devices category, geography, and scope of the study. Only regulatory frameworks with a material impact on operations, compliance, trade, sustainability, or market access are analyzed in detail.
Chapter 4. Key Investment Pockets & Opportunity Analysis
- 4.1 Personal Mobility Devices Market Attractiveness Analysis
- 4.1.1 By Region – Investment Attractiveness Matrix (Volume × CAGR)
- 4.2 Absolute Revenue Growth Opportunity
- 4.2.1 By Region – Absolute USD Growth Through the forecast period
- 4.3 Incremental Volume Opportunity
- 4.3.1 By Region – Incremental Volume Through the forecast period
- 4.3.2 Segment – Incremental Volume
- 4.4 Emerging Submarket Opportunity Deep Dive (Subject to Applicability)
- 4.5 Emerging Market Opportunity Scorecards
- 4.5.1 United States
- 4.5.2 Europe
- 4.5.3 Asia
- 4.5.4 Middle East & Africa
Note: Emerging Market Opportunity Scorecards will be included based on relevance and strategic importance. Regions listed are indicative and may vary depending on data availability and market dynamics.
Chapter 5. Personal Mobility Devices Import-Export Analysis & Trade Flows
- 5.1 Global Trade Overview
- 5.1.1 Global Export Value by Country (2024)
- 5.1.2 Global Export Volume by Country (2024)
- 5.1.3 Global Import Value by Country (2024)
- 5.1.4 Global Import Volume by Country (2024)
- 5.1.5 Net Trade Balance by Country (2024)
- 5.2 Export Analysis – Segment
- 5.2.1 Type 1 (HS Code)
- 5.2.2 Type 2 (HS Code)
- 5.2.3 Type 3 (HS Code)
- 5.2.4 Type 4 (HS Code)
- 5.2.5 Type 5 (HS Code)
- 5.3 Import Analysis – Segment
- 5.3.1 Type 1 (HS Code)
- 5.3.2 Type 2 (HS Code)
- 5.3.3 Type 3 (HS Code)
- 5.3.4 Type 4 (HS Code)
- 5.3.5 Type 5 (HS Code)
- 5.4 Average Unit Trade Prices
- 5.4.1 Average Export Price – Segment & Country
- 5.4.2 Average Import Price – Segment & Source Country
- 5.4.3 Price Trends (2024)
- 5.5 Key Trade Route Analysis
- 5.5.1 Trade Route 1
- 5.5.2 Trade Route 2
- 5.5.3 Trade Route 3
- 5.5.4 Trade Route 4
- 5.5.5 Trade Route 5
- 5.6 Trade Policy Impact Assessment
- 5.6.1 US Anti-Dumping & Section 301 Tariffs
- 5.6.2 EU Customs Union Impact
- 5.6.3 Major Free Trade Agreements
- 5.6.4 USMCA Rules of Origin
Note: Trade policy analysis will be included only where relevant to the Personal Mobility Devices market.
Chapter 6. Competitive Landscape & Company Benchmarking
- 6.1 Personal Mobility Devices Market Concentration & Structure
- 6.1.1 Herfindahl-Hirschman Index (HHI) – vs. 2024
- 6.1.2 Tier 1, Tier 2 & Tier 3 Market Structure
- 6.1.3 Global, Regional & Local Player Dynamics
- 6.2 Personal Mobility Devices Market Share Analysis – 2024
- 6.2.1 Global Revenue Share by Company
- 6.2.2 Global Volume Share by Company
- 6.2.3 Regional Revenue Share
- 6.2.4 Market Share Evolution ( vs. 2024)
- 6.2.5 OEM Segment Share by Company
- 6.2.6 Replacement Segment Share by Company
- 6.3 Production/Delivery Capacity & Facility Analysis
- 6.3.1 Global Installed Capacity
- 6.3.2 Capacity Utilization Rates
- 6.3.3 Production/Output Volume
- 6.3.4 Facility Locations & Capacity Map
- 6.3.5 Planned Capacity Additions
- 6.4 Personal Mobility Devices Competitive Benchmarking Matrix
- 6.4.1 Revenue, Volume, CAGR & Profitability Comparison
- 6.4.2 Channel Revenue Mix
- 6.4.3 Geographic Revenue Exposure
- 6.4.4 R&D Intensity
- 6.4.5 Sustainability Maturity
- 6.5 Strategic Developments in Personal Mobility Devices (Last 24 Months)
- 6.5.1 Mergers, Acquisitions & Divestments
- 6.5.2 New Personal Mobility Devices Launches
- 6.5.3 Facility Expansions
- 6.5.4 Strategic Alliances, Joint Ventures & Partnerships
- 6.5.5 Distribution Expansion & Market Entry
- 6.5.6 Sustainability & ESG Initiatives
- 6.6 Competitive Strategy Mapping
- 6.6.1 Leader, Challenger, Follower & Niche Classification
- 6.6.2 Pricing Strategy Comparison
- 6.6.3 Channel Strategy Matrix
Note: Strategic developments are included based on their materiality and the availability of reliable information.
Chapter 7. Global Personal Mobility Devices Market – By Distribution Channel
- 7.1 Segment Overview
- 7.1.1 Volume & Revenue Split by Channel (2024 & )
- 7.1.2 Channel Mix Evolution (the forecast period)
Chapter 8. Regional Market Analysis – Global Overview
- 8.1 Global Regional Overview
- 8.1.1 Regional Volume Share
- 8.1.2 Regional Revenue Share
- 8.1.3 Regional Volume by Region
- 8.1.4 Regional Revenue by Region
- 8.1.5 Regional Forecast Through the forecast period
- 8.2 Cross-Regional Segment Analysis
- 8.2.1 By Distribution Channel
- 8.2.2 By Brand/Price Tier
Chapter 9. North America Personal Mobility Devices Market
- 9.1 United States
- 9.2 Canada
- 9.3 Mexico
Chapter 10. Europe Personal Mobility Devices Market
- 10.1 Germany
- 10.2 France
- 10.3 Italy
- 10.4 United Kingdom
- 10.5 Spain
- 10.6 Poland
- 10.7 Russia
- 10.8 Netherlands
- 10.9 Belgium
- 10.10 Sweden
- 10.11 Denmark
- 10.12 Norway
- 10.13 Rest of Europe
Chapter 11. Asia Pacific Personal Mobility Devices Market
- 11.1 China
- 11.2 India
- 11.3 Japan
- 11.4 South Korea
- 11.5 Thailand
- 11.6 Indonesia
- 11.7 Vietnam
- 11.8 Malaysia
- 11.9 Australia
- 11.10 Rest of Asia Pacific
Chapter 12. Latin America Personal Mobility Devices Market
- 12.1 Brazil
- 12.2 Argentina
- 12.3 Colombia
- 12.4 Chile
- 12.5 Rest of Latin America
Chapter 13. Middle East Personal Mobility Devices Market
- 13.1 Saudi Arabia
- 13.2 United Arab Emirates
- 13.3 Turkey
- 13.4 Israel
- 13.5 Iran
- 13.6 Rest of the Middle East
Chapter 14. Africa Personal Mobility Devices Market
- 14.1 South Africa
- 14.2 Egypt
- 14.3 Nigeria
- 14.4 Morocco
- 14.5 Rest of Africa
Chapter 15. Personal Mobility Devices Company Profiles
- 15.1 [Company 01]
- 15.1.1 Company Overview
- 15.1.2 Key Management Personnel
- 15.1.3 Products & Services Portfolio
- 15.1.4 Financial Performance
- 15.1.5 Key Market Focus & Geographic Presence
- 15.1.6 Recent Developments & Strategic Initiatives
Note: The company profile list is preliminary and may change based on research findings, market developments, data availability, and client requirements.
Chapter 16. Appendices
- Appendix A – List of Abbreviations & Acronyms
- Appendix B – Industry Classification Code Reference – Full Series
- Appendix C – Production & Capacity Data Tables
- Appendix D – End-Use & Demand Base Tables
- Appendix E – Consumption & Replacement Rate Assumptions
- Appendix F – ASP Reference Tables
- Appendix G – Manufacturing & Facility Database
- Appendix H – Import-Export Data Tables
- Appendix I – Regulatory Summary Tables
- Appendix J – Primary Research Participant List (Anonymized)
- Appendix K – Primary Research Questionnaire Framework
- Appendix L – Data Sources & Bibliography
- Appendix M – Market Size Divergence & Source Comparison
Chapter 17. Research Methodology
- 17.1 Research Framework & Philosophy
- 17.2 Secondary Research – Sources, Hierarchy & Data Extraction
- 17.3 Data Modeling – Bottom-Up & Top-Down Market Sizing
- 17.4 Primary Research – Stakeholder Framework, LOI & Sample Sizes
- 17.5 Forecast Methodology – Regression, Scenario & Sensitivity Analysis
- 17.6 Quality Control – Four-Layer Validation Framework
- 17.7 Limitations & Standard Assumptions
- 17.8 Disclaimer
