Market Overview
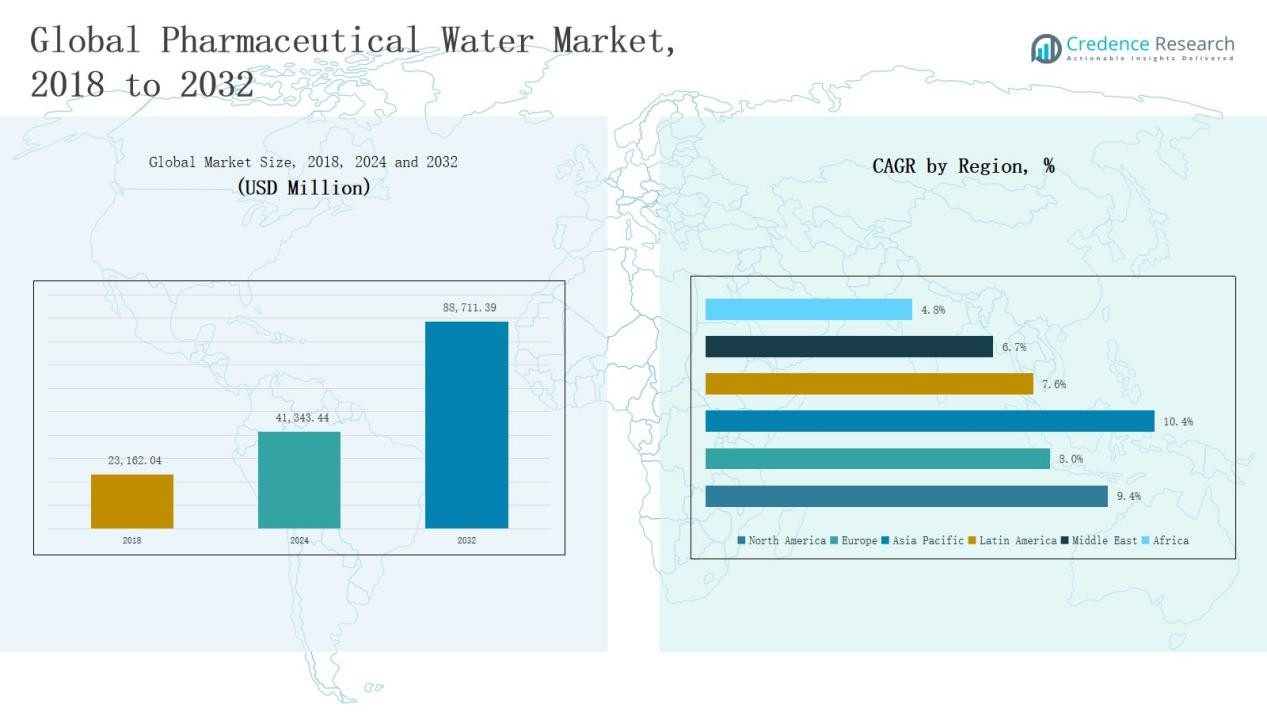
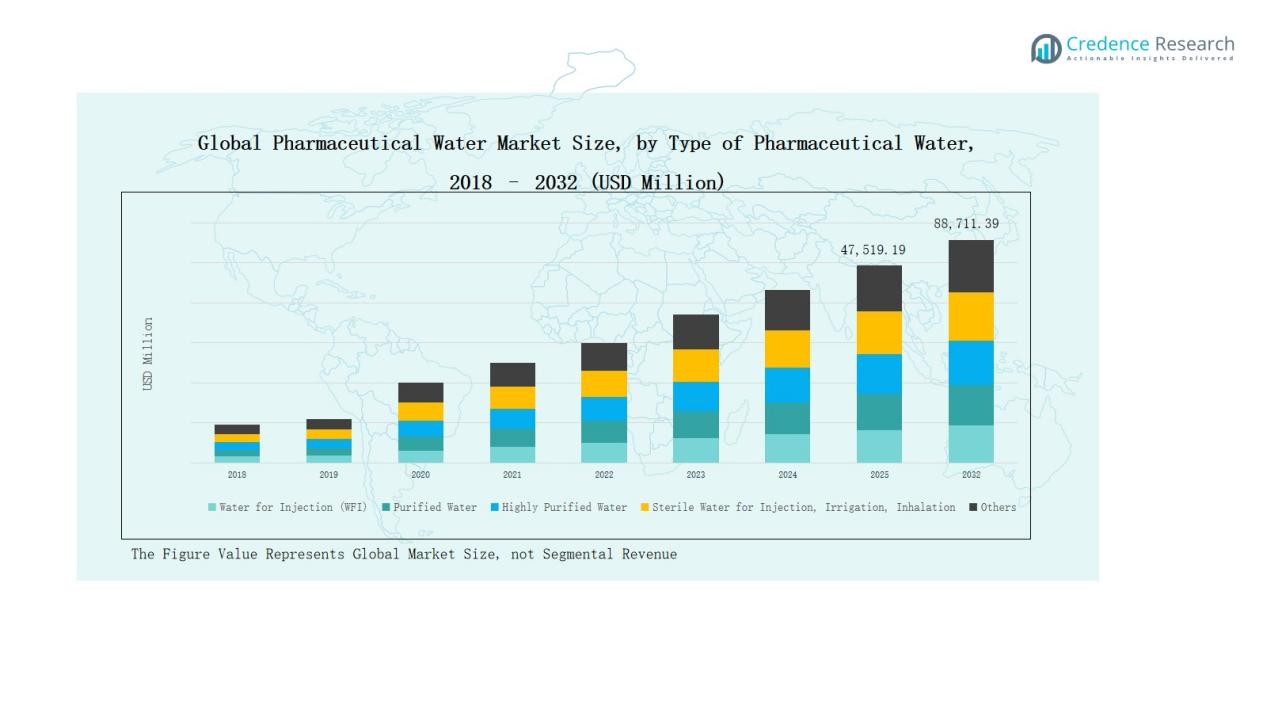
Global Pharmaceutical Water Market size was valued at USD 23,162.04 million in 2018, grew to USD 41,343.44 million in 2024, and is anticipated to reach USD 88,711.39 million by 2032, expanding at a CAGR of 9.33% during the forecast period.
| REPORT ATTRIBUTE |
DETAILS |
| Historical Period |
2020-2023 |
| Base Year |
2024 |
| Forecast Period |
2025-2032 |
| Pharmaceutical Water Market Size 2024 |
USD 41,343.44 Million |
| Pharmaceutical Water Market, CAGR |
9.33% |
| Pharmaceutical Water Market Size 2032 |
USD 88,711.39 Million |
The Pharmaceutical Water Market is led by major players such as Ecolab Inc., Veolia Environnement S.A., Thermo Fisher Scientific Inc., SUEZ Water Technologies & Solutions, Danaher Corporation, Evoqua Water Technologies LLC, Kurita Water Industries Ltd., Pall Corporation, ADC Water Management, and Dressler Group GmbH. These companies maintain strong competitive positions through advanced purification technologies, GMP-compliant systems, and strategic global partnerships. Their focus on automation, digital monitoring, and sustainability enhances process reliability and compliance. North America emerged as the leading region in 2024, commanding a 42% market share, supported by a robust pharmaceutical manufacturing base, strict FDA water standards, and ongoing biopharmaceutical expansion.
Access crucial information at unmatched prices!
Request your sample report today & start making informed decisions powered by Credence Research Inc.!
Download Sample
Market Insights
- The Global Pharmaceutical Water Market grew from USD 23,162.04 million in 2018 to USD 41,343.44 million in 2024, projected to reach USD 88,711.39 million by 2032 at a CAGR of 9.33%.
- Water for Injection (WFI) dominated by 42% share in 2024 due to its critical use in sterile drug and biopharmaceutical manufacturing.
- Reverse Osmosis (RO) held the leading position among technologies with a 38% share, driven by efficiency and compliance with pharmacopeia standards.
- Pharmaceutical & Biotechnology Manufacturing segment led with 57% share in 2024, supported by expanding vaccine and biologics production.
- North America emerged as the leading region with a 42% share, followed by Asia Pacific (32%) and Europe (17%), supported by strong regulatory frameworks and technological advancement.
Market Segment Insights
By Type of Pharmaceutical Water
Water for Injection (WFI) dominated the Pharmaceutical Water Market in 2024 with a 42% share. Its leadership stems from extensive use in sterile drug formulation, parenteral manufacturing, and biopharmaceutical processes requiring ultra-pure water. The segment benefits from strict GMP regulations and rising demand for injectable therapies. Increasing biologics production and advanced purification technologies further boost WFI adoption, reinforcing its dominance across large-scale pharmaceutical and biotechnology facilities worldwide.
- For instance, Pfizer expanded its WFI generation capacity at its Kalamazoo, Michigan plant, adding new multi-effect distillation units to support increased sterile injectable output.
By Treatment Technology
Reverse Osmosis (RO) led the Pharmaceutical Water Market in 2024, accounting for a 38% share. The segment’s dominance is driven by its efficiency in removing dissolved solids, microorganisms, and organic impurities at lower operating costs. Growing preference for multi-stage RO systems supports compliance with global pharmacopeia standards. Increasing integration with UV and electrodeionization systems enhances purity levels, making RO the preferred technology for high-capacity water purification in pharmaceutical and biotechnology applications.
- For instance, Veolia Water Technologies expanded its Orion product range in 2024 by introducing new RO-EDI systems specifically designed for water-for-injection pre-treatment, ensuring conductivity levels below 1 µS/cm.
By Application
Pharmaceutical & Biotechnology Manufacturing held the largest share of 57% in 2024. The segment growth is fueled by expanding production of vaccines, biosimilars, and sterile injectables requiring consistent water purity. Strict regulatory guidelines and quality assurance protocols promote large-scale adoption of advanced purification systems. Increasing investments in GMP-certified facilities and bioprocessing plants continue to strengthen this segment, as manufacturers prioritize reliable water supply for critical formulation, cleaning, and production processes.
Key Growth Driver
Rising Biopharmaceutical and Injectable Drug Production
Growing demand for biologics, vaccines, and sterile injectables drives the need for high-purity water systems. Pharmaceutical manufacturers increasingly invest in Water for Injection (WFI) and Purified Water technologies to meet stringent quality standards. The expansion of contract manufacturing organizations and advanced bioprocessing facilities further accelerates market growth. Rising global health needs, along with regulatory emphasis on contamination-free production, continue to boost the use of pharmaceutical-grade water in sterile formulation and parenteral drug manufacturing.
- For instance, GlaxoSmithKline (GSK) upgraded its high purity water and WFI generation systems at its R&D Biopharmaceutical Pilot Plant in Pennsylvania, installing redundant water systems that provide highly purified water with resistivity greater than 10 Mohm and total organic carbon below 5 ppb, improving reliability and sustainability while reducing yearly operational expenses by approximately $170,000.
Regulatory Compliance and Quality Standards
Strict guidelines from regulatory bodies such as the FDA, EMA, and WHO push pharmaceutical companies to implement validated water purification systems. Adherence to GMP and pharmacopeia standards ensures consistency in product quality and safety. Continuous audits and mandatory testing promote modernization of purification infrastructure. As pharmaceutical firms upgrade facilities to comply with evolving quality norms, the demand for advanced purification technologies such as RO, UV, and distillation systems continues to rise globally.
Technological Advancements in Water Treatment
Innovations in purification technologies enhance efficiency, automation, and sustainability in pharmaceutical water generation. Modern systems combine reverse osmosis, electrodeionization, and UV disinfection to ensure reliable microbial control and reduced operational costs. Smart monitoring and digital control features support predictive maintenance and minimize downtime. These advancements enable pharmaceutical manufacturers to meet strict purity standards while optimizing water recovery, energy efficiency, and system validation, strengthening overall market competitiveness and long-term reliability.
- For instance, Veolia’s Orion™ system integrates RO + continuous electrodeionization (CEDI) plus UV, and since 2016 it supports remote digital monitoring via its Hubgrade platform.
Key Trend & Opportunity
Integration of Digital Monitoring and Automation
Automation and digital monitoring are transforming pharmaceutical water management systems. Real-time data analytics and IoT sensors help track conductivity, microbial levels, and system performance. Automated control reduces human error and supports continuous GMP compliance. Companies are adopting cloud-based monitoring platforms to ensure regulatory traceability and operational efficiency. This digital shift not only enhances process validation but also opens opportunities for predictive maintenance and remote quality assurance in pharmaceutical facilities.
- For instance, Evoqua Water Technologies deployed its Water One® Cloud service in multiple U.S. pharmaceutical sites, enabling remote monitoring of purified water systems with instant alerts on microbial deviations and conductivity trends.
Sustainability and Water Reuse Initiatives
Pharmaceutical companies increasingly prioritize sustainability by adopting energy-efficient purification and water recovery systems. Technologies such as RO reject recovery, zero-liquid-discharge, and closed-loop reuse minimize environmental impact. Rising environmental regulations and corporate sustainability goals drive investment in eco-friendly purification setups. These initiatives not only lower operational costs but also improve brand credibility, making green purification technologies a key growth opportunity in the pharmaceutical water industry.
- For instance, AstraZeneca’s Södertälje site in Sweden piloted Pharem Biotech’s Zymatic bioreactor to remove up to 95 % of organic pollutants in wastewater.
Key Challenge
High Installation and Maintenance Costs
Establishing pharmaceutical-grade water systems involves substantial capital investment in purification units, storage tanks, and validation processes. Continuous maintenance, system monitoring, and regulatory documentation further add to operational expenses. Smaller manufacturers often face budget constraints, limiting their ability to upgrade infrastructure. The high cost of replacement parts, periodic calibration, and energy consumption continues to challenge affordability and scalability, particularly in emerging markets with limited financial and technical resources.
Stringent Validation and Compliance Requirements
The pharmaceutical water industry faces complex validation and documentation obligations under GMP and pharmacopeia standards. Maintaining system qualification and audit readiness demands skilled personnel and continuous monitoring. Failure to comply may result in production delays, recalls, or regulatory penalties. Frequent updates to global standards create additional challenges for companies operating across multiple markets. This compliance burden increases operational complexity and slows system implementation in highly regulated pharmaceutical environments.
Microbial Contamination Risks
Maintaining microbiological purity remains a critical challenge in pharmaceutical water systems. Biofilm formation, stagnant flow zones, and poor maintenance can lead to bacterial growth and endotoxin contamination. Even minor system breaches can compromise entire production batches. Continuous sanitization, real-time monitoring, and design optimization are essential to prevent contamination. Despite advanced purification technologies, ensuring consistent microbial control across distribution loops and storage systems remains a persistent operational and regulatory concern.
Regional Analysis
North America
North America dominated the Pharmaceutical Water Market in 2024 with a 42% share, valued at USD 17,393.16 million, up from USD 9,849.30 million in 2018. The market is projected to reach USD 37,427.29 million by 2032, growing at a CAGR of 9.4%. Strong regulatory frameworks, advanced pharmaceutical manufacturing facilities, and high adoption of Water for Injection (WFI) systems drive regional growth. Continuous investments in biopharmaceutical production and contract manufacturing, along with strict FDA water quality standards, sustain North America’s leadership in global pharmaceutical water demand.
Europe
Europe accounted for a 17% market share in 2024, increasing from USD 4,290.41 million in 2018 to USD 7,235.40 million, and is expected to reach USD 14,105.75 million by 2032 at a CAGR of 8.0%. The region benefits from stringent EMA regulations and growing biologics manufacturing across Germany, France, and the UK. Expansion of GMP-certified production facilities and modernization of purification systems enhance regional market strength. Europe’s focus on quality compliance and sustainable purification technologies supports consistent growth within the global pharmaceutical water landscape.
Asia Pacific
Asia Pacific emerged as the fastest-growing region with a 32% share in 2024, rising from USD 7,116.18 million in 2018 to USD 13,369.21 million, and is forecasted to reach USD 31,138.54 million by 2032 at a CAGR of 10.4%. Rapid industrialization, growing pharmaceutical exports, and increasing biopharmaceutical investments in China, Japan, and India fuel market expansion. Government incentives, rising local drug production, and adoption of advanced water purification systems contribute to its strong growth momentum across manufacturing and research applications.
Latin America
Latin America held a 5% market share in 2024, growing from USD 1,073.44 million in 2018 to USD 1,891.78 million, and is anticipated to reach USD 3,583.74 million by 2032 with a CAGR of 7.6%. The region benefits from expanding pharmaceutical production in Brazil and Argentina, supported by favorable regulatory reforms and foreign investments. Growing demand for purified and sterile water in generics and vaccine manufacturing strengthens market opportunities. Rising healthcare expenditure and modernization of pharmaceutical facilities further support market advancement.
Middle East
The Middle East represented a 3% share of the global market in 2024, increasing from USD 584.48 million in 2018 to USD 943.79 million, and is forecasted to reach USD 1,670.26 million by 2032 at a CAGR of 6.7%. Regional growth is driven by expanding pharmaceutical infrastructure in GCC countries, particularly Saudi Arabia and the UAE. Rising government healthcare investments and partnerships with international drug manufacturers promote adoption of compliant purification systems. The region’s strategic focus on self-sufficiency in pharmaceutical production further enhances long-term growth potential.
Africa
Africa accounted for a 1% market share in 2024, increasing from USD 248.23 million in 2018 to USD 510.10 million, and projected to reach USD 785.81 million by 2032 at a CAGR of 4.8%. Market growth is supported by expanding healthcare access and rising local drug manufacturing, particularly in South Africa and Egypt. Limited infrastructure and high system costs currently restrict large-scale adoption. However, international partnerships and gradual regulatory standardization are expected to drive steady demand for purified water systems in the coming years.
Market Segmentations:
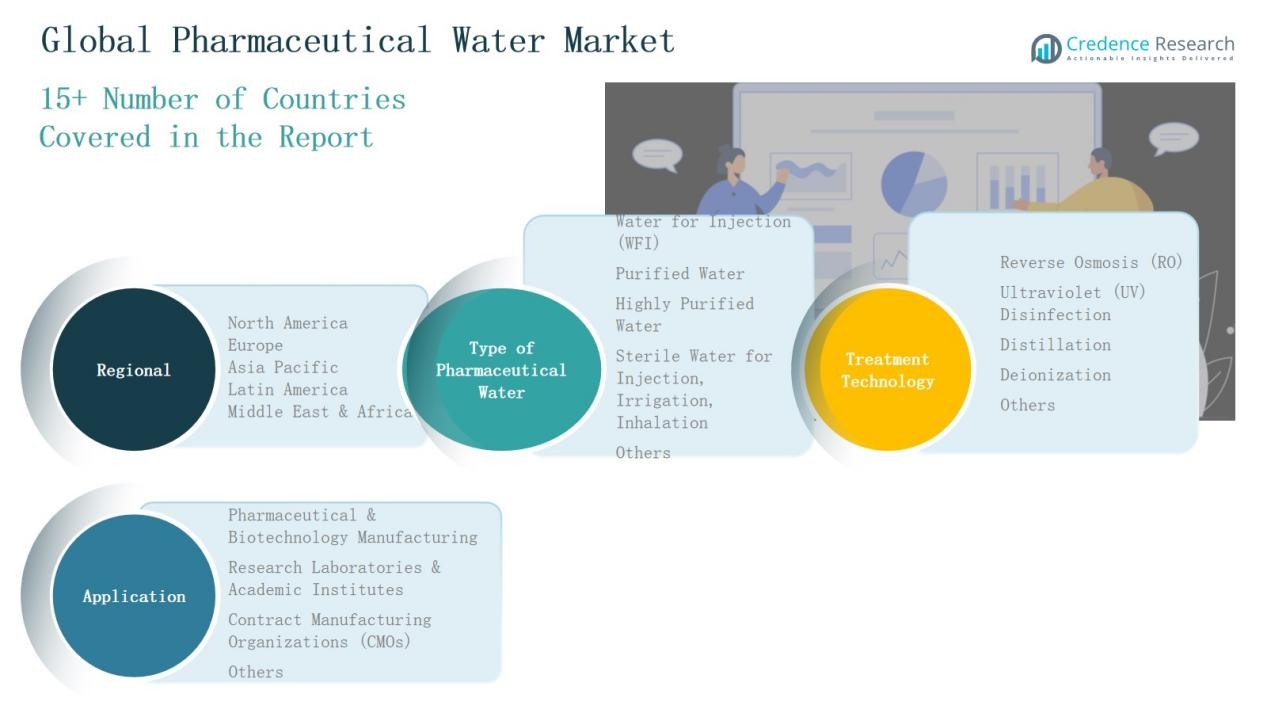
By Type of Pharmaceutical Water
- Water for Injection (WFI)
- Purified Water
- Highly Purified Water
- Sterile Water for Injection, Irrigation, Inhalation
- Others
By Treatment Technology
- Reverse Osmosis (RO)
- Ultraviolet (UV) Disinfection
- Distillation
- Deionization
- Others
By Application
- Pharmaceutical & Biotechnology Manufacturing
- Research Laboratories & Academic Institutes
- Contract Manufacturing Organizations (CMOs)
- Others
By Region
- North America:S., Canada, Mexico
- Europe:UK, France, Germany, Italy, Spain, Russia, Rest of Europe
- Asia Pacific:China, Japan, South Korea, India, Australia, Southeast Asia, Rest of Asia Pacific
- Latin America:Brazil, Argentina, Rest of Latin America
- Middle East:GCC Countries, Israel, Turkey, Rest of Middle East
- Africa:South Africa, Egypt, Rest of Africa
Competitive Landscape
The Pharmaceutical Water Market features a moderately consolidated competitive landscape dominated by global players such as Ecolab Inc., Veolia Environnement S.A., Thermo Fisher Scientific Inc., SUEZ Water Technologies & Solutions, Danaher Corporation, Evoqua Water Technologies LLC, Kurita Water Industries Ltd., Pall Corporation, ADC Water Management, and Dressler Group GmbH. These companies compete through product innovation, technological integration, and service reliability. They focus on advanced purification technologies, including multi-stage reverse osmosis, UV disinfection, and distillation systems, to meet GMP and pharmacopeia standards. Strategic mergers, acquisitions, and partnerships help them expand regional presence and strengthen compliance-based service portfolios. Increasing investments in digital monitoring, sustainability, and automation enhance operational efficiency and customer value. Additionally, local and regional manufacturers are emerging with cost-effective modular purification systems, intensifying competition. Continuous R&D and customized water solutions tailored for biopharmaceutical, vaccine, and sterile injectable production remain key differentiators driving competitiveness across the global market.
Shape Your Report to Specific Countries or Regions & Enjoy 30% Off!
Key Players
Recent Developments
- In April 2024, Asahi Kasei launched a new membrane-based system for producing Water for Injection (WFI), designed to replace traditional distillation units and improve energy efficiency.
- In February 2024, Veolia Water Technologies introduced its upgraded Polaris 2.0 distillation and steam systems to enhance pharmaceutical WFI generation and reduce operational costs.
- In May 2023, Xylem completed the acquisition of Evoqua Water Technologies in a $7.5 billion all-stock deal, expanding its global water treatment capabilities for pharmaceutical applications.
Report Coverage
The research report offers an in-depth analysis based on Type of Pharmaceutical Water, Treatment Technology, Application and Region. It details leading market players, providing an overview of their business, product offerings, investments, revenue streams, and key applications. Additionally, the report includes insights into the competitive environment, SWOT analysis, current market trends, as well as the primary drivers and constraints. Furthermore, it discusses various factors that have driven market expansion in recent years. The report also explores market dynamics, regulatory scenarios, and technological advancements that are shaping the industry. It assesses the impact of external factors and global economic changes on market growth. Lastly, it provides strategic recommendations for new entrants and established companies to navigate the complexities of the market.
Future Outlook
- Demand for high-purity water systems will increase with expanding biologics and vaccine production.
- Pharmaceutical manufacturers will adopt automated and digitally monitored purification systems for compliance.
- Water for Injection (WFI) systems will see higher adoption due to rising sterile drug production.
- Sustainability goals will drive investment in energy-efficient and water-reuse technologies.
- Asia Pacific will remain the fastest-growing region due to industrial expansion and local drug manufacturing.
- Modular and scalable water purification systems will gain popularity among mid-sized manufacturers.
- Partnerships between global purification companies and local pharmaceutical firms will strengthen regional capabilities.
- Continuous improvements in reverse osmosis and distillation technologies will enhance operational efficiency.
- Regulatory bodies will tighten quality standards, pushing upgrades in validation and documentation processes.
- Integration of IoT and AI-based systems will improve predictive maintenance and real-time water quality assurance.


