
Market Overview
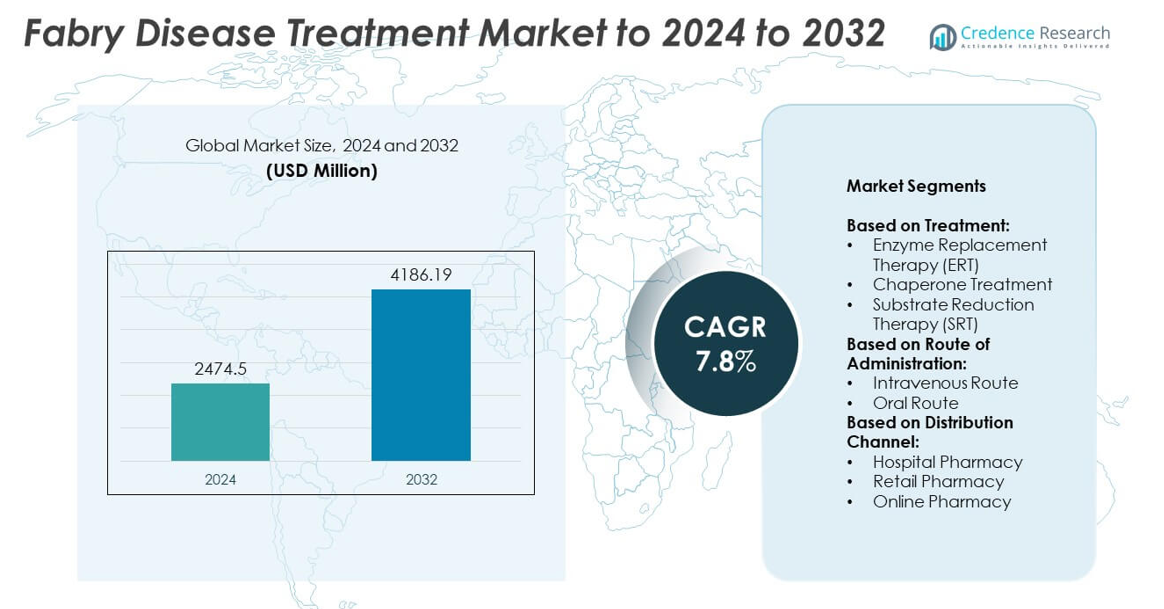
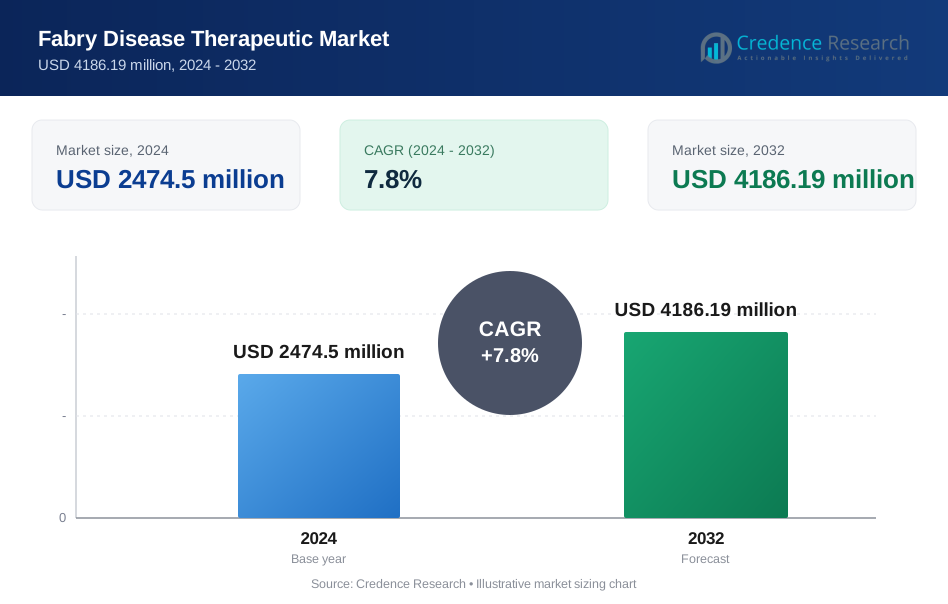
Fabry Disease Treatment Market size was valued at USD 2474.5 million in 2024 and is anticipated to reach USD 4186.19 million by 2032, at a CAGR of 7.8% during the forecast period.
| REPORT ATTRIBUTE | DETAILS |
|---|---|
| Historical Period | 2020-2023 |
| Base Year | 2024 |
| Forecast Period | 2025-2032 |
| Fabry Disease Treatment Market Size 2024 | USD 2474.5 million |
| Fabry Disease Treatment Market, CAGR | 7.8% |
| Fabry Disease Treatment Market Size 2032 | USD 4186.19 million |
The Fabry Disease Treatment market is highly competitive, with major players such as Amicus Therapeutics Inc., Sanofi S.A., Takeda Pharmaceutical Co Ltd., Chiesi Farmaceutici SpA, and Protalix Biotherapeutics Inc. driving advancements through enzyme replacement therapies, chaperone treatments, and emerging gene therapies. These companies are focusing on expanding patient access, improving treatment compliance, and advancing personalized approaches to enhance long-term outcomes. North America emerged as the leading region in 2024, holding over 40% of the global market share, supported by advanced healthcare infrastructure, favorable reimbursement frameworks, and a strong presence of clinical research programs that continue to strengthen its dominance.
Market Insights
- The Fabry Disease Treatment market was valued at USD 2474.5 million in 2024 and is projected to reach USD 4186.19 million by 2032, growing at a CAGR of 7.8%.
- Rising diagnosis through newborn screening programs and strong reimbursement policies are fueling market growth, alongside increased patient awareness and advocacy support.
- Enzyme Replacement Therapy (ERT) dominated in 2024 with over 65% market share, while oral chaperone therapies and gene therapy pipelines are emerging as key trends shaping future treatment adoption.
- The competitive landscape is marked by innovation-focused companies advancing clinical trials, expanding patient reach, and leveraging strategic collaborations to strengthen their market position.
- North America led with more than 40% share in 2024, followed by Europe at 30%, while Asia Pacific held 18% and is the fastest-growing region; hospital pharmacies accounted for the largest distribution share, highlighting their central role in treatment delivery.
Market Segmentation Analysis:
By Treatment
Enzyme Replacement Therapy (ERT) dominated the Fabry Disease Treatment market in 2024, accounting for over 65% of the total share. The segment’s leadership stems from its proven efficacy in addressing enzyme deficiency and reducing organ complications. Widely approved therapies like agalsidase beta and agalsidase alfa continue to drive adoption across developed healthcare markets. Chaperone treatment is gaining traction as a non-invasive alternative, while Substrate Reduction Therapy (SRT) is emerging in niche patient populations. However, ERT remains the preferred treatment due to long-term clinical validation and strong reimbursement support.
- For instance, Fabry registries have tracked data on more than 8,000 patients with Fabry disease over 20+ years.
By Route of Administration
The intravenous route led the market with a share of more than 70% in 2024. This dominance is driven by the established use of intravenous enzyme replacement therapy as the standard care method. Intravenous delivery ensures accurate dosing and bioavailability, critical for patients with advanced organ involvement. While oral route therapies, such as chaperone-based treatments, are expanding due to patient convenience, their adoption remains lower. The increasing pipeline of oral therapies is expected to boost future uptake, but intravenous administration continues to dominate due to clinical reliability and widespread medical adoption.
- For instance, Takeda’s Replagal label specifies 0.2 mg/kg IV every 2 weeks over 40 minutes, reflecting entrenched IV use.
By Distribution Channel
Hospital pharmacies held the largest share, surpassing 55% of the Fabry Disease Treatment market in 2024. Their dominance is linked to the complexity of therapy administration, particularly intravenous ERT, which requires trained healthcare professionals and monitoring. Hospital settings ensure safe handling of high-cost biologics and enable access to multidisciplinary care for Fabry patients. Retail and online pharmacies are gaining ground with the rise of oral therapies, improving convenience and accessibility. Nonetheless, hospital pharmacies remain the primary distribution channel due to treatment complexity, patient safety requirements, and stronger ties to specialty care programs.
Key Growth Drivers
Rising Diagnosis and Awareness Programs
Growing awareness and improved diagnostic methods are fueling the Fabry Disease Treatment market. Early genetic testing and newborn screening programs enable timely identification, expanding the patient pool eligible for therapy. Patient advocacy groups and public health campaigns are also educating families and caregivers about symptoms and treatment options. This heightened awareness not only increases treatment uptake but also encourages healthcare systems to allocate resources for rare disease management. Rising global focus on rare disease coverage makes this the primary growth driver for the market.
- For instance, CENTOGENE logged ~81,500 genetic test requests in 2023, including lysosomal panels used in Fabry workflows.
Expanding Therapeutic Pipeline
The robust therapeutic pipeline is a major growth driver for the Fabry Disease Treatment market. Biopharmaceutical companies are advancing clinical trials for novel chaperone therapies, substrate reduction therapies, and next-generation enzyme replacement products. These therapies aim to improve efficacy, reduce infusion burden, and enhance patient outcomes. Regulatory agencies are providing designations such as orphan drug status and fast-track approvals, accelerating product launches. The diversification of therapeutic options creates competitive momentum and attracts investment, ensuring broader adoption across varied patient groups worldwide.
- For instance, Protalix (with Chiesi) completed the 2-year, Phase III BALANCE trial for pegunigalsidase alfa in adult Fabry patients. The trial enrolled 78 patients, of whom 77 were treated, and 72 completed the study, supporting the regulatory submissions that ultimately led to the drug's approval as Elfabrio in 2023.
Increasing Reimbursement and Healthcare Support
Improved reimbursement frameworks and healthcare coverage for rare diseases are significantly boosting treatment accessibility. High therapy costs, particularly for ERT, are offset by government and private payer support in developed regions. Policies encouraging early intervention and chronic disease management have strengthened adoption rates. In emerging markets, expanding healthcare budgets and international collaborations are improving access to advanced therapies. Favorable reimbursement support, alongside global healthcare initiatives, ensures that patients can afford long-term therapies, making this a crucial growth driver for market expansion.
Key Trends & Opportunities
Shift Toward Oral Therapies
The transition from infusion-based to oral therapies represents a key trend in the Fabry Disease Treatment market. Chaperone-based oral treatments offer patients greater convenience, reduced treatment burden, and improved compliance compared to traditional intravenous infusions. Companies are actively investing in developing oral formulations that can address a larger share of the patient population. This trend provides opportunities to expand adoption rates, particularly among patients reluctant to undergo hospital-based infusions. The convenience-driven shift is reshaping patient expectations and strengthening the long-term growth outlook for the market.
- For instance, Amicus ended 2024 with ~2,730 patients on Galafold (migalastat), evidencing real-world oral adoption.
Growing Personalized Medicine Approach
Personalized medicine is emerging as a significant opportunity in Fabry disease treatment. Genetic profiling and biomarker-driven diagnostics allow tailored treatment strategies that improve outcomes and minimize side effects. Advanced tools are being integrated into clinical practices to identify patient-specific responses to therapies such as ERT or SRT. This targeted approach not only enhances treatment precision but also maximizes healthcare resources. The growing push for individualized treatment regimens provides opportunities for innovation and strengthens patient confidence, reinforcing the future growth potential of the Fabry Disease Treatment market.
- For instance, results from Sangamo's Phase 1/2 STAAR study showed that all 18 patients who began the trial on enzyme replacement therapy (ERT) were successfully withdrawn from ERT after receiving the investigational gene therapy ST-920. However, as of a September 2025 update, one patient had resumed ERT following a physician's decision.
Key Challenges
High Cost of Therapies
The extremely high cost of Fabry disease treatments is a major market challenge. Enzyme Replacement Therapy, often exceeding hundreds of thousands of dollars annually, remains inaccessible to many patients in low- and middle-income regions. Even in developed countries, cost pressures on healthcare systems pose sustainability concerns. While reimbursement policies help, economic disparities limit equal access to life-saving treatments. Pharmaceutical companies face increasing pressure to develop cost-effective alternatives or offer patient assistance programs to reduce affordability barriers, which remain a significant restraint for global adoption.
Limited Access in Emerging Markets
Access to Fabry disease treatment in emerging markets is constrained by limited healthcare infrastructure, low diagnostic rates, and high treatment costs. Lack of awareness among healthcare professionals delays timely diagnosis and intervention. Moreover, specialized infusion centers and genetic testing facilities are often unavailable, creating treatment gaps. Pharmaceutical companies face distribution and regulatory challenges in these regions, further restricting availability. These barriers hinder market expansion despite rising disease burden, making limited access one of the key challenges to achieving equitable global treatment coverage.
Regional Analysis
North America
North America accounted for the largest share of the Fabry Disease Treatment market in 2024, holding over 40% of the global market. The region’s dominance is driven by advanced healthcare infrastructure, strong reimbursement systems, and high diagnosis rates supported by newborn screening programs. The United States leads with extensive adoption of enzyme replacement therapy and ongoing clinical trials for next-generation therapies. Canada also contributes significantly with expanding access programs for rare diseases. The presence of key pharmaceutical companies and patient advocacy groups further strengthens regional growth, ensuring continued leadership during the forecast period.
Europe
Europe represented around 30% of the Fabry Disease Treatment market share in 2024, supported by strong regulatory frameworks and widespread availability of advanced therapies. Countries such as Germany, France, and the United Kingdom lead adoption, backed by structured reimbursement policies for rare disease treatments. The region benefits from active research initiatives and collaborations across universities and healthcare systems. Availability of both enzyme replacement therapy and chaperone-based oral treatments is expanding, improving patient access. Growing investments in rare disease programs and the presence of established healthcare networks ensure Europe maintains a strong position in the global market.
Asia Pacific
Asia Pacific held approximately 18% of the Fabry Disease Treatment market share in 2024, with Japan and China as key contributors. Rising awareness, improving healthcare spending, and expanding diagnostic capabilities are fueling growth in the region. Japan has been at the forefront with approved therapies and robust reimbursement systems, while China is advancing access through government healthcare reforms. Emerging economies such as India are gradually improving rare disease treatment infrastructure. Despite cost and access challenges, rapid advancements in healthcare systems and rising clinical trial activity position Asia Pacific as one of the fastest-growing regions for the market.
Latin America
Latin America accounted for nearly 7% of the Fabry Disease Treatment market share in 2024, driven mainly by Brazil and Mexico. The region faces challenges such as high therapy costs and limited specialized healthcare facilities, restricting widespread adoption. However, increasing government focus on rare diseases and growing partnerships with international pharmaceutical companies are improving patient access. Brazil leads adoption with pilot programs for rare disease management and hospital-based access to enzyme replacement therapy. Rising awareness and gradual expansion of genetic testing infrastructure are expected to strengthen growth opportunities for the market in Latin America over the forecast period.
Middle East and Africa
The Middle East and Africa region held a market share of about 5% in 2024, reflecting limited access and slower adoption compared to developed regions. Wealthier countries such as Saudi Arabia and the United Arab Emirates are driving growth with investments in rare disease treatment infrastructure and partnerships with global drug makers. However, much of Africa continues to face barriers due to lack of awareness, inadequate healthcare systems, and affordability issues. Expansion of genetic testing, international collaborations, and improving healthcare budgets may gradually improve treatment accessibility, though the region remains the smallest contributor to the global market.
Market Segmentations:
By Treatment:
- Enzyme Replacement Therapy (ERT)
- Chaperone Treatment
- Substrate Reduction Therapy (SRT)
By Route of Administration:
- Intravenous Route
- Oral Route
By Distribution Channel:
- Hospital Pharmacy
- Retail Pharmacy
- Online Pharmacy
By Geography
- North America
- U.S.
- Canada
- Mexico
- Europe
- Germany
- France
- U.K.
- Italy
- Spain
- Rest of Europe
- Asia Pacific
- China
- Japan
- India
- South Korea
- South-east Asia
- Rest of Asia Pacific
- Latin America
- Brazil
- Argentina
- Rest of Latin America
- Middle East & Africa
- GCC Countries
- South Africa
- Rest of the Middle East and Africa
Competitive Landscape
The Fabry Disease Treatment market is shaped by leading companies including Amicus Therapeutics Inc., Idorsia Pharmaceuticals Ltd., Shire PIc., Sangamo Therapeutics, Chiesi Farmaceutici SpA, Protalix Biotherapeutics Inc., Takeda Pharmaceutical Co Ltd., ISU Abxis Co Ltd., Sanofi S.A., Avrobio Inc., Freeline Therapeutics Holdings PLC, JCR Pharmaceuticals Co Ltd., MOP Therapeutics, and Yuhan Corp. These players are advancing innovative treatment approaches, ranging from enzyme replacement therapies to oral chaperone formulations and gene therapy solutions. Intense competition is driven by expanding clinical pipelines, regulatory designations, and strategic partnerships aimed at improving patient outcomes. Companies are focusing on developing therapies that reduce infusion frequency, improve compliance, and address unmet needs in treatment-resistant cases. Market participants are also enhancing global reach through collaborations with healthcare systems and rare disease networks, while investing in personalized medicine approaches supported by biomarker research. The competitive environment emphasizes innovation, access expansion, and differentiation to strengthen long-term positioning.
Key Player Analysis
- Amicus Therapeutics Inc.
- Idorsia Pharmaceuticals Ltd.
- Shire PIc.
- Sangamo Therapeutics
- Chiesi Farmaceutici SpA
- Protalix Biotherapeutics Inc.
- Takeda Pharmkceutical Co Ltd.
- ISU Abxis Co Ltd.
- Sanofi S.A.
- Avrobio Inc.
- Freeline Therapeutics Holdings PLC
- JCR Pharmaceuticals Co Ltd.
- MOP Therapeutics
- Yuhan Corp
Recent Developments
- In 2023, Chiesi Farmaceutici S.p.A. received both the US Food and Drug Administration (FDA) and the European Commission (EC) approval for Elfabrio to treat adult patients with Fabry disease.
- In 2023, Freeline announced it was pausing the clinical development of its Fabry disease gene therapy, FLT190, to focus on its Gaucher disease candidate. The company also terminated the Phase 1/2 MARVEL-1 trial for this indication.
- In 2023, Sangamo Therapeutics: The FDA granted Fast Track Designation to ST-920, designed to provide a functional copy of the GLA gene to liver cells
Report Coverage
The research report offers an in-depth analysis based on Treatment, Route of Administration, Distribution Channel and Geography. It details leading market players, providing an overview of their business, product offerings, investments, revenue streams, and key applications. Additionally, the report includes insights into the competitive environment, SWOT analysis, current market trends, as well as the primary drivers and constraints. Furthermore, it discusses various factors that have driven market expansion in recent years. The report also explores market dynamics, regulatory scenarios, and technological advancements that are shaping the industry. It assesses the impact of external factors and global economic changes on market growth. Lastly, it provides strategic recommendations for new entrants and established companies to navigate the complexities of the market.
Future Outlook
- The Fabry Disease Treatment market will expand steadily with a strong growth rate.
- Enzyme replacement therapy will remain the dominant treatment option during the forecast period.
- Oral chaperone therapies will gain traction due to convenience and better compliance.
- Substrate reduction therapies will find increasing adoption in targeted patient groups.
- Hospital pharmacies will continue to lead as the primary distribution channel.
- North America will sustain its leadership position with the largest market share.
- Europe will strengthen its role through robust reimbursement and regulatory support.
- Asia Pacific will emerge as the fastest-growing region due to rising awareness.
- High therapy costs will remain a key challenge for wider adoption.
- Expanding clinical pipelines and personalized medicine approaches will create new opportunities.
Request a Free Sample
Fill in your details and we'll send you a free sample report.
- Sample data tables & charts
- Research methodology
Need a Custom Version of This Report?
Tailor the scope, geography, or segments to your exact requirements.
- Custom geography or segment scope
- Direct access to our analyst team
Frequently Asked Questions
What is the current market size for Fabry Disease Treatment Market, and what is its projected size in 2032?
At what Compound Annual Growth Rate is the Fabry Disease Treatment Market projected to grow between 2025 and 2032?
Which Fabry Disease Treatment Market segment held the largest share in 2024?
What are the primary factors fueling the growth of the Fabry Disease Treatment Market?
Who are the leading companies in the Fabry Disease Treatment Market?
Table of Content
Chapter 1. Report Introduction
- 1.1 Report Description & Purpose
- 1.1.1 Report Title & Market Definition
- 1.1.2 Unique Selling Propositions (USP) & Key Differentiators
- 1.1.3 Value Proposition for Stakeholders
- 1.2 Research Objectives
- 1.2.1 Market Sizing Objectives (Volume & Revenue)
- 1.2.2 Segmentation Objectives
- 1.2.3 Competitive Intelligence Objectives
- 1.2.4 Forecast & Scenario Objectives
- 1.3 Report Scope
- 1.3.1 Fabry Disease Therapeutic Scope – Types & Subtypes Covered
- 1.3.2 Geographic Scope – Regions & Countries Covered
- 1.3.3 Historical Period, Base Year & Forecast Period (2024; forecast to 2032)
- 1.3.4 Inclusions & Exclusions
- 1.4 HS Code & Classification Framework
- 1.5 Currency, Units & Pricing Basis
- 1.6 Target Stakeholders
- 1.7 Limitations & Assumptions
Chapter 2. Executive Summary
- 2.1 Global Fabry Disease Therapeutic Market Snapshot
- 2.1.1 Market Size – Historical (2024) & Forecast (2024-2032) (2024: USD 2474.5 million → 2032: USD 4186.19 million)
- 2.1.2 Volume & Revenue – Global Totals
- 2.1.3 Key Market Highlights – Top Five Facts
- 2.2 Fabry Disease Therapeutic Market Segmentation Snapshot
- 2.2.1 Market Split by Region – 2024 vs. 2032
- 2.3 Competitive Snapshot
- 2.3.1 Top 10 Players by Revenue Share – 2024
- 2.3.2 Top 10 Players by Volume Share – 2024
- 2.3.3 Recent Strategic Developments (18-Month Summary)
- 2.4 Key Investment Highlights & Strategic Conclusions
Chapter 3. Fabry Disease Therapeutic Market Dynamics & Industry Analysis
- 3.1 Market Overview & Context
- 3.1.1 Fabry Disease Therapeutic Market Position in the Broader Automotive Value Chain
- 3.1.2 OEM vs. Replacement Market Dynamics
- 3.1.3 Market Maturity & Development Stage by Region
- 3.2 Fabry Disease Therapeutic Market Drivers
- 3.3 Fabry Disease Therapeutic Market Restraints & Challenges
- 3.4 Fabry Disease Therapeutic Market Opportunities
- 3.5 Porter's Five Forces Analysis
- 3.5.1 Threat of New Entrants
- 3.5.2 Bargaining Power of Suppliers
- 3.5.3 Bargaining Power of Buyers
- 3.5.4 Threat of Substitutes
- 3.5.5 Competitive Rivalry – Intensity Assessment
- 3.6 Fabry Disease Therapeutic Value Chain Analysis
- 3.6.1 Upstream – Raw Material/Input Suppliers
- 3.6.1.1 Raw Material/Input 1
- 3.6.1.2 Raw Material/Input 2
- 3.6.1.3 Raw Material/Input 3
- 3.6.2 Midstream – Production/Manufacturing/Service Delivery
- 3.6.2.1 Production/Process Overview
- 3.6.2.2 Key Facility Locations & Capacity by Manufacturer
- 3.6.3 Downstream – Distribution & End Consumer
- 3.6.3.1 Primary Channel – B2B/OEM
- 3.6.3.2 Secondary Channels – Dealer, Retail, Online, Direct
- 3.6.4 Value Chain Profitability Analysis
- 3.6.1 Upstream – Raw Material/Input Suppliers
- 3.7 PESTEL Analysis
- 3.7.1 Political Factors
- 3.7.2 Economic Factors
- 3.7.3 Social Factors
- 3.7.4 Technological Factors
- 3.7.5 Environmental Factors
- 3.7.6 Legal Factors
- 3.8 Fabry Disease Therapeutic Supply Chain Analysis
- 3.8.1 Raw Material/Input Supply Risk Assessment
- 3.8.2 Manufacturing Concentration Risk (Geographic Exposure)
- 3.8.3 Trade Disruption Impact Analysis
- 3.9 Regulatory & Policy Landscape
Note: The regulatory and policy landscape section covers regulations based on their applicability to the market, Fabry Disease Therapeutic category, geography, and scope of the study. Only regulatory frameworks with a material impact on operations, compliance, trade, sustainability, or market access are analyzed in detail.
Chapter 4. Key Investment Pockets & Opportunity Analysis
- 4.1 Fabry Disease Therapeutic Market Attractiveness Analysis
- 4.1.1 By Region – Investment Attractiveness Matrix (Volume × CAGR)
- 4.2 Absolute Revenue Growth Opportunity
- 4.2.1 By Region – Absolute USD Growth Through 2032
- 4.3 Incremental Volume Opportunity
- 4.3.1 By Region – Incremental Volume Through 2032
- 4.3.2 Segment – Incremental Volume
- 4.4 Emerging Submarket Opportunity Deep Dive (Subject to Applicability)
- 4.5 Emerging Market Opportunity Scorecards
- 4.5.1 United States
- 4.5.2 Europe
- 4.5.3 Asia
- 4.5.4 Middle East & Africa
Note: Emerging Market Opportunity Scorecards will be included based on relevance and strategic importance. Regions listed are indicative and may vary depending on data availability and market dynamics.
Chapter 5. Fabry Disease Therapeutic Import-Export Analysis & Trade Flows
- 5.1 Global Trade Overview
- 5.1.1 Global Export Value by Country (2024)
- 5.1.2 Global Export Volume by Country (2024)
- 5.1.3 Global Import Value by Country (2024)
- 5.1.4 Global Import Volume by Country (2024)
- 5.1.5 Net Trade Balance by Country (2024)
- 5.2 Export Analysis – Segment
- 5.2.1 Type 1 (HS Code)
- 5.2.2 Type 2 (HS Code)
- 5.2.3 Type 3 (HS Code)
- 5.2.4 Type 4 (HS Code)
- 5.2.5 Type 5 (HS Code)
- 5.3 Import Analysis – Segment
- 5.3.1 Type 1 (HS Code)
- 5.3.2 Type 2 (HS Code)
- 5.3.3 Type 3 (HS Code)
- 5.3.4 Type 4 (HS Code)
- 5.3.5 Type 5 (HS Code)
- 5.4 Average Unit Trade Prices
- 5.4.1 Average Export Price – Segment & Country
- 5.4.2 Average Import Price – Segment & Source Country
- 5.4.3 Price Trends (2024)
- 5.5 Key Trade Route Analysis
- 5.5.1 Trade Route 1
- 5.5.2 Trade Route 2
- 5.5.3 Trade Route 3
- 5.5.4 Trade Route 4
- 5.5.5 Trade Route 5
- 5.6 Trade Policy Impact Assessment
- 5.6.1 US Anti-Dumping & Section 301 Tariffs
- 5.6.2 EU Customs Union Impact
- 5.6.3 Major Free Trade Agreements
- 5.6.4 USMCA Rules of Origin
Note: Trade policy analysis will be included only where relevant to the Fabry Disease Therapeutic market.
Chapter 6. Competitive Landscape & Company Benchmarking
- 6.1 Fabry Disease Therapeutic Market Concentration & Structure
- 6.1.1 Herfindahl-Hirschman Index (HHI) – vs. 2024
- 6.1.2 Tier 1, Tier 2 & Tier 3 Market Structure
- 6.1.3 Global, Regional & Local Player Dynamics
- 6.2 Fabry Disease Therapeutic Market Share Analysis – 2024
- 6.2.1 Global Revenue Share by Company
- 6.2.2 Global Volume Share by Company
- 6.2.3 Regional Revenue Share
- 6.2.4 Market Share Evolution ( vs. 2024)
- 6.2.5 OEM Segment Share by Company
- 6.2.6 Replacement Segment Share by Company
- 6.3 Production/Delivery Capacity & Facility Analysis
- 6.3.1 Global Installed Capacity
- 6.3.2 Capacity Utilization Rates
- 6.3.3 Production/Output Volume
- 6.3.4 Facility Locations & Capacity Map
- 6.3.5 Planned Capacity Additions
- 6.4 Fabry Disease Therapeutic Competitive Benchmarking Matrix
- 6.4.1 Revenue, Volume, CAGR & Profitability Comparison
- 6.4.2 Channel Revenue Mix
- 6.4.3 Geographic Revenue Exposure
- 6.4.4 R&D Intensity
- 6.4.5 Sustainability Maturity
- 6.5 Strategic Developments in Fabry Disease Therapeutic (Last 24 Months)
- 6.5.1 Mergers, Acquisitions & Divestments
- 6.5.2 New Fabry Disease Therapeutic Launches
- 6.5.3 Facility Expansions
- 6.5.4 Strategic Alliances, Joint Ventures & Partnerships
- 6.5.5 Distribution Expansion & Market Entry
- 6.5.6 Sustainability & ESG Initiatives
- 6.6 Competitive Strategy Mapping
- 6.6.1 Leader, Challenger, Follower & Niche Classification
- 6.6.2 Pricing Strategy Comparison
- 6.6.3 Channel Strategy Matrix
Note: Strategic developments are included based on their materiality and the availability of reliable information.
Chapter 7. Global Fabry Disease Therapeutic Market – By Distribution Channel
- 7.1 Segment Overview
- 7.1.1 Volume & Revenue Split by Channel (2024 & 2032)
- 7.1.2 Channel Mix Evolution (2024-2032)
Chapter 8. Regional Market Analysis – Global Overview
- 8.1 Global Regional Overview
- 8.1.1 Regional Volume Share
- 8.1.2 Regional Revenue Share
- 8.1.3 Regional Volume by Region
- 8.1.4 Regional Revenue by Region
- 8.1.5 Regional Forecast Through 2032
- 8.2 Cross-Regional Segment Analysis
- 8.2.1 By Distribution Channel
- 8.2.2 By Brand/Price Tier
Chapter 9. North America Fabry Disease Therapeutic Market
- 9.1 United States
- 9.2 Canada
- 9.3 Mexico
Chapter 10. Europe Fabry Disease Therapeutic Market
- 10.1 Germany
- 10.2 France
- 10.3 Italy
- 10.4 United Kingdom
- 10.5 Spain
- 10.6 Poland
- 10.7 Russia
- 10.8 Netherlands
- 10.9 Belgium
- 10.10 Sweden
- 10.11 Denmark
- 10.12 Norway
- 10.13 Rest of Europe
Chapter 11. Asia Pacific Fabry Disease Therapeutic Market
- 11.1 China
- 11.2 India
- 11.3 Japan
- 11.4 South Korea
- 11.5 Thailand
- 11.6 Indonesia
- 11.7 Vietnam
- 11.8 Malaysia
- 11.9 Australia
- 11.10 Rest of Asia Pacific
Chapter 12. Latin America Fabry Disease Therapeutic Market
- 12.1 Brazil
- 12.2 Argentina
- 12.3 Colombia
- 12.4 Chile
- 12.5 Rest of Latin America
Chapter 13. Middle East Fabry Disease Therapeutic Market
- 13.1 Saudi Arabia
- 13.2 United Arab Emirates
- 13.3 Turkey
- 13.4 Israel
- 13.5 Iran
- 13.6 Rest of the Middle East
Chapter 14. Africa Fabry Disease Therapeutic Market
- 14.1 South Africa
- 14.2 Egypt
- 14.3 Nigeria
- 14.4 Morocco
- 14.5 Rest of Africa
Chapter 15. Fabry Disease Therapeutic Company Profiles
- 15.1 [Company 01]
- 15.1.1 Company Overview
- 15.1.2 Key Management Personnel
- 15.1.3 Products & Services Portfolio
- 15.1.4 Financial Performance
- 15.1.5 Key Market Focus & Geographic Presence
- 15.1.6 Recent Developments & Strategic Initiatives
Note: The company profile list is preliminary and may change based on research findings, market developments, data availability, and client requirements.
Chapter 16. Appendices
- Appendix A – List of Abbreviations & Acronyms
- Appendix B – Industry Classification Code Reference – Full Series
- Appendix C – Production & Capacity Data Tables
- Appendix D – End-Use & Demand Base Tables
- Appendix E – Consumption & Replacement Rate Assumptions
- Appendix F – ASP Reference Tables
- Appendix G – Manufacturing & Facility Database
- Appendix H – Import-Export Data Tables
- Appendix I – Regulatory Summary Tables
- Appendix J – Primary Research Participant List (Anonymized)
- Appendix K – Primary Research Questionnaire Framework
- Appendix L – Data Sources & Bibliography
- Appendix M – Market Size Divergence & Source Comparison
Chapter 17. Research Methodology
- 17.1 Research Framework & Philosophy
- 17.2 Secondary Research – Sources, Hierarchy & Data Extraction
- 17.3 Data Modeling – Bottom-Up & Top-Down Market Sizing
- 17.4 Primary Research – Stakeholder Framework, LOI & Sample Sizes
- 17.5 Forecast Methodology – Regression, Scenario & Sensitivity Analysis
- 17.6 Quality Control – Four-Layer Validation Framework
- 17.7 Limitations & Standard Assumptions
- 17.8 Disclaimer
