Market Overview
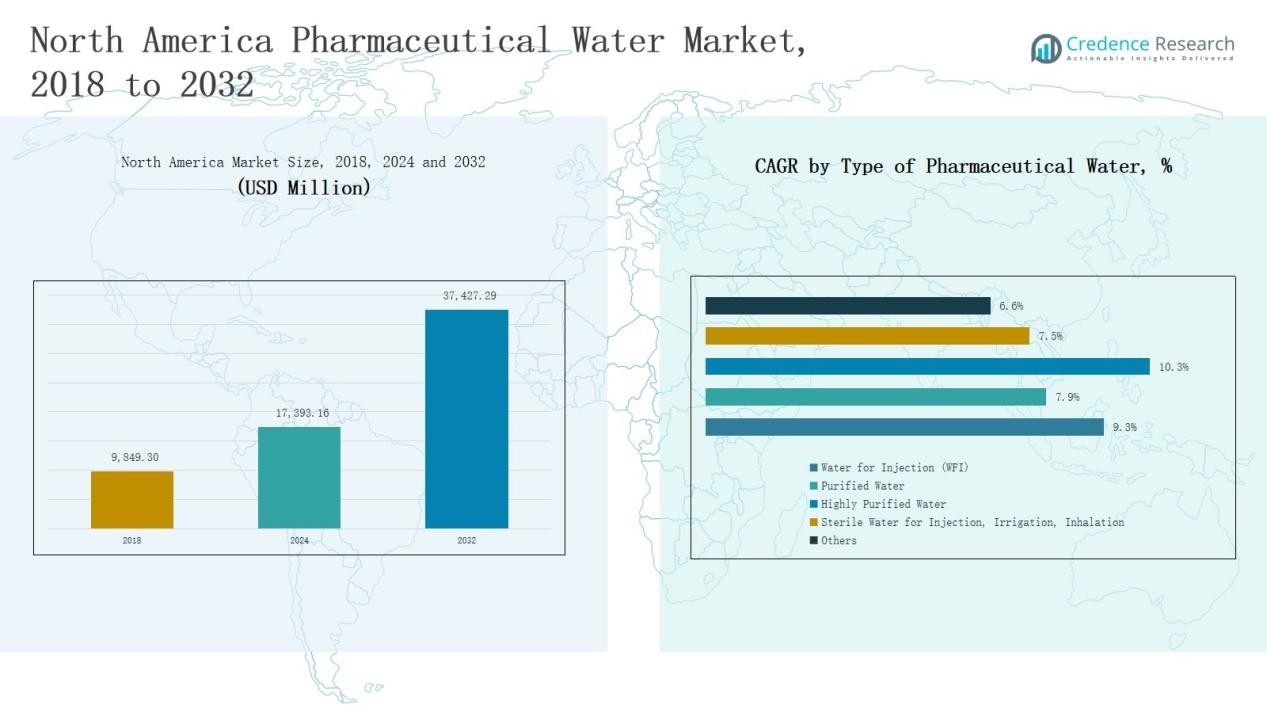
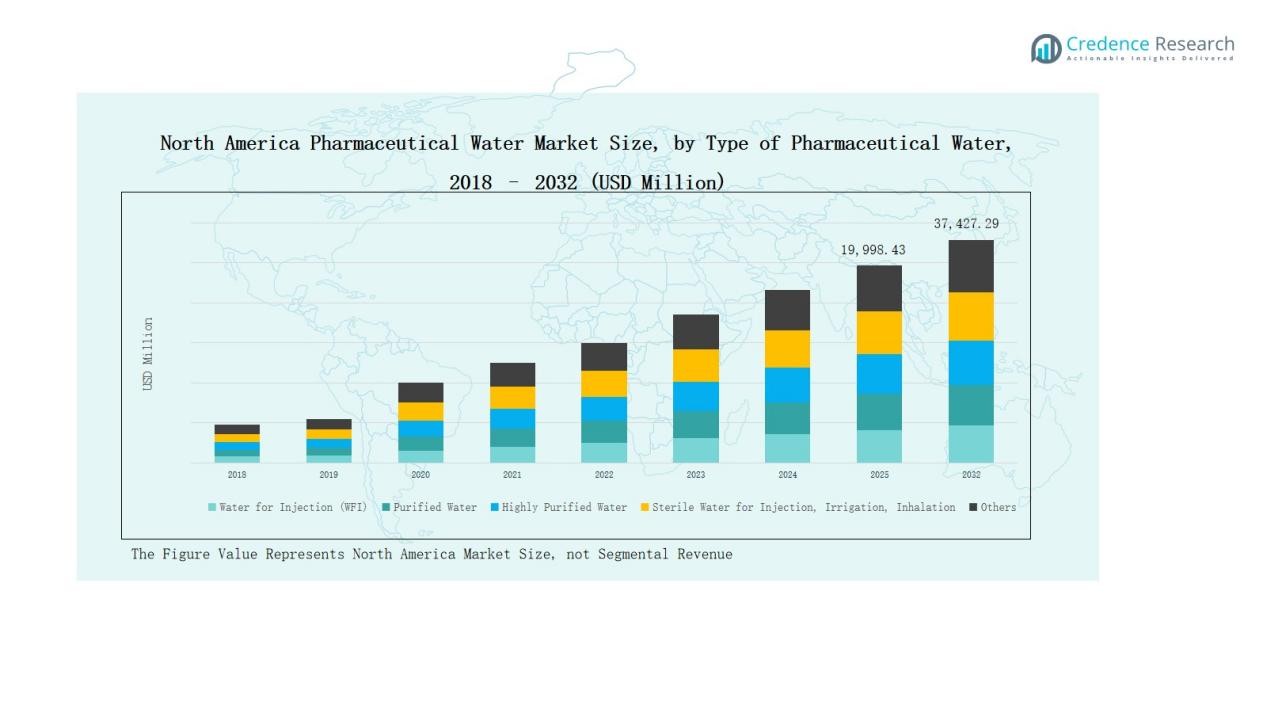
The North America Pharmaceutical Water Market was valued at USD 9,849.30 million in 2018, grew to USD 17,393.16 million in 2024, and is projected to reach USD 37,427.29 million by 2032, expanding at a CAGR of 9.4% during the forecast period.
| REPORT ATTRIBUTE |
DETAILS |
| Historical Period |
2020-2023 |
| Base Year |
2024 |
| Forecast Period |
2025-2032 |
| North America Pharmaceutical Water Market Size 2024 |
USD 17,393.16 Million |
| North America Pharmaceutical Water Market, CAGR |
9.4% |
| North America Pharmaceutical Water Market Size 2032 |
USD 37,427.29 Million |
The North America Pharmaceutical Water Market is led by major companies such as Thermo Fisher Scientific Inc., Danaher Corporation, Ecolab Inc., Veolia Water Technologies & Solutions, and B. Braun Medical Inc. These players maintain strong positions through advanced purification technologies, GMP-compliant systems, and integrated automation solutions that ensure regulatory compliance and operational reliability. Supporting firms like ICU Medical Inc., Veltek Associates Inc., and SteriCare Solutions focus on specialized sterile water systems for pharmaceutical applications. The United States emerged as the leading region in 2024, capturing a 71% market share, driven by robust pharmaceutical manufacturing capacity, strict FDA standards, and continuous investments in biopharmaceutical production infrastructure.
Access crucial information at unmatched prices!
Request your sample report today & start making informed decisions powered by Credence Research Inc.!
Download Sample
Market Insights
- The North America Pharmaceutical Water Market was valued at USD 9,849.30 million in 2018, grew to USD 17,393.16 million in 2024, and is projected to reach USD 37,427.29 million by 2032, expanding at a CAGR of 9.4%.
- Water for Injection (WFI) led by type with a 39% share in 2024, driven by its critical role in sterile drug and biopharmaceutical production requiring high purity levels.
- Reverse Osmosis (RO) dominated treatment technologies with a 41% share, supported by its strong efficiency in removing contaminants and ensuring GMP compliance in large-scale purification systems.
- Pharmaceutical & Biotechnology Manufacturing held the largest application share of 52% in 2024, fueled by rising demand for ultra-pure water in vaccine, biologics, and injectable drug production.
- The United States led regionally with a 71% share in 2024, supported by advanced pharmaceutical infrastructure, strict FDA standards, and continued investment in biopharmaceutical manufacturing facilities.
Market Segment Insights
By Type of Pharmaceutical Water:
Water for Injection (WFI) dominated the North America Pharmaceutical Water Market in 2024 with a 39% share. Its leadership is driven by extensive use in parenteral drug production, sterile formulations, and biopharmaceutical processes that demand high purity. Growing FDA compliance requirements and advanced water purification standards across manufacturing sites further support WFI’s dominance. Increasing adoption of automated WFI generation systems also enhances production efficiency and ensures consistent quality across pharmaceutical and biotechnology facilities.
By Treatment Technology:
Reverse Osmosis (RO) held the largest share of 41% in the North America Pharmaceutical Water Market in 2024. The segment’s growth is supported by its efficiency in removing ions, bacteria, and organic contaminants from feedwater. RO technology remains the preferred choice for producing purified and highly purified water, ensuring GMP compliance and cost efficiency. Continuous advancements in membrane filtration and system automation have strengthened its use in large-scale pharmaceutical and biotech water systems.
- For instance, Veolia’s Orion RO + CEDI skid systems, designed for pharmaceutical plants, support hot-water sanitization and are sold globally for purified water loops.
By Application:
Pharmaceutical & Biotechnology Manufacturing led the market with a 52% share in 2024, reflecting strong demand for ultra-pure water in formulation, cleaning, and sterile product preparation. The rise of biologics, injectables, and vaccine production across North America has expanded the need for reliable water systems. Strict regulatory oversight by the FDA and Health Canada further drives investment in high-purity water generation technologies, ensuring compliance with USP and EU pharmacopeia standards across production environments.
- For instance, Applied Membranes designs pharmaceutical water systems that meet USP XXIII and WFI standards, serving firms like Amgen and Baxter for biologics and injectables.
Key Growth Drivers
Expansion of Biopharmaceutical Manufacturing
The rapid growth of biologics, vaccines, and injectable drugs continues to drive demand for high-purity water systems across North America. Pharmaceutical and biotech firms increasingly require Water for Injection (WFI) and Highly Purified Water for sterile manufacturing and formulation. Investments in large-scale production facilities, supported by strong FDA and Health Canada regulations, have led to the installation of advanced purification systems. This expansion supports consistent product quality and enhances water treatment infrastructure across major manufacturing hubs.
- For instance, Aquamech custom-designed high-purity water systems are widely implemented in pharmaceutical manufacturing to meet USP and EP pharmacopeia standards, guaranteeing consistent product quality and regulatory compliance.
Stringent Regulatory Compliance and Quality Standards
Strict GMP and pharmacopeia standards from agencies such as the U.S. FDA and USP compel pharmaceutical companies to maintain high water purity levels. Manufacturers invest heavily in validated purification technologies, monitoring systems, and documentation to ensure full regulatory compliance. These standards drive continuous upgrades to purification and distribution systems, fueling steady market growth. Regulatory enforcement across sterile product manufacturing encourages long-term investment in validated, contamination-free, and digitally monitored water systems.
- For instance, Pfizer implemented an automated TOC (Total Organic Carbon) monitoring network across its sterile manufacturing facilities in Michigan, directly aligning with USP <643> requirements.
Technological Advancements in Water Treatment Systems
Continuous innovations in purification methods such as reverse osmosis, UV disinfection, and ultrafiltration have enhanced efficiency, energy savings, and system reliability. The integration of digital control systems, automation, and real-time monitoring has improved operational consistency. Pharmaceutical companies now prefer modular, scalable, and GMP-compliant systems that reduce downtime and ensure product quality. These advancements have significantly boosted system lifespan and compliance, supporting the modernization of pharmaceutical manufacturing across North America.
Key Trends & Opportunities
Adoption of Sustainable and Energy-Efficient Systems
Manufacturers are increasingly prioritizing energy-efficient water purification technologies to meet sustainability goals. Advanced systems now integrate energy recovery units, low-waste RO membranes, and smart monitoring to reduce operational costs. The shift toward greener production methods aligns with global sustainability mandates, presenting a major growth opportunity. Companies adopting eco-friendly water systems gain both regulatory and economic advantages, improving competitiveness while lowering their environmental footprint in pharmaceutical manufacturing.
- For instance, MECO engineered a water cooling system that reuses RO concentrate as makeup water for cooling towers in a cGMP pharmaceutical facility, reducing annual freshwater consumption by 4–5 million gallons.
Rising Demand for Modular and Custom-Built Solutions
Pharmaceutical facilities are shifting to modular and customized water treatment systems that can adapt to changing production needs. These flexible setups reduce installation time, optimize space, and simplify future capacity expansion. With rising demand from contract manufacturers and research institutions, vendors are focusing on plug-and-play systems designed for rapid deployment. This trend enhances scalability, ensuring long-term adoption across emerging biopharma clusters and smaller specialty drug producers.
- For instance, Biocell Water offers bespoke on-site wastewater treatment units in containerized, modular formats that can be relocated or expanded easily, helping pharmaceutical companies optimize operational costs and meet discharge compliance.
Key Challenges
High Installation and Maintenance Costs
Pharmaceutical water systems require significant capital investment in purification, validation, and maintenance processes. Continuous monitoring, replacement of filters and membranes, and periodic regulatory audits add to operational expenses. These high costs often limit adoption among smaller manufacturers and contract labs. The long payback period and need for technical expertise challenge cost optimization, making affordability a persistent barrier despite increasing market demand.
Complex Regulatory Compliance and Validation Procedures
Meeting stringent pharmacopeia standards such as USP, EP, and JP involves complex validation and documentation processes. Deviations or non-compliance can lead to production delays, costly remediation, or product recalls. Maintaining continuous monitoring and traceability across all stages of purification adds further complexity. Companies must allocate skilled personnel and advanced software tools to ensure audit readiness, which can slow system implementation and operational flexibility.
Risk of Microbial Contamination and System Downtime
Pharmaceutical water systems face continuous risk of microbial growth and biofilm formation, especially in storage and distribution loops. Even minor contamination can compromise product safety and regulatory compliance. Regular sanitization, loop maintenance, and temperature control are essential but time-intensive. Unexpected downtime during cleaning cycles disrupts production schedules and increases costs, creating a major operational challenge for facilities dependent on uninterrupted high-purity water supply.
Regional Analysis
United States
The United States held the dominant share of 71% in the North America Pharmaceutical Water Market in 2024. It leads due to its extensive pharmaceutical and biotechnology manufacturing infrastructure supported by strict FDA regulations. The market benefits from high investments in sterile injectables, biologics, and vaccine production that demand consistent high-purity water. Advanced purification technologies such as reverse osmosis and distillation are widely adopted across large manufacturing plants. Continuous modernization of GMP-compliant facilities and strong R&D activity drive steady market expansion. It remains the hub for global pharmaceutical exports, sustaining high water system installations.
Canada
Canada accounted for 18% of the regional market share in 2024, supported by its expanding pharmaceutical and life sciences sectors. The country shows growing adoption of Water for Injection (WFI) and Purified Water systems across biomanufacturing and research facilities. Strong Health Canada regulations and investments in drug development infrastructure promote consistent market growth. The government’s emphasis on domestic vaccine production and biologics research has strengthened purification system deployment. It benefits from advanced water treatment integration in research and clinical manufacturing environments. Collaboration with global technology suppliers continues to enhance the availability of GMP-grade systems.
Mexico
Mexico captured 11% of the regional share in 2024, driven by increasing pharmaceutical exports and growing domestic drug manufacturing. The market is expanding with new production facilities established under favorable government incentives and nearshoring initiatives. Rising demand for purified and sterile water in generics and contract manufacturing drives infrastructure development. Local facilities are upgrading to meet WHO and FDA compliance standards, encouraging wider adoption of automated water systems. It benefits from technology transfer partnerships and multinational investments that support purification and quality control processes. Steady industrial expansion strengthens its position in regional pharmaceutical production networks.
Market Segmentations:
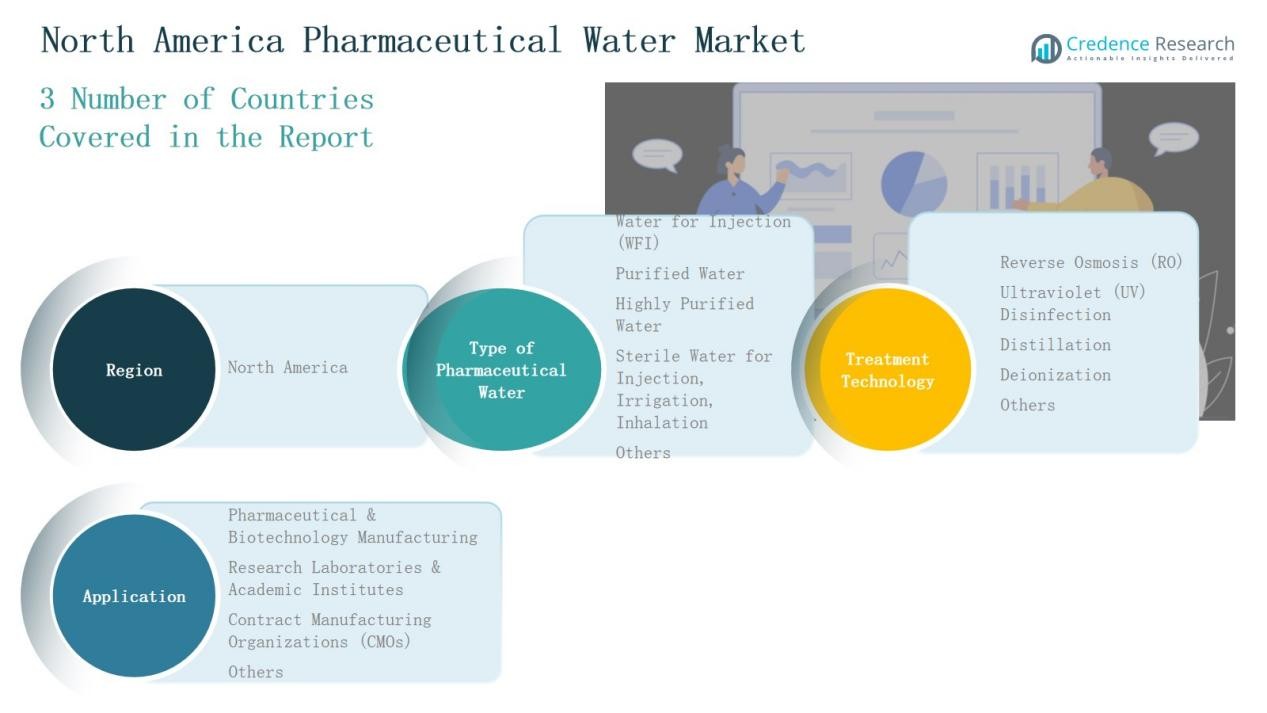
By Type of Pharmaceutical Water:
- Water for Injection (WFI)
- Purified Water
- Highly Purified Water
- Sterile Water for Injection, Irrigation, Inhalation
- Others
By Treatment Technology:
- Reverse Osmosis (RO)
- Ultraviolet (UV) Disinfection
- Distillation
- Deionization
- Others
By Application:
- Pharmaceutical & Biotechnology Manufacturing
- Research Laboratories & Academic Institutes
- Contract Manufacturing Organizations (CMOs)
- Others
By Region:
- United States
- Canada
- Mexico
Competitive Landscape
The North America Pharmaceutical Water Market features strong competition among global and regional players offering advanced water purification and distribution systems. Key participants include Thermo Fisher Scientific Inc., Danaher Corporation, Ecolab Inc., Veolia Water Technologies & Solutions, and B. Braun Medical Inc. These companies maintain leadership through extensive portfolios of GMP-compliant systems, validated purification technologies, and comprehensive after-sales support. Continuous innovation in automation, monitoring, and sustainability solutions enhances their market presence. Strategic collaborations with pharmaceutical and biotechnology firms strengthen their regional reach and compliance capabilities. Mid-tier players such as ICU Medical Inc., Veltek Associates Inc., and SteriCare Solutions focus on specialized systems for sterile manufacturing environments. Market competition centers on technological reliability, energy efficiency, and regulatory validation, driving consistent upgrades across production facilities. It remains a moderately consolidated market where established brands dominate through long-term service contracts and digitalized purification platforms.
Shape Your Report to Specific Countries or Regions & Enjoy 30% Off!
Key Players
- Thermo Fisher Scientific Inc.
- Danaher Corporation
- Ecolab Inc.
- Veolia Water Technologies & Solutions
- Braun Medical Inc.
- ICU Medical Inc.
- SteriCare Solutions
- Veltek Associates Inc.
- Sigma-Aldrich (Merck KGaA)
- Corning Incorporated
- Evoqua Water Technologies LLC
- Kurita Water Industries Ltd.
- Pall Corporation (Danaher)
- SUEZ Water Technologies & Solutions
- ADC Water Management
Recent Developments
- In August 2025, Ecolab announced the acquisition of Ovivo’s Electronics Ultra-Pure Water business, expanding its high-purity water treatment portfolio across North America.
- In August 2025, Grundfos completed the acquisition of Newterra, a U.S.-based water treatment company, strengthening its advanced purification and pharmaceutical water system capabilities.
- In September 2025, Kemira entered an agreement to acquire Water Engineering, Inc. in the United Statsses for approximately USD 150 million, enhancing its presence in industrial and pharmaceutical water treatment services.
- In May 2025, Veolia gained full control of its Water Technologies & Solutions division after acquiring CDPQ’s 30 percent stake, reinforcing its position in North America’s high-purity and process water markets.
Report Coverage
The research report offers an in-depth analysis based on Type of Pharmaceutical Water, Treatment Technology, Application and Region. It details leading market players, providing an overview of their business, product offerings, investments, revenue streams, and key applications. Additionally, the report includes insights into the competitive environment, SWOT analysis, current market trends, as well as the primary drivers and constraints. Furthermore, it discusses various factors that have driven market expansion in recent years. The report also explores market dynamics, regulatory scenarios, and technological advancements that are shaping the industry. It assesses the impact of external factors and global economic changes on market growth. Lastly, it provides strategic recommendations for new entrants and established companies to navigate the complexities of the market.
Future Outlook
- Demand for high-purity water systems will rise with expanding biologics and vaccine manufacturing.
- Adoption of digital monitoring and automation in water treatment plants will strengthen operational reliability.
- Modular and compact purification systems will gain preference for flexible pharmaceutical setups.
- Stringent GMP and FDA standards will continue to drive upgrades in purification infrastructure.
- Sustainability goals will encourage energy-efficient and low-waste water purification technologies.
- Increasing R&D investments will boost demand from research laboratories and academic institutions.
- Localized manufacturing in Canada and Mexico will expand market reach across the region.
- Integration of IoT-based quality control systems will enhance real-time compliance monitoring.
- Growing outsourcing to CMOs will create new opportunities for validated water generation systems.
- Strategic collaborations between global suppliers and pharma companies will shape long-term technological advancements.


