
Market Overview:
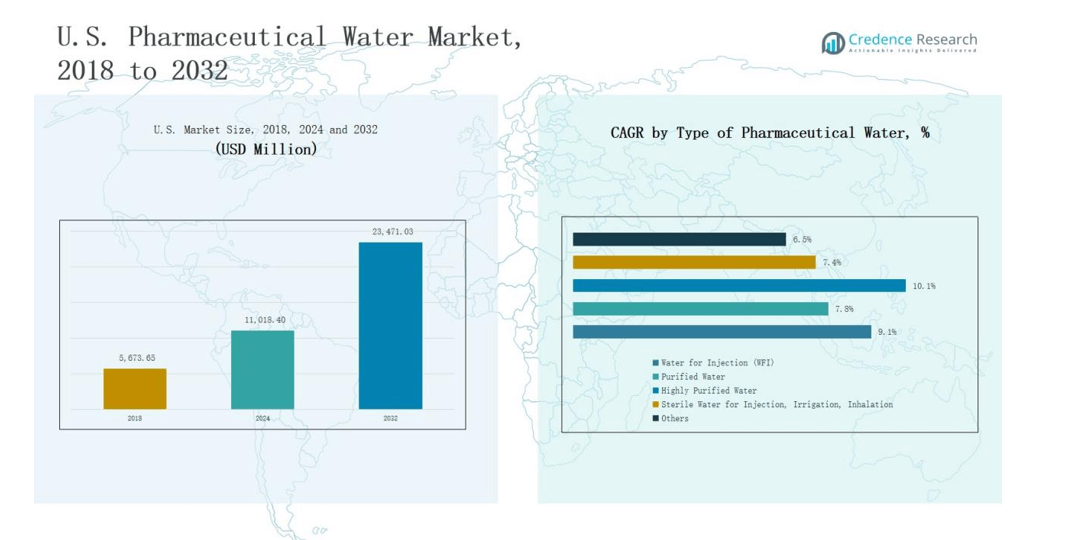
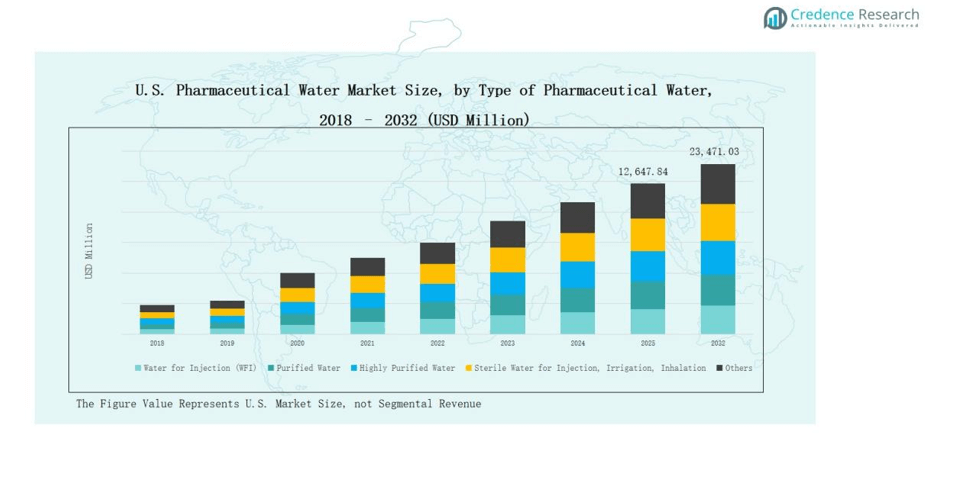
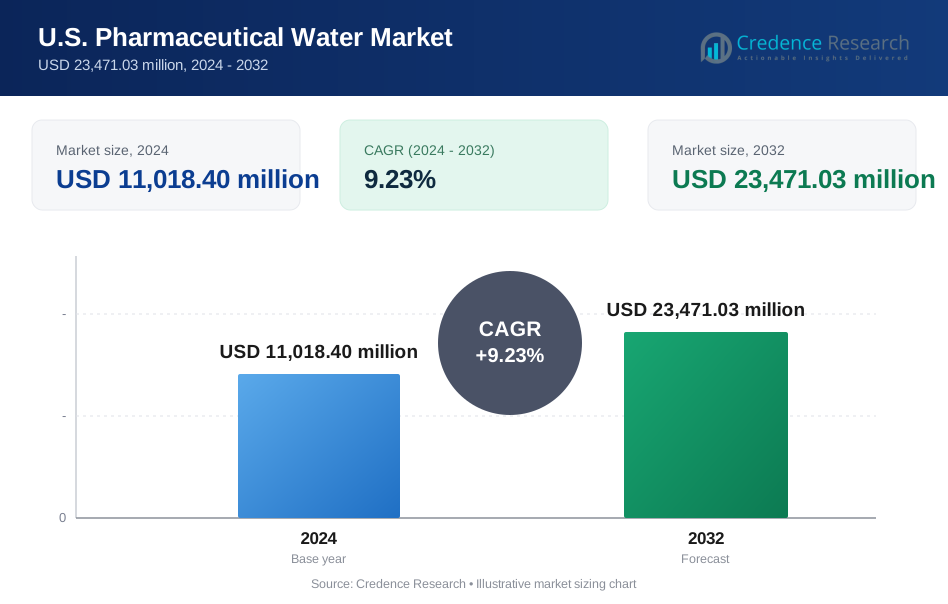
The U.S. Pharmaceutical Water Market was valued at USD 5,673.65 million in 2018, increased to USD 11,018.40 million in 2024, and is projected to reach USD 23,471.03 million by 2032, expanding at a CAGR of 9.23% during the forecast period.
| REPORT ATTRIBUTE | DETAILS |
|---|---|
| Historical Period | 2020-2023 |
| Base Year | 2024 |
| Forecast Period | 2025-2032 |
| U.S. Pharmaceutical Water Market Size 2024 | USD 11,018.40 million |
| U.S. Pharmaceutical Water Market, CAGR | 9.23% |
| U.S. Pharmaceutical Water Market Size 2032 | USD 23,471.03 million |
The U.S. Pharmaceutical Water Market is led by major players including Thermo Fisher Scientific Inc., Danaher Corporation, Ecolab Inc., Veolia Water Technologies, B. Braun Medical Inc., ICU Medical Inc., SteriCare Solutions, Veltek Associates Inc., Sigma-Aldrich (Merck KGaA), and Corning Incorporated. These companies dominate through advanced purification technologies such as reverse osmosis, distillation, and ultraviolet disinfection systems that ensure compliance with FDA and USP standards. Their focus on automation, digital monitoring, and energy-efficient designs strengthens product reliability and regulatory adherence. Among all regions, the Northeast U.S. emerged as the leading market in 2024, capturing 32% of the national share, supported by its dense network of pharmaceutical manufacturers, R&D facilities, and established cleanroom infrastructure.
Market Insights
- The U.S. Pharmaceutical Water Market grew from USD 5,673.65 million in 2018 to USD 11,018.40 million in 2024 and is projected to reach USD 23,471.03 million by 2032, expanding at a CAGR of 9.23%.
- Leading companies such as Thermo Fisher Scientific Inc., Danaher Corporation, Ecolab Inc., and Veolia Water Technologies dominate through advanced purification solutions ensuring FDA and USP compliance.
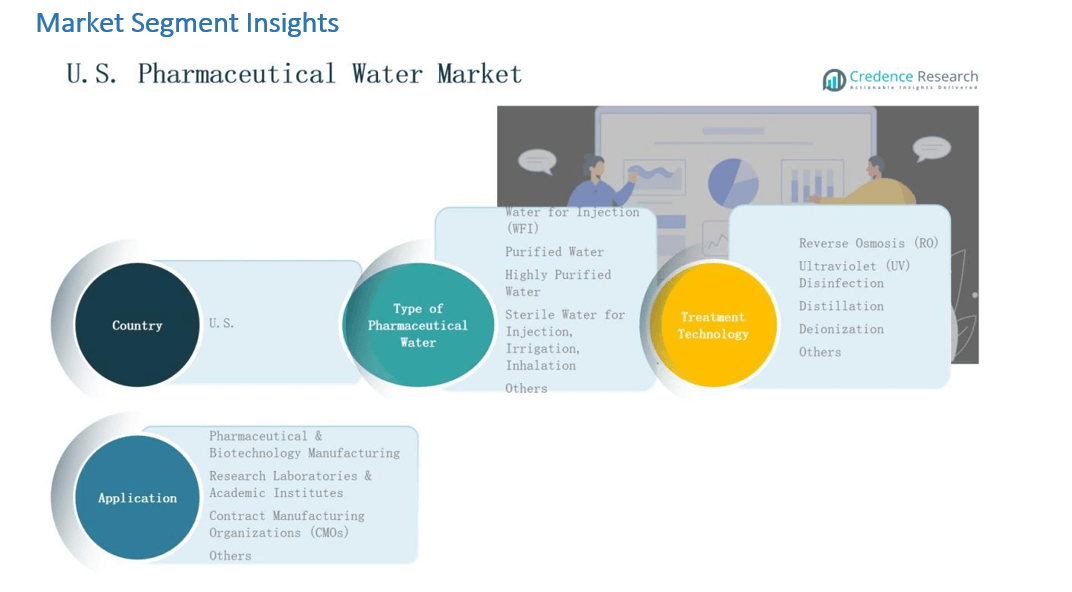
- The Water for Injection (WFI) segment led in 2024 with a 42.1% share, driven by high purity needs for injectable and biopharmaceutical production.
- The Reverse Osmosis (RO) segment held 37.8% of the market due to its energy-efficient purification capabilities and growing use in sustainable pharmaceutical systems.
- The Pharmaceutical & Biotechnology Manufacturing segment dominated with 56.4% share, while the Northeast U.S. led regionally with 32%, supported by strong pharmaceutical manufacturing and advanced R&D facilities.
Market Segment Insights
By Type of Pharmaceutical Water:
The Water for Injection (WFI) segment dominated the U.S. Pharmaceutical Water Market in 2024, accounting for 42.1% of the total share. Its leadership is supported by strict FDA and USP standards requiring WFI for injectable and parenteral drug manufacturing. Continuous demand from biopharmaceutical and vaccine production facilities sustains its growth. Advanced purification systems and high-quality distillation processes enhance production efficiency, ensuring consistent compliance with aseptic manufacturing protocols and sterility assurance standards.
By Treatment Technology:
The Reverse Osmosis (RO) segment led the U.S. Pharmaceutical Water Market in 2024 with a 37.8% share. The segment’s dominance is attributed to its cost-effectiveness, energy efficiency, and high reliability in removing dissolved solids, bacteria, and endotoxins. Growing adoption of multi-stage RO systems across pharmaceutical facilities drives system upgrades. Increasing focus on sustainability and reduced water wastage encourages wider use of RO-based pre-treatment systems in both small and large-scale purification plants.
- For instance, Raesch Quarz (Germany) GmbH is known for manufacturing high-purity quartz glass products, such as quartz sleeves and tubes, which are used as components in industrial systems, including UV water treatment.
By Application:
The Pharmaceutical & Biotechnology Manufacturing segment held the largest share of 56.4% in the U.S. Pharmaceutical Water Market in 2024. High-purity water remains essential for sterile drug formulation, cell culture processes, and biopharmaceutical production. Expansion of biologics, vaccines, and injectable drug pipelines fuels demand. Regulatory emphasis on validated purification systems and cleanroom compliance further strengthens the segment’s dominance, while investments in advanced water management infrastructure support continuous process improvement across manufacturing operations.
- For instance, Pfizer commissioned an advanced water purification facility at its Kalamazoo, Michigan site to support sterile injectable production, integrating multi-stage reverse osmosis and UV sterilization for GMP compliance.
Key Growth Drivers
Expansion of Biopharmaceutical and Vaccine Production
Rising investments in biopharmaceutical and vaccine manufacturing are driving strong demand in the U.S. Pharmaceutical Water Market. High-purity water is critical for injectable drugs, cell therapies, and bioprocessing operations. Government funding for domestic vaccine production and R&D encourages facility expansion and modernization. Companies increasingly adopt automated water purification systems to meet quality and regulatory needs. The trend supports continuous growth across WFI and purified water segments, reinforcing the market’s position within the broader pharmaceutical infrastructure.
- For instance, the Biomedical Advanced Research and Development Authority (BARDA) supports modernization initiatives in domestic vaccine production plants, enhancing purified water systems critical for biopharmaceutical manufacturing operations.
Stringent Regulatory Standards and GMP Compliance
The enforcement of FDA, USP, and GMP standards remains a major growth driver for the U.S. Pharmaceutical Water Market. Pharmaceutical facilities are required to produce and monitor purified water under validated and traceable systems. These strict compliance obligations push firms to upgrade their purification and distribution infrastructure. Adoption of continuous quality monitoring technologies and real-time analytics has increased, improving system reliability. The need to prevent contamination and ensure process integrity continues to sustain market demand across manufacturing applications.
- For instance, Pfizer operates a major manufacturing facility in Kalamazoo, and Emerson produces advanced Rosemount temperature monitoring technology, which could be used for FDA-regulated processes in the pharmaceutical industry.
Technological Advancements in Water Treatment Systems
Ongoing innovations in purification technologies such as reverse osmosis, UV disinfection, and distillation are enhancing operational efficiency. Pharmaceutical manufacturers are deploying intelligent control systems and automated validation tools to improve process consistency. Integration of digital monitoring platforms ensures optimized energy use and reduced maintenance costs. These advancements allow greater customization and scalability in purification units, catering to diverse facility requirements. The focus on automation and process optimization significantly strengthens market competitiveness and supports long-term adoption.
Key Trends & Opportunities
Rising Adoption of Sustainable and Energy-Efficient Systems
Sustainability has emerged as a key trend across the U.S. Pharmaceutical Water Market. Manufacturers are shifting toward low-energy distillation units, water recovery systems, and smart monitoring tools. These technologies reduce water wastage and carbon footprint while maintaining regulatory compliance. Pharmaceutical companies increasingly partner with technology providers to integrate sustainable purification processes within GMP facilities. The emphasis on environmental stewardship and cost optimization continues to create new opportunities for equipment suppliers and system integrators.
- For instance, AstraZeneca has implemented closed-loop water recycling systems in its GMP facilities, significantly reducing water consumption while maintaining regulatory compliance.
Increasing Integration of Automation and Digital Validation
Automation and digitalization are transforming pharmaceutical water systems. Advanced sensors, cloud-based control platforms, and digital validation tools enable continuous system tracking and predictive maintenance. These capabilities minimize human error, improve regulatory traceability, and ensure data integrity. Growing adoption of Industry 4.0 practices among pharmaceutical manufacturers supports this digital shift. Automated systems enhance process efficiency and reliability, creating long-term growth potential for solution providers focused on smart and connected water purification technologies.
- For instance, Merck KGaA introduced its Milli-Q HX 7000 SD water purification system integrating digital performance dashboards and automated compliance reporting to streamline Good Manufacturing Practice (GMP) validation.
Key Challenges
High Capital and Maintenance Costs
Setting up pharmaceutical-grade water purification systems requires substantial investment. Installation of validated equipment, routine calibration, and quality assurance testing increase operational expenses. Smaller facilities often face budget constraints, limiting their ability to implement advanced technologies. Frequent system maintenance and replacement of filters or membranes also add to cost burdens. These financial challenges restrict adoption among mid-tier manufacturers, making affordability a key concern in market expansion and modernization initiatives.
Complexity in System Validation and Regulatory Documentation
Validation and documentation processes remain one of the most time-intensive aspects of pharmaceutical water production. Facilities must maintain compliance records and meet strict inspection requirements from regulatory bodies. Continuous monitoring and revalidation of equipment after modifications create operational delays. Non-compliance can lead to product recalls or penalties, pressuring firms to invest heavily in documentation systems. Managing validation workflows efficiently remains a challenge, especially for multi-site pharmaceutical operations.
Risk of Contamination and Microbial Growth
Maintaining microbial control is a critical challenge in pharmaceutical water systems. Biofilm formation, stagnant flow areas, and inadequate disinfection can compromise water quality. Even minor contamination may lead to production downtime and regulatory non-conformance. Regular sanitization cycles and continuous monitoring are essential but resource-intensive. The increasing complexity of modern manufacturing environments heightens the need for robust contamination prevention measures, driving continuous improvement in system design and operational protocols.
Regional Analysis
Northeast U.S.
The Northeast U.S. accounted for 32% of the U.S. Pharmaceutical Water Market in 2024, supported by its strong concentration of pharmaceutical and biotechnology manufacturing facilities. States such as New Jersey, Massachusetts, and Pennsylvania host leading global drug producers and research hubs. The presence of advanced laboratories and FDA-regulated production units boosts the demand for Water for Injection (WFI) and purified water systems. Continuous investment in cleanroom infrastructure and compliance-driven modernization supports sustained growth. It remains a vital center for innovation and process validation in pharmaceutical water technology.
Midwest U.S.
The Midwest held 24% of the U.S. Pharmaceutical Water Market in 2024, driven by expanding pharmaceutical production and medical research networks. The region benefits from cost-effective facility operations and access to skilled technical labor. States including Illinois, Indiana, and Michigan are key manufacturing zones for sterile injectables and medical-grade ingredients. Water purification system upgrades across GMP-certified facilities drive adoption of advanced distillation and RO technologies. It continues to attract investment in digital water monitoring and sustainable purification systems.
South U.S.
The South U.S. captured 26% of the U.S. Pharmaceutical Water Market in 2024, supported by growing biomanufacturing clusters and favorable industrial policies. Texas, North Carolina, and Florida lead in biotechnology innovation and contract manufacturing activities. The rise of large-scale biologics and vaccine production facilities has boosted demand for high-purity water systems. Adoption of energy-efficient purification methods and expanded water infrastructure projects strengthen the market. It demonstrates strong potential for further expansion due to continuous capacity additions and R&D initiatives.
West U.S.
The West U.S. represented 18% of the U.S. Pharmaceutical Water Market in 2024, anchored by its strong presence in medical device manufacturing and biotechnology startups. California remains the key contributor, housing major R&D and pharmaceutical engineering firms. Growth in sustainable purification systems and increasing automation adoption enhances operational efficiency. Regional demand is also supported by strict water reuse and sustainability standards. It continues to integrate smart technologies within pharmaceutical water systems to meet evolving regulatory and environmental expectations.
Market Segmentations:
By Type of Pharmaceutical Water
- Water for Injection (WFI)
- Purified Water
- Highly Purified Water
- Sterile Water for Injection, Irrigation, Inhalation
- Others
By Treatment Technology:
- Reverse Osmosis (RO)
- Ultraviolet (UV) Disinfection
- Distillation
- Deionization
- Others
By Application:
- Pharmaceutical & Biotechnology Manufacturing
- Research Laboratories & Academic Institutes
- Contract Manufacturing Organizations (CMOs)
- Others
By Region
- Northeast U.S.
- Midwest U.S.
- South U.S.
- West U.S.
Competitive Landscape
The U.S. Pharmaceutical Water Market is highly competitive, with leading players focusing on technological innovation, regulatory compliance, and system reliability. Major companies such as Thermo Fisher Scientific Inc., Danaher Corporation, Ecolab Inc., Veolia Water Technologies, and B. Braun Medical Inc. dominate through advanced purification solutions and strong service networks. Their expertise in reverse osmosis, distillation, and UV disinfection systems enables consistent compliance with FDA and USP standards. Emerging participants like SteriCare Solutions and Veltek Associates Inc. strengthen competition by offering modular, energy-efficient, and automated purification systems. Strategic partnerships and continuous R&D investments are key priorities, supporting integration of digital monitoring, predictive maintenance, and sustainability-focused designs. Intense competition encourages firms to expand validation support, improve efficiency, and ensure long-term reliability across pharmaceutical manufacturing environments. It remains a market defined by innovation-led differentiation and compliance-driven product development.
Key Players
- Thermo Fisher Scientific Inc.
- Danaher Corporation
- Ecolab Inc.
- Veolia Water Technologies
- Braun Medical Inc.
- ICU Medical Inc.
- SteriCare Solutions
- Veltek Associates Inc.
- Sigma-Aldrich (Merck KGaA)
- Corning Incorporated
Recent Developments
- In September 2025, Thermo Fisher Scientific completed the acquisition of Solventum’s Purification and Filtration business, strengthening its pharmaceutical water treatment and filtration portfolio.
- In August 2025, Ecolab Inc. announced the acquisition of Ovivo’s electronics ultra-pure water business, enhancing its capabilities in high-purity water solutions for pharma applications.
- In April 2024, Waters Corporation launched the Alliance iS Bio HPLC System, designed to improve analytical accuracy and efficiency in pharmaceutical water quality testing.
- In March 2025, LANXESS unveiled its Lewatit MDS TP 108 ion exchange resin (for PFAS removal) and new ultrapure water treatment innovations at Aquatech 2025.
Report Coverage
The research report offers an in-depth analysis based on Type of Pharmaceutical Water, Type of Pharmaceutical Water, Application and Region. It details leading market players, providing an overview of their business, product offerings, investments, revenue streams, and key applications. Additionally, the report includes insights into the competitive environment, SWOT analysis, current market trends, as well as the primary drivers and constraints. Furthermore, it discusses various factors that have driven market expansion in recent years. The report also explores market dynamics, regulatory scenarios, and technological advancements that are shaping the industry. It assesses the impact of external factors and global economic changes on market growth. Lastly, it provides strategic recommendations for new entrants and established companies to navigate the complexities of the market.
Future Outlook
- Demand for high-purity water systems will grow with the expansion of biopharmaceutical production.
- Adoption of automation and digital monitoring technologies will strengthen process reliability.
- Sustainability initiatives will drive the use of energy-efficient and water-saving purification systems.
- Pharmaceutical manufacturers will increase investment in modular and scalable water treatment units.
- Integration of real-time data analytics will enhance system validation and quality assurance.
- Regulatory compliance requirements will continue to shape design and operational standards.
- Contract manufacturing organizations will expand purification capacity to meet client demand.
- Growth in personalized medicine and injectable therapies will boost Water for Injection needs.
- Strategic collaborations between technology providers and pharmaceutical firms will accelerate innovation.
- Continuous R&D will improve microbial control, efficiency, and cost-effectiveness in water systems.
Request a Free Sample
Fill in your details and we'll send you a free sample report.
- Sample data tables & charts
- Research methodology
Need a Custom Version of This Report?
Tailor the scope, geography, or segments to your exact requirements.
- Custom geography or segment scope
- Direct access to our analyst team
Frequently Asked Questions
What is the current market size for the U.S. Pharmaceutical Water Market, and what is its projected size in 2032?
At what Compound Annual Growth Rate is the U.S. Pharmaceutical Water Market projected to grow between 2025 and 2032?
Which U.S. Pharmaceutical Water Market segment held the largest share in 2024?
What are the primary factors fueling the growth of the U.S. Pharmaceutical Water Market?
Who are the leading companies in the U.S. Pharmaceutical Water Market?
Table of Content
Chapter 1. Report Introduction
- 1.1 Report Description & Purpose
- 1.1.1 Report Title & Market Definition
- 1.1.2 Unique Selling Propositions (USP) & Key Differentiators
- 1.1.3 Value Proposition for Stakeholders
- 1.2 Research Objectives
- 1.2.1 Market Sizing Objectives (Volume & Revenue)
- 1.2.2 Segmentation Objectives
- 1.2.3 Competitive Intelligence Objectives
- 1.2.4 Forecast & Scenario Objectives
- 1.3 Report Scope
- 1.3.1 U.S. Pharmaceutical Water Scope – Types & Subtypes Covered
- 1.3.2 Geographic Scope – Regions & Countries Covered
- 1.3.3 Historical Period, Base Year & Forecast Period (2024; forecast to 2032)
- 1.3.4 Inclusions & Exclusions
- 1.4 HS Code & Classification Framework
- 1.5 Currency, Units & Pricing Basis
- 1.6 Target Stakeholders
- 1.7 Limitations & Assumptions
Chapter 2. Executive Summary
- 2.1 Global U.S. Pharmaceutical Water Market Snapshot
- 2.1.1 Market Size – Historical (2024) & Forecast (2024-2032) (2024: USD 11,018.40 million → 2032: USD 23,471.03 million)
- 2.1.2 Volume & Revenue – Global Totals
- 2.1.3 Key Market Highlights – Top Five Facts
- 2.2 U.S. Pharmaceutical Water Market Segmentation Snapshot
- 2.2.1 Market Split by Region – 2024 vs. 2032
- 2.3 Competitive Snapshot
- 2.3.1 Top 10 Players by Revenue Share – 2024
- 2.3.2 Top 10 Players by Volume Share – 2024
- 2.3.3 Recent Strategic Developments (18-Month Summary)
- 2.4 Key Investment Highlights & Strategic Conclusions
Chapter 3. U.S. Pharmaceutical Water Market Dynamics & Industry Analysis
- 3.1 Market Overview & Context
- 3.1.1 U.S. Pharmaceutical Water Market Position in the Broader Automotive Value Chain
- 3.1.2 OEM vs. Replacement Market Dynamics
- 3.1.3 Market Maturity & Development Stage by Region
- 3.2 U.S. Pharmaceutical Water Market Drivers
- 3.3 U.S. Pharmaceutical Water Market Restraints & Challenges
- 3.4 U.S. Pharmaceutical Water Market Opportunities
- 3.5 Porter's Five Forces Analysis
- 3.5.1 Threat of New Entrants
- 3.5.2 Bargaining Power of Suppliers
- 3.5.3 Bargaining Power of Buyers
- 3.5.4 Threat of Substitutes
- 3.5.5 Competitive Rivalry – Intensity Assessment
- 3.6 U.S. Pharmaceutical Water Value Chain Analysis
- 3.6.1 Upstream – Raw Material/Input Suppliers
- 3.6.1.1 Raw Material/Input 1
- 3.6.1.2 Raw Material/Input 2
- 3.6.1.3 Raw Material/Input 3
- 3.6.2 Midstream – Production/Manufacturing/Service Delivery
- 3.6.2.1 Production/Process Overview
- 3.6.2.2 Key Facility Locations & Capacity by Manufacturer
- 3.6.3 Downstream – Distribution & End Consumer
- 3.6.3.1 Primary Channel – B2B/OEM
- 3.6.3.2 Secondary Channels – Dealer, Retail, Online, Direct
- 3.6.4 Value Chain Profitability Analysis
- 3.6.1 Upstream – Raw Material/Input Suppliers
- 3.7 PESTEL Analysis
- 3.7.1 Political Factors
- 3.7.2 Economic Factors
- 3.7.3 Social Factors
- 3.7.4 Technological Factors
- 3.7.5 Environmental Factors
- 3.7.6 Legal Factors
- 3.8 U.S. Pharmaceutical Water Supply Chain Analysis
- 3.8.1 Raw Material/Input Supply Risk Assessment
- 3.8.2 Manufacturing Concentration Risk (Geographic Exposure)
- 3.8.3 Trade Disruption Impact Analysis
- 3.9 Regulatory & Policy Landscape
Note: The regulatory and policy landscape section covers regulations based on their applicability to the market, U.S. Pharmaceutical Water category, geography, and scope of the study. Only regulatory frameworks with a material impact on operations, compliance, trade, sustainability, or market access are analyzed in detail.
Chapter 4. Key Investment Pockets & Opportunity Analysis
- 4.1 U.S. Pharmaceutical Water Market Attractiveness Analysis
- 4.1.1 By Region – Investment Attractiveness Matrix (Volume × CAGR)
- 4.2 Absolute Revenue Growth Opportunity
- 4.2.1 By Region – Absolute USD Growth Through 2032
- 4.3 Incremental Volume Opportunity
- 4.3.1 By Region – Incremental Volume Through 2032
- 4.3.2 Segment – Incremental Volume
- 4.4 Emerging Submarket Opportunity Deep Dive (Subject to Applicability)
- 4.5 Emerging Market Opportunity Scorecards
- 4.5.1 United States
- 4.5.2 Europe
- 4.5.3 Asia
- 4.5.4 Middle East & Africa
Note: Emerging Market Opportunity Scorecards will be included based on relevance and strategic importance. Regions listed are indicative and may vary depending on data availability and market dynamics.
Chapter 5. U.S. Pharmaceutical Water Import-Export Analysis & Trade Flows
- 5.1 Global Trade Overview
- 5.1.1 Global Export Value by Country (2024)
- 5.1.2 Global Export Volume by Country (2024)
- 5.1.3 Global Import Value by Country (2024)
- 5.1.4 Global Import Volume by Country (2024)
- 5.1.5 Net Trade Balance by Country (2024)
- 5.2 Export Analysis – Segment
- 5.2.1 Type 1 (HS Code)
- 5.2.2 Type 2 (HS Code)
- 5.2.3 Type 3 (HS Code)
- 5.2.4 Type 4 (HS Code)
- 5.2.5 Type 5 (HS Code)
- 5.3 Import Analysis – Segment
- 5.3.1 Type 1 (HS Code)
- 5.3.2 Type 2 (HS Code)
- 5.3.3 Type 3 (HS Code)
- 5.3.4 Type 4 (HS Code)
- 5.3.5 Type 5 (HS Code)
- 5.4 Average Unit Trade Prices
- 5.4.1 Average Export Price – Segment & Country
- 5.4.2 Average Import Price – Segment & Source Country
- 5.4.3 Price Trends (2024)
- 5.5 Key Trade Route Analysis
- 5.5.1 Trade Route 1
- 5.5.2 Trade Route 2
- 5.5.3 Trade Route 3
- 5.5.4 Trade Route 4
- 5.5.5 Trade Route 5
- 5.6 Trade Policy Impact Assessment
- 5.6.1 US Anti-Dumping & Section 301 Tariffs
- 5.6.2 EU Customs Union Impact
- 5.6.3 Major Free Trade Agreements
- 5.6.4 USMCA Rules of Origin
Note: Trade policy analysis will be included only where relevant to the U.S. Pharmaceutical Water market.
Chapter 6. Competitive Landscape & Company Benchmarking
- 6.1 U.S. Pharmaceutical Water Market Concentration & Structure
- 6.1.1 Herfindahl-Hirschman Index (HHI) – vs. 2024
- 6.1.2 Tier 1, Tier 2 & Tier 3 Market Structure
- 6.1.3 Global, Regional & Local Player Dynamics
- 6.2 U.S. Pharmaceutical Water Market Share Analysis – 2024
- 6.2.1 Global Revenue Share by Company
- 6.2.2 Global Volume Share by Company
- 6.2.3 Regional Revenue Share
- 6.2.4 Market Share Evolution ( vs. 2024)
- 6.2.5 OEM Segment Share by Company
- 6.2.6 Replacement Segment Share by Company
- 6.3 Production/Delivery Capacity & Facility Analysis
- 6.3.1 Global Installed Capacity
- 6.3.2 Capacity Utilization Rates
- 6.3.3 Production/Output Volume
- 6.3.4 Facility Locations & Capacity Map
- 6.3.5 Planned Capacity Additions
- 6.4 U.S. Pharmaceutical Water Competitive Benchmarking Matrix
- 6.4.1 Revenue, Volume, CAGR & Profitability Comparison
- 6.4.2 Channel Revenue Mix
- 6.4.3 Geographic Revenue Exposure
- 6.4.4 R&D Intensity
- 6.4.5 Sustainability Maturity
- 6.5 Strategic Developments in U.S. Pharmaceutical Water (Last 24 Months)
- 6.5.1 Mergers, Acquisitions & Divestments
- 6.5.2 New U.S. Pharmaceutical Water Launches
- 6.5.3 Facility Expansions
- 6.5.4 Strategic Alliances, Joint Ventures & Partnerships
- 6.5.5 Distribution Expansion & Market Entry
- 6.5.6 Sustainability & ESG Initiatives
- 6.6 Competitive Strategy Mapping
- 6.6.1 Leader, Challenger, Follower & Niche Classification
- 6.6.2 Pricing Strategy Comparison
- 6.6.3 Channel Strategy Matrix
Note: Strategic developments are included based on their materiality and the availability of reliable information.
Chapter 7. Global U.S. Pharmaceutical Water Market – By Distribution Channel
- 7.1 Segment Overview
- 7.1.1 Volume & Revenue Split by Channel (2024 & 2032)
- 7.1.2 Channel Mix Evolution (2024-2032)
Chapter 8. Regional Market Analysis – Global Overview
- 8.1 Global Regional Overview
- 8.1.1 Regional Volume Share
- 8.1.2 Regional Revenue Share
- 8.1.3 Regional Volume by Region
- 8.1.4 Regional Revenue by Region
- 8.1.5 Regional Forecast Through 2032
- 8.2 Cross-Regional Segment Analysis
- 8.2.1 By Distribution Channel
- 8.2.2 By Brand/Price Tier
Chapter 9. North America U.S. Pharmaceutical Water Market
- 9.1 United States
- 9.2 Canada
- 9.3 Mexico
Chapter 10. Europe U.S. Pharmaceutical Water Market
- 10.1 Germany
- 10.2 France
- 10.3 Italy
- 10.4 United Kingdom
- 10.5 Spain
- 10.6 Poland
- 10.7 Russia
- 10.8 Netherlands
- 10.9 Belgium
- 10.10 Sweden
- 10.11 Denmark
- 10.12 Norway
- 10.13 Rest of Europe
Chapter 11. Asia Pacific U.S. Pharmaceutical Water Market
- 11.1 China
- 11.2 India
- 11.3 Japan
- 11.4 South Korea
- 11.5 Thailand
- 11.6 Indonesia
- 11.7 Vietnam
- 11.8 Malaysia
- 11.9 Australia
- 11.10 Rest of Asia Pacific
Chapter 12. Latin America U.S. Pharmaceutical Water Market
- 12.1 Brazil
- 12.2 Argentina
- 12.3 Colombia
- 12.4 Chile
- 12.5 Rest of Latin America
Chapter 13. Middle East U.S. Pharmaceutical Water Market
- 13.1 Saudi Arabia
- 13.2 United Arab Emirates
- 13.3 Turkey
- 13.4 Israel
- 13.5 Iran
- 13.6 Rest of the Middle East
Chapter 14. Africa U.S. Pharmaceutical Water Market
- 14.1 South Africa
- 14.2 Egypt
- 14.3 Nigeria
- 14.4 Morocco
- 14.5 Rest of Africa
Chapter 15. U.S. Pharmaceutical Water Company Profiles
- 15.1 [Company 01]
- 15.1.1 Company Overview
- 15.1.2 Key Management Personnel
- 15.1.3 Products & Services Portfolio
- 15.1.4 Financial Performance
- 15.1.5 Key Market Focus & Geographic Presence
- 15.1.6 Recent Developments & Strategic Initiatives
Note: The company profile list is preliminary and may change based on research findings, market developments, data availability, and client requirements.
Chapter 16. Appendices
- Appendix A – List of Abbreviations & Acronyms
- Appendix B – Industry Classification Code Reference – Full Series
- Appendix C – Production & Capacity Data Tables
- Appendix D – End-Use & Demand Base Tables
- Appendix E – Consumption & Replacement Rate Assumptions
- Appendix F – ASP Reference Tables
- Appendix G – Manufacturing & Facility Database
- Appendix H – Import-Export Data Tables
- Appendix I – Regulatory Summary Tables
- Appendix J – Primary Research Participant List (Anonymized)
- Appendix K – Primary Research Questionnaire Framework
- Appendix L – Data Sources & Bibliography
- Appendix M – Market Size Divergence & Source Comparison
Chapter 17. Research Methodology
- 17.1 Research Framework & Philosophy
- 17.2 Secondary Research – Sources, Hierarchy & Data Extraction
- 17.3 Data Modeling – Bottom-Up & Top-Down Market Sizing
- 17.4 Primary Research – Stakeholder Framework, LOI & Sample Sizes
- 17.5 Forecast Methodology – Regression, Scenario & Sensitivity Analysis
- 17.6 Quality Control – Four-Layer Validation Framework
- 17.7 Limitations & Standard Assumptions
- 17.8 Disclaimer
