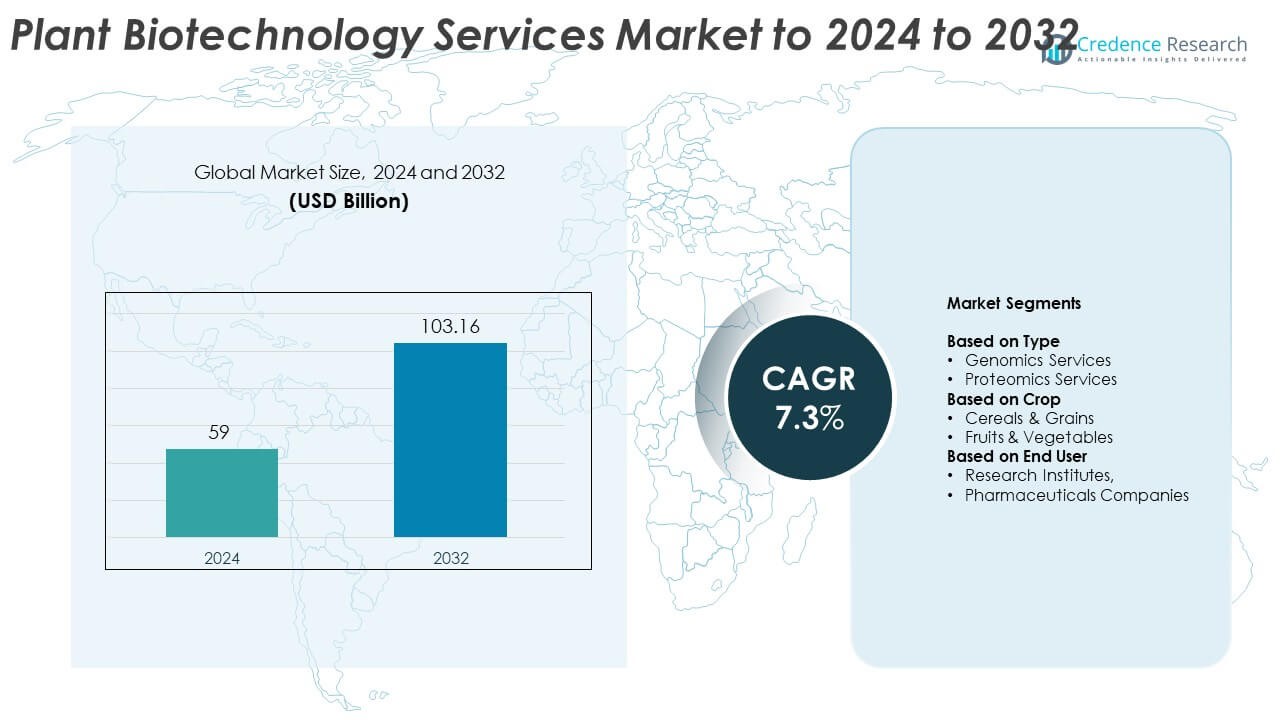
Home » Advanced Materials » Plant Biotechnology Services Market

Plant Biotechnology Services Market By Equipment Type (Incubators, Sequencer, Temperature Controllers, Sensors) By Application (Soil handling, Breeding, Product development, Yield improvement)-Growth, Future Prospects & Competitive Analysis, 2016 – 2030

Price: $4999

Published: | Report ID: 20696 | Report Format : PDF

Actionable Insights Delivered – Plant Biotechnology Services Market Size

Positioned with a USD 50.8 Billion valuation in 2022, the Plant Biotechnology Services Market asserted its global eminence. Set to scale to USD 84.2 Billion by 2030, the market’s remarkable Compound Annual Growth Rate (CAGR) of 7.5% (2022-2030) underscores its strategic growth trajectory.

Key Highlights of the Report

The global plant biotechnology services market is segmented by equipment type, application, service, end user, technology, crop, and region. Sequencer is the most widely used, while genetic modification is a widely utilized segment. Biotechnology companies are the most used, while genomics services are a widely utilized segment. Cloud-based technology is the most used. North America is leading the market growth.

The growing demand for genetically modified crops to boost yield and quality and the expanding use of cutting-edge technologies like genomics and molecular breeding for plant improvement are two factors driving the market for plant biotechnology services. The stringent laws and widespread apprehension about genetically modified organisms (GMOs) are market restraints that might make them difficult to comply with and adopt.

Nonetheless, the global plant biotechnology services market is expanding worldwide population. The rising need for sustainable agriculture, which generates a need for cutting-edge plant biotechnology solutions, presents two prospects for the market for plant biotechnology services. Furthermore, improvements in gene editing techniques like CRISPR-Cas9 open new opportunities for precise and effective plant genetic alterations, providing a path to improved crop attributes and increased agricultural output.

Design Element 2

Access crucial information at unmatched prices!

Request your free sample report today & start making informed decisions powered by Credence Research!

Download Free Sample
CTA Design Element 3

What Are The Main Drivers Of The Global Plant Biotechnology Services Market?

There is a strong need to increase agricultural output and assure food security due to a fast-expanding global population. Plant biotechnology services provide solutions to meet the demand for food production, including genetic engineering, molecular breeding, and crop improvement methods.

What Are The Major Challenges Faced By The Global Plant Biotechnology Services Market?

Many nations have severe laws governing introducing and commercializing genetically modified organisms (GMOs). Plant biotechnology services’ market expansion and uptake are hampered by the time and expense required for regulatory clearances.

What Are The Growth Opportunities In The Global Plant Biotechnology Services Market?

Sustainable agricultural methods and minimizing the negative effects of farming on the environment are becoming increasingly important. Precision breeding methods, biopesticides, and biofertilizers are just a few of the cutting-edge solutions that plant biotechnology services provide. These activities promote sustainable agricultural practices and offer large growth potential.

Executive Summary

Overview of the Global Plant Biotechnology Services Market

Due to several causes, the market for plant biotechnology services worldwide is expanding significantly. The rising demand for food security caused by a growing worldwide population drives the adoption of plant biotechnology services. High-yielding and hardy crops are being created thanks to technological developments in genomics, molecular breeding, and gene editing. Additionally, prospects for plant biotechnology solutions are created by emphasizing sustainable agriculture and minimizing environmental effects. However, the market faces difficulties like legal restrictions and negative public perception. Overall, as it serves crucial agricultural demands and investigates novel methods of crop enhancement, the industry offers strong growth prospects.

Market Definition

A wide range of specialized services are referred to as “plant biotechnology services” and are provided to the agriculture and plant breeding industries to increase crop yield, enhance characteristics, and handle numerous issues related to plant cultivation. These services use biotechnological methods and tools to change plant genetic information, examine plant genomes, and create cutting-edge crop improvement approaches. Genetic modification, molecular breeding, genomics services, Sensors, trait analysis, tissue culture, bioinformatics, and other cutting-edge technologies may be used in plant biotechnology services. These services enhance crop traits, disease resistance, yield, nutrient content, and agricultural sustainability. These services are essential for creating new crop types, addressing issues with food security, and promoting sustainable agricultural methods.

Market Insights

  • The global demand for plant biotechnology services was valued at USD 50.8 Billion in 2022 and is expected to reach USD 84.2 Billion in 2030, growing at a CAGR of 7.5% between 2023 and 2030.
  • The sequencer is the market leader in the equipment type and holds over 20% of the market’s value in 2022, while sensors are anticipated to show the quickest CAGR over the forecast period,
  • The genetic modification segment governs the global demand for plant biotechnology services, holding a massive share of over 30% in 2022, and is expected to grow at a rapid CAGR.
  • Biotechnology companies are the market leader in end user, holding over 40% of the market’s value in 2022.
  • The genomics services segment governs the global demand for plant biotechnology services, holding a massive share of over 40% in 2022, and is expected to grow at a rapid CAGR.
  • The cloud-based technology is the market leader in the equipment type and holds over 20% of the market’s value is 2022, while WIFI technology is anticipated to show the quickest CAGR over the forecast period,
  • The cereals and grains segment governs the global demand for plant biotechnology services, holding a massive share of over 30% in 2022, and is expected to grow at a rapid CAGR.
  • North America is fueling the growth of the plant biotechnology services industry with over one-third share in 2022. Europe and Asia Pacific collectively accounted for just under 40% share in 2022. Asia Pacific held over 22% share in 2022.
  • Due to its sophisticated research infrastructure, sizeable biotechnology investments, and robust collaboration between academic institutions, research organizations, and biotechnology corporations, the North American area dominates the market for plant biotechnology services.
  • Growing demand for sustainable agriculture solutions, driven by the need to solve issues with global food security and reduce environmental impact, is one factor driving the market for plant biotechnology services. One barrier to the marketing and uptake of plant biotechnology services is the difficult and strict regulatory environment around genetically modified organisms (GMOs) in many nations.

Segmentation by Equipment Type

  • Sequencer is the leading segment by equipment type and held over 20% share in value in 2022.
  • The sensor segment will likely exhibit the fastest CAGR during the forecast period.

Segmentation by Application

  • The genetic modification segment governs the global demand for plant biotechnology services, holding a massive share of over 30% in 2022, and is also expected to grow at a rapid CAGR.
  • Soil handling contributes to the rest of the demand for plant biotechnology services.

Segmentation by End User

  • Biotechnology companies are the leading segment by type, holding over 40% share in value in 2022.
  • The pharmaceuticals industry segment will likely exhibit the fastest CAGR during the forecast period.

Segmentation by Services

  • Genomics services are the leading segment by type, holding over 40% share in value in 2022.
  • The analytical chemistry segment will likely exhibit the fastest CAGR during the forecast period.

Segmentation by Technology

  • The cloud-based technology segment governs the global demand for plant biotechnology services, holding a massive share of over 20% in 2022, and is also expected to grow at a rapid CAGR.
  • The WIFI technology segment contributes to the rest of the demand for plant biotechnology services.

Segmentation by Crops

  • The cereals and grains segment governs the global demand for plant biotechnology services, holding a massive share of over 30% in 2022, and is also expected to grow at a rapid CAGR.
  • The pharmaceutical industry contributes to the rest of the demand for plant biotechnology services.

Segmentation by Region

  • North America is fueling the growth of the plant biotechnology services industry with over one-third share in 2022.
  • Asia Pacific and Europe collectively account for just under 40% share in 2022, with Asia Pacific holding over 22% share in the same year.
  • The rest of the World, including Latin America, The Middle East, and Africa, contributes the remainder to the demand for plant biotechnology services.

The growing worldwide population drives the need for more food production and higher crop yields, which is a major driver of the market for plant biotechnology services. In response to the increased demand for sustainable agriculture practices, plant biotechnology services provide creative solutions such as genetic changes, molecular breeding, and biotechnological approaches to generate high-yielding and robust crops.

Plant biotechnology services are heavily used in the US to increase agricultural production and create genetically modified crops. Collaboration between research organizations, biotechnology businesses, and agricultural stakeholders drives the industry. Developing high-yielding, disease-resistant crops has been made possible by adopting sophisticated biotechnology tools and methods, which have helped enhance food production. Government financing for R&D and supportive regulatory frameworks support the sector. Plant biotechnology services are used to boost crop quality, improve characteristics, and combat problems like pests, diseases, and environmental stressors.

The plant biotechnology services business is extremely important to Brazil’s agriculture industry. Brazil uses plant biotechnology services to increase crop yields and create better-feature varieties because of its extensive agricultural grounds and diverse crop output. The market is used for genetic engineering, molecular breeding, and biotech solutions to combat issues like illnesses, pests, and climate fluctuation. Partnerships between research organizations, biotech firms, and agricultural associations in Brazil, a key producer of these crops, drive the genetically modified soybeans, corn, and cotton market. Plant biotechnology services enhance sustainable farming methods and increase the competitiveness of the nation’s agriculture.

Plant Biotechnology Services Market

Increasing Demand for Sustainable Agriculture

The rising need for sustainable agriculture is significantly driving the market for Plant biotechnology services. There is a critical need for novel solutions to increase agricultural output while reducing environmental effects in light of growing global concerns about food security, environmental sustainability, and climate change.

Various tools and methods are available through plant biotechnology services to address these issues. Higher agricultural yields and less reliance on chemical inputs are possible because of the introduction of features including pest resistance, drought tolerance, and increased nutrient utilization through genetic engineering. Through careful selection and cross-pollination of plants based on their genetic makeup, molecular breeding techniques allow the creation of novel plant varieties with desirable features.

Advancements in Gene Editing Technologies

Improvements in gene editing technologies like CRISPR-Cas9 are significantly boosting the market for plant biotechnology services. Plant genomes may be precisely modified through gene editing, allowing for the insertion or targeted mutation of genes to produce desired features.

The effectiveness and precision of gene editing are two significant benefits. Particularly CRISPR-Cas9 has transformed the industry by offering a more straightforward and adaptable method for genome editing. Compared to earlier methods, it enables researchers to make exact changes more affordably and faster. The pace of plant breeding and trait development has quickened as a result.

The potential for agricultural enhancement offered by gene editing technology is enormous. They can be applied to impart advantageous features like better nutritional value, disease resistance, shelf life, and heightened resistance to environmental challenges. These characteristics are essential for breeding crops that can endure the threats posed by pests, diseases, and climate change.

Complex And Stringent Regulatory Landscape Surrounding Genetically Modified Organisms (GMOs)

The complicated and strict regulatory environment surrounding genetically modified organisms (GMOs) is one barrier to the market for plant biotechnology services. The commercialization and production of GMO crops are subject to stringent laws and approval procedures that several nations have implemented.

Obtaining regulatory permits can be time-consuming and expensive for businesses and organizations engaged in plant biotechnology. The public’s worries and mistrust of GMOs can complicate the regulatory climate. The necessity for significant testing, risk analysis, and regulatory compliance can prevent the sale of genetically modified crops and restrict the use of plant biotechnology services.

Growing Demand for Sustainable Agriculture Solutions

The growing need for sustainable agriculture solutions is a key opportunity in the market for plant biotechnology services. Innovative methods that provide food security while reducing environmental impact are urgently needed as the world’s population keeps expanding and the environmental effects of conventional farming practices become increasingly obvious.

Plant biotechnology services offer sustainable agriculture solutions like genetic engineering, molecular breeding, and precision farming. Plant biotechnology aids in boosting crop yield and lowering dependency on chemical inputs by creating crops with superior features like disease resistance, drought tolerance, and greater nutrient use. As a result, resources are used more effectively, greenhouse gas emissions are reduced, and soil and water pollution are reduced.

Advancements in Precision Breeding Techniques

Precision breeding method improvements offer a substantial market opportunity for plant biotechnology services. Precision breeding entails selecting and crossing plants based on their genetic makeup to create new plant varieties with desired qualities. Breeders can quicken the process of crop improvement and modify crops to meet certain market demands using this method.

Marker-assisted selection (MAS) and genomic selection are two examples of precision breeding approaches with significant advantages over conventional breeding procedures. Breeders can detect and choose individuals with desirable qualities, such as disease resistance, high yield, or better nutritional content, at an early stage by looking at the genetic makeup of plants. This makes breeding decisions more effective and precise, requiring less time and money to create new types.

Precision breeding methods can also solve problems with conventional breeding, such as lengthy breeding cycles, low success rates, and the possibility of unwanted characteristics. Breeders can increase the precision and efficacy of trait selection by utilizing genomic data and sophisticated statistical models, leading to more predictable and focused outcomes.

Competitive Landscape

Key Players

The global plant biotechnology services market is highly competitive, with several key players. Some of the major players in the market and their market share are as follows:

  • Thermo Fisher Scientific Inc.
  • Agilent Technologies, Inc.
  • Eurofins Scientific SE
  • GenScript Biotech Corporation

Research institutes, biotechnology companies, and agricultural technology companies are just a few of the major players that make up the market’s competitive landscape for Plant Biotechnology Services. These organizations compete based on their technological development, plant genomics knowledge, service portfolio, partnerships with industry partners, and capacity to address the changing demands of the agricultural business.

Shape Your Report to Specific Countries or Regions & Enjoy 30% Off!

Summary of Key Findings

  • Regarding equipment type, the sequencer is the market leader and will account for over 20% of market value in 2022; sensors are expected to grow faster over the projection period.
  • The sector of genetic modification is predicted to dominate the global market for plant biotechnology services in 2022, accounting for a substantial proportion of over 30%.
  • With more than 40% of the market’s value held by biotechnology businesses in 2022, they are the market leader in terms of end users.
  • With a huge market share of over 40% in 2022 and the expectation of strong CAGR growth, the genomics services category is predicted to dominate the global demand for plant biotechnology services.
  • Regarding equipment type, cloud-based technology is the market leader and will account for over 20% of market value in 2022; however, WIFI technology is expected to grow fastest over the projected period.
  • With a significant market share of over 30% in 2022 and projections for high CAGR growth, the cereals and grains industry will likely continue dominating the global demand for plant biotechnology services.
  • With a share of more than one-third in 2022, North America is the industry’s main growth driver. Europe and Asia-Pacific made for just under 40% of the market in 2022. In 2022, Asia Pacific owned a share of over 22%.

Future Outlook

  • As long as major issues like food security, climate change, and environmental sustainability exist, there will be a greater need for novel approaches to increase agricultural yield and enhance characteristics.
  • The sector will change further due to improved genomic analysis, precision breeding, and gene editing technologies.
  • Government regulations that support sustainable agriculture methods and their rising acceptance will also open up business opportunities.
  • Future potential depends on the market’s capacity to offer effective and sustainable solutions to meet the rising demand for high-quality and resilient crops.

Segmentation

  • By Equipment Type
    • Incubators
    • Sequencer
    • Temperature Controllers
    • Sensors
    • Sterilizers
    • Centrifuges
    • Others
  • By Application
    • Soil handling
    • Breeding
    • Product development
    • Yield improvement
    • Genetic modification
    • Disease Resistance
    • Others
  • By End User
    • Research institutions
    • Pharmaceuticals industry
    • Biotechnology companies
  • By Service
    • GMO analysis
    • Cellular imaging
    • Analytical Chemistry
    • Genomics services
    • Quality assessment
  • By Technology
    • RF Technology
    • WIFI technology
    • Imaging technology
    • Bluetooth technology
    • Cloud-based technology
    • Others
  • By Crop
    • Cereals and grains
    • Pharmaceuticals industry
    • Agricultural companies
    • Biotechnology companies
    • Others
  • By Region
  • North America
    • USA
    • Canada
    • Mexico
  • Europe
    • Germany
    • France
    • U.K.
    • Italy
    • Spain
    • Rest of Europe
  • Asia Pacific
    • China
    • Japan
    • India
    • South Korea
    • South-east Asia
    • Rest of Asia Pacific
  • Latin America
    • Brazil
    • Argentina
    • Rest of Latin America
  • Middle East & Africa
    • GCC Countries
    • South Africa
    • Rest of Middle East and Africa

1. Preface
1.1. Report Description
1.1.1. Purpose of the Report
1.1.2. Target Audience
1.1.3. USP and Key Offerings
1.2. Research Scope
1.3. Research Methodology
1.3.1. Phase I – Secondary Research
1.3.2. Phase II – Data Modelling
1.3.2.1. Company Share Analysis Model
1.3.2.2. Revenue Based Modelling
1.3.3. Phase III – Primary Research
1.3.4. Research Limitations
1.3.5. Assumptions
1.4. Market Introduction
1.5. Market Research Scope

2. Executive Summary
2.1. Market Snapshot: Global Plant Biotechnology Services Market
2.2. Global Plant Biotechnology Services Market, By Equipment Type
2.3. Global Plant Biotechnology Services Market, By Application
2.4. Global Plant Biotechnology Services Market, By Technology
2.5. Global Plant Biotechnology Services Market, By Service
2.6. Global Plant Biotechnology Services Market, By Technology
2.7. Global Plant Biotechnology Services Market, By Crop
2.8. Global Plant Biotechnology Services Market, By Region

3. Market Dynamics & Factors Analysis
3.1. Introduction
3.1.1. Global Plant Biotechnology Services Market Value, 2017-2030, (US$ Bn)
3.1.2. Y-o-Y Growth Trend Analysis
3.2. Market Dynamics
3.2.1. Market Drivers
3.2.2. Market Restraints
3.2.3. Market Opportunities
3.2.4. Major Industry Challenges
3.3. Growth and Development Patterns
3.4. Investment Feasibility Analysis
3.5. Market Opportunity Analysis
3.5.1. Equipment Type
3.5.2. Application
3.5.3. End User
3.5.4. Service
3.5.5. Technology
3.5.6. Crop
3.5.7. Geography

4. Premium Insights
4.1. STAR (Situation, Task, Action, Results, Analysis)
4.2. Porter’s Five Forces Analysis
4.2.1. Threat of New Entrants
4.2.2. Bargaining Power of Buyers/Consumers
4.2.3. Bargaining Power of Suppliers
4.2.4. Threat of Substitute Types
4.2.5. Intensity of Competitive Rivalry
4.3. Key Market Trends
4.3.1. Demand Side Trends
4.3.2. Supply Side Trends
4.4. Value Chain Analysis
4.5. Equipment Type Analysis
4.6. Analysis and Recommendations
4.7. Marketing Strategy Analysis
4.7.1. Direct Marketing
4.7.2. Indirect Marketing
4.7.3. Marketing Channel Development Trend

5. Market Positioning of Key Players, 2022
5.1. Company market share of key players, 2022
5.2. Competitive Benchmarking
5.3. Market Positioning of Key Vendors
5.4. Geographical Presence Analysis
5.5. Major Strategies Adopted by Key Players
5.5.1. Key Strategies Analysis
5.5.2. Mergers and Acquisitions
5.5.3. Partnerships
5.5.4. Product Launch
5.5.5. Geographical Expansion
5.5.6. Others

6. Economic Impact Analysis
6.1. Recession Impact
6.1.1. North America
6.1.2. Europe
6.1.3. Asia Pacific
6.1.4. Latin America
6.1.5. Middle East and Africa
6.2. Ukraine-Russia War Impact
6.2.1. North America
6.2.2. Europe
6.2.3. Asia Pacific
6.2.4. Latin America
6.2.5. Middle East and Africa
6.3. COVID-19 Impact Analysis
6.3.1. North America
6.3.2. Europe
6.3.3. Asia Pacific
6.3.4. Latin America
6.3.5. Middle East and Africa

7. Global Plant Biotechnology Services Market, By Equipment Type
7.1. Global Plant Biotechnology Services Market Overview, by Equipment Type
7.1.1. Global Plant Biotechnology Services Market Revenue Share, By Equipment Type, 2022 Vs 2030 (in %)
7.2. Pharmaceuticals Industry
7.2.1. Global Plant Biotechnology Services Market, By Region, 2017-2030 (US$ Bn)
7.3. Sequencer
7.3.1. Global Plant Biotechnology Services Market, By Region, 2017-2030 (US$ Bn)
7.4. Temperature Controllers
7.4.1. Global Plant Biotechnology Services Market, By Region, 2017-2030 (US$ Bn)
7.5. Sensors
7.5.1. Global Plant Biotechnology Services Market, By Region, 2017-2030 (US$ Bn)
7.6. Sterilizers
7.6.1. Global Plant Biotechnology Services Market, By Region, 2017-2030 (US$ Bn)
7.7. Centrifuges
7.7.1. Global Plant Biotechnology Services Market, By Region, 2017-2030 (US$ Bn)
7.8. Others
7.8.1. Global Plant Biotechnology Services Market, By Region, 2017-2030 (US$ Bn)

8. Global Plant Biotechnology Services Market, By Application
8.1. Global Plant Biotechnology Services Market Overview, by Application
8.1.1. Global Plant Biotechnology Services Market, By Application, 2022 vs 2030 (in %)
8.2. Soil Handling
8.2.1. Global Plant Biotechnology Services Market, By Region, 2017-2030 (US$ Bn)
8.3. Breeding
8.3.1. Global Plant Biotechnology Services Market, By Region, 2017-2030 (US$ Bn)
8.4. Product Development
8.4.1. Global Plant Biotechnology Services Market, By Region, 2017-2030 (US$ Bn)
8.5. Yield Improvement
8.5.1. Global Plant Biotechnology Services Market, By Region, 2017-2030 (US$ Bn)
8.6. Genetic Modification
8.6.1. Global Plant Biotechnology Services Market, By Region, 2017-2030 (US$ Bn)
8.7. Disease Resistance
8.7.1. Global Plant Biotechnology Services Market, By Region, 2017-2030 (US$ Bn)
8.8. Others
8.8.1. Global Plant Biotechnology Services Market, By Region, 2017-2030 (US$ Bn)

9. Global Plant Biotechnology Services Market, by End User, 2017-2030 (US$ Bn)
9.1. Global Plant Biotechnology Services Market Overview, by End User
9.1.1. Global Plant Biotechnology Services Market, By End User, 2022 vs 2030 (in%)
9.2. Research Institutions
9.2.1. Global Plant Biotechnology Services Market, By Region, 2017-2030 (US$ Bn)
9.3. Pharmaceuticals Industry
9.3.1. Global Plant Biotechnology Services Market, By Region, 2017-2030 (US$ Bn)
9.4. Biotechnology Companies
9.4.1. Global Plant Biotechnology Services Market, By Region, 2017-2030 (US$ Bn)

10. Global Plant Biotechnology Services Market, by Service, 2017-2030 (US$ Bn)
10.1. Global Plant Biotechnology Services Market Overview, by Service
10.1.1. Global Plant Biotechnology Services Market, By Service, 2022 vs 2030 (in%)
10.2. GMO Analysis
10.2.1. Global Plant Biotechnology Services Market, By Region, 2017-2030 (US$ Bn)
10.3. Cellular Imaging
10.3.1. Global Plant Biotechnology Services Market, By Region, 2017-2030 (US$ Bn)
10.4. Analytical Chemistry
10.4.1. Global Plant Biotechnology Services Market, By Region, 2017-2030 (US$ Bn)
10.5. Genomics Services
10.5.1. Global Plant Biotechnology Services Market, By Region, 2017-2030 (US$ Bn)
10.6. Quality Assessment
10.6.1. Global Plant Biotechnology Services Market, By Region, 2017-2030 (US$ Bn)

11. Global Plant Biotechnology Services Market, by Technology, 2017-2030 (US$ Bn)
11.1. Global Plant Biotechnology Services Market Overview, by Technology
11.1.1. Global Plant Biotechnology Services Market, By Technology, 2022 vs 2030 (in%)
11.2. RF Technology
11.2.1. Global Plant Biotechnology Services Market, By Region, 2017-2030 (US$ Bn)
11.3. WIFI Technology
11.3.1. Global Plant Biotechnology Services Market, By Region, 2017-2030 (US$ Bn)
11.4. Imaging Technology
11.4.1. Global Plant Biotechnology Services Market, By Region, 2017-2030 (US$ Bn)
11.5. Bluetooth Technology
11.5.1. Global Plant Biotechnology Services Market, By Region, 2017-2030 (US$ Bn)
11.6. Cloud-Based Technology
11.6.1. Global Plant Biotechnology Services Market, By Region, 2017-2030 (US$ Bn)
11.7. Others
11.7.1. Global Plant Biotechnology Services Market, By Region, 2017-2030 (US$ Bn)

12. Global Plant Biotechnology Services Market, by Crop, 2017-2030 (US$ Bn)
12.1. Global Plant Biotechnology Services Market Overview, by Crop
12.1.1. Global Plant Biotechnology Services Market, By Crop, 2022 vs 2030 (in%)
12.2. Cereals and Grains
12.2.1. Global Plant Biotechnology Services Market, By Region, 2017-2030 (US$ Bn)
12.3. Pharmaceuticals Industry
12.3.1. Global Plant Biotechnology Services Market, By Region, 2017-2030 (US$ Bn)
12.4. Agricultural Companies
12.4.1. Global Plant Biotechnology Services Market, By Region, 2017-2030 (US$ Bn)
12.5. Biotechnology Companies
12.5.1. Global Plant Biotechnology Services Market, By Region, 2017-2030 (US$ Bn)

13. Global Plant Biotechnology Services Market, By Region
13.1. Global Plant Biotechnology Services Market Overview, by Region
13.1.1. Global Plant Biotechnology Services Market, By Region, 2022 vs 2030 (in%)
13.2. Equipment Type
13.2.1. Global Plant Biotechnology Services Market, By Equipment Type, 2017-2030 (US$ Bn)
13.3. Application
13.3.1. Global Plant Biotechnology Services Market, By Application, 2017-2030 (US$ Bn)
13.4. Technology
13.4.1. Global Plant Biotechnology Services Market, By Technology, 2017-2030 (US$ Bn)
13.5. Service
13.5.1. Global Plant Biotechnology Services Market, By Service, 2017-2030 (US$ Bn)
13.6. Technology
13.6.1. Global Plant Biotechnology Services Market, By Technology, 2017-2030 (US$ Bn)
13.7. Crop
13.7.1. Global Plant Biotechnology Services Market, By Crop, 2017-2030 (US$ Bn)

14. North America Plant Biotechnology Services Market Analysis
14.1. North America Plant Biotechnology Services Market, by Equipment Type, 2017-2030(US$ Bn)
14.1.1. Overview
14.1.2. SRC Analysis
14.2. North America Plant Biotechnology Services Market, by Application, 2017-2030(US$ Bn)
14.2.1. Overview
14.2.2. SRC Analysis
14.3. North America Plant Biotechnology Services Market, by Technology, 2017-2030(US$ Bn)
14.3.1. Overview
14.3.2. SRC Analysis
14.4. North America Plant Biotechnology Services Market, by Service, 2017-2030(US$ Bn)
14.4.1. Overview
14.4.2. SRC Analysis
14.5. North America Plant Biotechnology Services Market, by Technology, 2017-2030(US$ Bn)
14.5.1. Overview
14.5.2. SRC Analysis
14.6. North America Plant Biotechnology Services Market, by Crop, 2017-2030(US$ Bn)
14.6.1. Overview
14.6.2. SRC Analysis
14.7. North America Plant Biotechnology Services Market, by Country, 2017-2030 (US$ Bn)
14.7.1. North America Plant Biotechnology Services Market, by Country, 2022 Vs 2030 (in%)
14.7.2. U.S.
14.7.2.1. U.S. Plant Biotechnology Services Market Estimates and Forecast, 2017-2030 (US$ Bn)
14.7.2.2. U.S. Plant Biotechnology Services, By Equipment Type, 2017-2030 (US$ Bn)
14.7.2.3. U.S. Plant Biotechnology Services, By Application, 2017-2030 (US$ Bn)
14.7.2.4. U.S. Plant Biotechnology Services, By Technology, 2017-2030 (US$ Bn)
14.7.2.5. U.S. Plant Biotechnology Services, By Service, 2017-2030 (US$ Bn)
14.7.2.6. U.S. Plant Biotechnology Services, By Technology, 2017-2030 (US$ Bn)
14.7.2.7. U.S. Plant Biotechnology Services, By Crop, 2017-2030 (US$ Bn)
14.7.3. Canada
14.7.3.1. Canada Plant Biotechnology Services Market Estimates and Forecast, 2017-2030 (US$ Bn)
14.7.3.2. Canada Plant Biotechnology Services, By Equipment Type, 2017-2030 (US$ Bn)
14.7.3.3. Canada Plant Biotechnology Services, By Application, 2017-2030 (US$ Bn)
14.7.3.4. Canada Plant Biotechnology Services, By Technology, 2017-2030 (US$ Bn)
14.7.3.5. Canada Plant Biotechnology Services, By Service, 2017-2030 (US$ Bn)
14.7.3.6. Canada Plant Biotechnology Services, By Technology, 2017-2030 (US$ Bn)
14.7.3.7. Canada Plant Biotechnology Services, By Crop, 2017-2030 (US$ Bn)

15. Europe Plant Biotechnology Services Market Analysis
15.1. Europe Plant Biotechnology Services Market, by Equipment Type, 2017-2030(US$ Bn)
15.1.1. Overview
15.1.2. SRC Analysis
15.2. Europe Plant Biotechnology Services Market, by Application, 2017-2030(US$ Bn)
15.2.1. Overview
15.2.2. SRC Analysis
15.3. Europe Plant Biotechnology Services Market, by Technology, 2017-2030(US$ Bn)
15.3.1. Overview
15.3.2. SRC Analysis
15.4. Europe Plant Biotechnology Services Market, by Service, 2017-2030(US$ Bn)
15.4.1. Overview
15.4.2. SRC Analysis
15.5. Europe Plant Biotechnology Services Market, by Technology, 2017-2030(US$ Bn)
15.5.1. Overview
15.5.2. SRC Analysis
15.6. Europe Plant Biotechnology Services Market, by Crop, 2017-2030(US$ Bn)
15.6.1. Overview
15.6.2. SRC Analysis
15.7. Europe Plant Biotechnology Services Market, by Country, 2017-2030 (US$ Bn)
15.7.1. Europe Plant Biotechnology Services Market, by Country, 2022 Vs 2030 (in%)
15.7.2. Germany
15.7.2.1. Germany Plant Biotechnology Services Market Estimates and Forecast, 2017-2030 (US$ Bn)
15.7.2.2. Germany Plant Biotechnology Services, By Equipment Type, 2017-2030 (US$ Bn)
15.7.2.3. Germany Plant Biotechnology Services, By Application, 2017-2030 (US$ Bn)
15.7.2.4. Germany Plant Biotechnology Services, By Technology, 2017-2030 (US$ Bn)
15.7.2.5. Germany Plant Biotechnology Services, By Service, 2017-2030 (US$ Bn)
15.7.2.6. Germany Plant Biotechnology Services, By Technology, 2017-2030 (US$ Bn)
15.7.2.7. Germany Plant Biotechnology Services, By Crop, 2017-2030 (US$ Bn)
15.7.3. France
15.7.3.1. France Plant Biotechnology Services Market Estimates and Forecast, 2017-2030 (US$ Bn)
15.7.3.2. France Plant Biotechnology Services, By Equipment Type, 2017-2030 (US$ Bn)
15.7.3.3. France Plant Biotechnology Services, By Application, 2017-2030 (US$ Bn)
15.7.3.4. France Plant Biotechnology Services, By Technology, 2017-2030 (US$ Bn)
15.7.3.5. France Plant Biotechnology Services, By Service, 2017-2030 (US$ Bn)
15.7.3.6. France Plant Biotechnology Services, By Technology, 2017-2030 (US$ Bn)
15.7.3.7. France Plant Biotechnology Services, By Crop, 2017-2030 (US$ Bn)
15.7.4. UK
15.7.4.1. UK Plant Biotechnology Services Market Estimates and Forecast, 2017-2030 (US$ Bn)
15.7.4.2. UK Plant Biotechnology Services, By Equipment Type, 2017-2030 (US$ Bn)
15.7.4.3. UK Plant Biotechnology Services, By Application, 2017-2030 (US$ Bn)
15.7.4.4. UK Plant Biotechnology Services, By Technology, 2017-2030 (US$ Bn)
15.7.4.5. UK Plant Biotechnology Services, By Service, 2017-2030 (US$ Bn)
15.7.4.6. UK Plant Biotechnology Services, By Technology, 2017-2030 (US$ Bn)
15.7.4.7. UK Plant Biotechnology Services, By Crop, 2017-2030 (US$ Bn)
15.7.5. Italy
15.7.5.1. Italy Plant Biotechnology Services Market Estimates and Forecast, 2017-2030 (US$ Bn)
15.7.5.2. Italy Plant Biotechnology Services, By Equipment Type, 2017-2030 (US$ Bn)
15.7.5.3. Italy Plant Biotechnology Services, By Application, 2017-2030 (US$ Bn)
15.7.5.4. Italy Plant Biotechnology Services, By Technology, 2017-2030 (US$ Bn)
15.7.5.5. Italy Plant Biotechnology Services, By Service, 2017-2030 (US$ Bn)
15.7.5.6. Italy Plant Biotechnology Services, By Technology, 2017-2030 (US$ Bn)
15.7.5.7. Italy Plant Biotechnology Services, By Crop, 2017-2030 (US$ Bn)
15.7.6. Spain
15.7.6.1. Spain Plant Biotechnology Services Market Estimates and Forecast, 2017-2030 (US$ Bn)
15.7.6.2. Spain Plant Biotechnology Services, By Equipment Type, 2017-2030 (US$ Bn)
15.7.6.3. Spain Plant Biotechnology Services, By Application, 2017-2030 (US$ Bn)
15.7.6.4. Spain Plant Biotechnology Services, By Technology, 2017-2030 (US$ Bn)
15.7.6.5. Spain Plant Biotechnology Services, By Service, 2017-2030 (US$ Bn)
15.7.6.6. Spain Plant Biotechnology Services, By Technology, 2017-2030 (US$ Bn)
15.7.6.7. Spain Plant Biotechnology Services, By Crop, 2017-2030 (US$ Bn)
15.7.7. Rest of Europe
15.7.7.1. Rest of Europe Plant Biotechnology Services Market Estimates and Forecast, 2017-2030 (US$ Bn)
15.7.7.2. Rest of Europe Plant Biotechnology Services, By Equipment Type, 2017-2030 (US$ Bn)
15.7.7.3. Rest of Europe Plant Biotechnology Services, By Application, 2017-2030 (US$ Bn)
15.7.7.4. Rest of Europe Plant Biotechnology Services, By Technology, 2017-2030 (US$ Bn)
15.7.7.5. Rest of Europe Plant Biotechnology Services, By Service, 2017-2030 (US$ Bn)
15.7.7.6. Rest of Europe Plant Biotechnology Services, By Technology, 2017-2030 (US$ Bn)
15.7.7.7. Rest of Europe Plant Biotechnology Services, By Crop, 2017-2030 (US$ Bn)

16. Asia Pacific Plant Biotechnology Services Market Analysis
16.1. Asia Pacific Plant Biotechnology Services Market, by Equipment Type, 2017-2030(US$ Bn)
16.1.1. Overview
16.1.2. SRC Analysis
16.2. Asia Pacific Plant Biotechnology Services Market, by Application, 2017-2030(US$ Bn)
16.2.1. Overview
16.2.2. SRC Analysis
16.3. Asia Pacific Plant Biotechnology Services Market, by Technology, 2017-2030(US$ Bn)
16.3.1. Overview
16.3.2. SRC Analysis
16.4. Asia Pacific Plant Biotechnology Services Market, by Service, 2017-2030(US$ Bn)
16.4.1. Overview
16.4.2. SRC Analysis
16.5. Asia Pacific Plant Biotechnology Services Market, by Technology, 2017-2030(US$ Bn)
16.5.1. Overview
16.5.2. SRC Analysis
16.6. Asia Pacific Plant Biotechnology Services Market, by Crop, 2017-2030(US$ Bn)
16.6.1. Overview
16.6.2. SRC Analysis
16.7. Asia Pacific Plant Biotechnology Services Market, by Country, 2017-2030 (US$ Bn)
16.7.1. Asia Pacific Plant Biotechnology Services Market, by Country, 2022 Vs 2030 (in%)
16.7.2. China
16.7.2.1. China Plant Biotechnology Services Market Estimates and Forecast, 2017-2030 (US$ Bn)
16.7.2.2. China Plant Biotechnology Services, By Equipment Type, 2017-2030 (US$ Bn)
16.7.2.3. China Plant Biotechnology Services, By Application, 2017-2030 (US$ Bn)
16.7.2.4. China Plant Biotechnology Services, By Technology, 2017-2030 (US$ Bn)
16.7.2.5. China Plant Biotechnology Services, By Service, 2017-2030 (US$ Bn)
16.7.2.6. China Plant Biotechnology Services, By Technology, 2017-2030 (US$ Bn)
16.7.2.7. China Plant Biotechnology Services, By Crop, 2017-2030 (US$ Bn)
16.7.3. Japan
16.7.3.1. Japan Plant Biotechnology Services Market Estimates and Forecast, 2017-2030 (US$ Bn)
16.7.3.2. Japan Plant Biotechnology Services, By Equipment Type, 2017-2030 (US$ Bn)
16.7.3.3. Japan Plant Biotechnology Services, By Application, 2017-2030 (US$ Bn)
16.7.3.4. Japan Plant Biotechnology Services, By Technology, 2017-2030 (US$ Bn)
16.7.3.5. Japan Plant Biotechnology Services, By Service, 2017-2030 (US$ Bn)
16.7.3.6. Japan Plant Biotechnology Services, By Technology, 2017-2030 (US$ Bn)
16.7.3.7. Japan Plant Biotechnology Services, By Crop, 2017-2030 (US$ Bn)
16.7.4. India
16.7.4.1. India Plant Biotechnology Services Market Estimates and Forecast, 2017-2030 (US$ Bn)
16.7.4.2. India Plant Biotechnology Services, By Equipment Type, 2017-2030 (US$ Bn)
16.7.4.3. India Plant Biotechnology Services, By Application, 2017-2030 (US$ Bn)
16.7.4.4. India Plant Biotechnology Services, By Technology, 2017-2030 (US$ Bn)
16.7.4.5. India Plant Biotechnology Services, By Service, 2017-2030 (US$ Bn)
16.7.4.6. India Plant Biotechnology Services, By Technology, 2017-2030 (US$ Bn)
16.7.4.7. India Plant Biotechnology Services, By Crop, 2017-2030 (US$ Bn)
16.7.5. South Korea
16.7.5.1. South Korea Plant Biotechnology Services Market Estimates and Forecast, 2017-2030 (US$ Bn)
16.7.5.2. South Korea Plant Biotechnology Services, By Equipment Type, 2017-2030 (US$ Bn)
16.7.5.3. South Korea Plant Biotechnology Services, By Application, 2017-2030 (US$ Bn)
16.7.5.4. South Korea Plant Biotechnology Services, By Technology, 2017-2030 (US$ Bn)
16.7.5.5. South Korea Plant Biotechnology Services, By Service, 2017-2030 (US$ Bn)
16.7.5.6. South Korea Plant Biotechnology Services, By Technology, 2017-2030 (US$ Bn)
16.7.5.7. South Korea Plant Biotechnology Services, By Crop, 2017-2030 (US$ Bn)
16.7.6. South-East Asia
16.7.6.1. South-East Asia Plant Biotechnology Services Market Estimates and Forecast, 2017-2030 (US$ Bn)
16.7.6.2. South-East Asia Plant Biotechnology Services, By Equipment Type, 2017-2030 (US$ Bn)
16.7.6.3. South-East Asia Plant Biotechnology Services, By Application, 2017-2030 (US$ Bn)
16.7.6.4. South Korea Plant Biotechnology Services, By Technology, 2017-2030 (US$ Bn)
16.7.6.5. South Korea Plant Biotechnology Services, By Service, 2017-2030 (US$ Bn)
16.7.6.6. South Korea Plant Biotechnology Services, By Technology, 2017-2030 (US$ Bn)
16.7.6.7. South Korea Plant Biotechnology Services, By Crop, 2017-2030 (US$ Bn)
16.7.7. Rest of Asia Pacific
16.7.7.1. Rest of Asia Pacific Plant Biotechnology Services Market Estimates and Forecast, 2017-2030 (US$ Bn)
16.7.7.2. Rest of Asia Pacific Plant Biotechnology Services, By Equipment Type, 2017-2030 (US$ Bn)
16.7.7.3. Rest of Asia Pacific Plant Biotechnology Services, By Application, 2017-2030 (US$ Bn)
16.7.7.4. Rest of Asia Pacific Plant Biotechnology Services, By Technology, 2017-2030 (US$ Bn)
16.7.7.5. Rest of Asia Pacific Plant Biotechnology Services, By Service, 2017-2030 (US$ Bn)
16.7.7.6. Rest of Asia Pacific Plant Biotechnology Services, By Technology, 2017-2030 (US$ Bn)
16.7.7.7. Rest of Asia Pacific Plant Biotechnology Services, By Crop, 2017-2030 (US$ Bn)

17. Latin America Plant Biotechnology Services Market Analysis
17.1. Latin America Plant Biotechnology Services Market, by Equipment Type, 2017-2030(US$ Bn)
17.1.1. Overview
17.1.2. SRC Analysis
17.2. Latin America Plant Biotechnology Services Market, by Application, 2017-2030(US$ Bn)
17.2.1. Overview
17.2.2. SRC Analysis
17.3. Latin America Plant Biotechnology Services Market, by Technology, 2017-2030(US$ Bn)
17.3.1. Overview
17.3.2. SRC Analysis
17.4. Latin America Plant Biotechnology Services Market, by Service, 2017-2030(US$ Bn)
17.4.1. Overview
17.4.2. SRC Analysis
17.5. Latin America Plant Biotechnology Services Market, by Technology, 2017-2030(US$ Bn)
17.5.1. Overview
17.5.2. SRC Analysis
17.6. Latin America Plant Biotechnology Services Market, by Crop, 2017-2030(US$ Bn)
17.6.1. Overview
17.6.2. SRC Analysis
17.7. Latin America Plant Biotechnology Services Market, by Country, 2017-2030 (US$ Bn)
17.7.1. Latin America Plant Biotechnology Services Market, by Country, 2022 Vs 2030 (in%)
17.7.2. Brazil
17.7.2.1. Brazil Plant Biotechnology Services Market Estimates and Forecast, 2017-2030 (US$ Bn)
17.7.2.2. Brazil Plant Biotechnology Services, By Equipment Type, 2017-2030 (US$ Bn)
17.7.2.3. Brazil Plant Biotechnology Services, By Application, 2017-2030 (US$ Bn)
17.7.2.4. Brazil Plant Biotechnology Services, By Technology, 2017-2030 (US$ Bn)
17.7.2.5. Brazil Plant Biotechnology Services, By Service, 2017-2030 (US$ Bn)
17.7.2.6. Brazil Plant Biotechnology Services, By Technology, 2017-2030 (US$ Bn)
17.7.2.7. Brazil Plant Biotechnology Services, By Crop, 2017-2030 (US$ Bn)
17.7.3. Mexico
17.7.3.1. Mexico Plant Biotechnology Services Market Estimates and Forecast, 2017-2030 (US$ Bn)
17.7.3.2. Mexico Plant Biotechnology Services, By Equipment Type, 2017-2030 (US$ Bn)
17.7.3.3. Mexico Plant Biotechnology Services, By Application, 2017-2030 (US$ Bn)
17.7.3.4. Mexico Plant Biotechnology Services, By Technology, 2017-2030 (US$ Bn)
17.7.3.5. Mexico Plant Biotechnology Services, By Service, 2017-2030 (US$ Bn)
17.7.3.6. Mexico Plant Biotechnology Services, By Technology, 2017-2030 (US$ Bn)
17.7.3.7. Mexico Plant Biotechnology Services, By Crop, 2017-2030 (US$ Bn)
17.7.4. Rest of Latin America
17.7.4.1. Rest of Latin America Plant Biotechnology Services Market Estimates and Forecast, 2017-2030 (US$ Bn)
17.7.4.2. Rest of Latin America Plant Biotechnology Services, By Equipment Type, 2017-2030 (US$ Bn)
17.7.4.3. Rest of Latin America Plant Biotechnology Services, By Application, 2017-2030 (US$ Bn)
17.7.4.4. Rest of Latin America Plant Biotechnology Services, By Technology, 2017-2030 (US$ Bn)
17.7.4.5. Rest of Latin America Plant Biotechnology Services, By Service, 2017-2030 (US$ Bn)
17.7.4.6. Rest of Latin America Plant Biotechnology Services, By Technology, 2017-2030 (US$ Bn)
17.7.4.7. Rest of Latin America Plant Biotechnology Services, By Crop, 2017-2030 (US$ Bn)

18. Middle East and Africa Plant Biotechnology Services Market Analysis
18.1. Middle East and Africa Plant Biotechnology Services Market, by Equipment Type, 2017-2030(US$ Bn)
18.1.1. Overview
18.1.2. SRC Analysis
18.2. Middle East and Africa Plant Biotechnology Services Market, by Application, 2017-2030(US$ Bn)
18.2.1. Overview
18.2.2. SRC Analysis
18.3. Middle East and Africa Plant Biotechnology Services Market, by Technology, 2017-2030(US$ Bn)
18.3.1. Overview
18.3.2. SRC Analysis
18.4. Middle East and Africa Plant Biotechnology Services Market, by Service, 2017-2030(US$ Bn)
18.4.1. Overview
18.4.2. SRC Analysis
18.5. Middle East and Africa Plant Biotechnology Services Market, by Technology, 2017-2030(US$ Bn)
18.5.1. Overview
18.5.2. SRC Analysis
18.6. Middle East and Africa Plant Biotechnology Services Market, by Crop, 2017-2030(US$ Bn)
18.6.1. Overview
18.6.2. SRC Analysis
18.7. Middle East and Africa Plant Biotechnology Services Market, by Country, 2017-2030 (US$ Bn)
18.7.1. Middle East and Africa Plant Biotechnology Services Market, by Country, 2022 Vs 2030 (in%)
18.7.2. GCC Countries
18.7.2.1. GCC Countries Plant Biotechnology Services Market Estimates and Forecast, 2017-2030 (US$ Bn)
18.7.2.2. GCC Countries Plant Biotechnology Services, By Equipment Type, 2017-2030 (US$ Bn)
18.7.2.3. GCC Countries Plant Biotechnology Services, By Application, 2017-2030 (US$ Bn)
18.7.2.4. GCC Countries Plant Biotechnology Services, By Technology, 2017-2030 (US$ Bn)
18.7.2.5. GCC Plant Biotechnology Services, By Service, 2017-2030 (US$ Bn)
18.7.2.6. GCC Countries Plant Biotechnology Services, By Technology, 2017-2030 (US$ Bn)
18.7.2.7. GCC Plant Biotechnology Services, By Crop, 2017-2030 (US$ Bn)
18.7.3. South Africa
18.7.3.1. South Africa Plant Biotechnology Services Market Estimates and Forecast, 2017-2030 (US$ Bn)
18.7.3.2. South Africa Plant Biotechnology Services, By Equipment Type, 2017-2030 (US$ Bn)
18.7.3.3. South Africa Plant Biotechnology Services, By Application, 2017-2030 (US$ Bn)
18.7.3.4. South Africa Plant Biotechnology Services, By Technology, 2017-2030 (US$ Bn)
18.7.3.5. South Africa Plant Biotechnology Services, By Service, 2017-2030 (US$ Bn)
18.7.3.6. South Africa Plant Biotechnology Services, By Technology, 2017-2030 (US$ Bn)
18.7.3.7. South Africa Plant Biotechnology Services, By Crop, 2017-2030 (US$ Bn)
18.7.4. Rest of Middle East and Africa
18.7.4.1. Rest of Middle East and Africa Plant Biotechnology Services Market Estimates and Forecast, 2017-2030 (US$ Bn)
18.7.4.2. Rest of Middle East and Africa Plant Biotechnology Services, By Equipment Type, 2017-2030 (US$ Bn)
18.7.4.3. Rest of Middle East and Africa Plant Biotechnology Services, By Application, 2017-2030 (US$ Bn)
18.7.4.4. Rest of Middle East and Africa Plant Biotechnology Services, By Technology, 2017-2030 (US$ Bn)
18.7.4.5. Rest of Middle East and Africa Plant Biotechnology Services, By Service, 2017-2030 (US$ Bn)
18.7.4.6. Rest of Middle East and Africa Plant Biotechnology Services, By Technology, 2017-2030 (US$ Bn)
18.7.4.7. Rest of Middle East and Africa Plant Biotechnology Services, By Crop, 2017-2030 (US$ Bn)

19. Company Profiles
19.1. Thermo Fisher Scientific Inc.
19.1.1. Company Overview
19.1.2. Technology/Services Portfolio
19.1.3. Geographical Presence
19.1.4. Financial Summary
19.1.4.1. Market Revenue and Net Profit (2019-2022)
19.1.4.2. Business Segment Revenue Analysis
19.1.4.3. Geographical Revenue Analysis
19.2. Agilent Technologies, Inc.
19.3. Eurofins Scientific SE
19.4. GenScript Biotech Corporation

List of Figures
FIG. 1 Global Plant Biotechnology Services Market: Research Methodology
FIG. 2 Market Size Estimation – Top Down & Bottom up Approach
FIG. 3 Global Plant Biotechnology Services Market Segment
FIG. 4 Global Plant Biotechnology Services Market, by Equipment Type, 2022 (US$ Bn)
FIG. 5 Global Plant Biotechnology Services Market, by Application, 2022 (US$ Bn)
FIG. 6 Global Plant Biotechnology Services Market, by Technology, 2022 (US$ Bn)
FIG. 7 Global Plant Biotechnology Services Market, by Service, 2022 (US$ Bn)
FIG. 8 Global Plant Biotechnology Services Market, by Technology, 2022 (US$ Bn)
FIG. 9 Global Plant Biotechnology Services Market, by Crop, 2022 (US$ Bn)
FIG. 10 Global Plant Biotechnology Services Market, by Geography, 2022 (US$ Bn)
FIG. 11 Attractive Investment Proposition, by Equipment Type, 2022
FIG. 12 Attractive Investment Proposition, by Application, 2022
FIG. 13 Attractive Investment Proposition, by Technology, 2022
FIG. 14 Attractive Investment Proposition, by Service, 2022
FIG. 15 Attractive Investment Proposition, by Technology, 2022
FIG. 16 Attractive Investment Proposition, by Crop, 2022
FIG. 17 Attractive Investment Proposition, by Geography, 2022
FIG. 18 Global Market Share Analysis of Key Plant Biotechnology Services Market Manufacturers, 2022
FIG. 19 Global Market Positioning of Key Plant Biotechnology Services Market Manufacturers, 2022
FIG. 20 Global Plant Biotechnology Services Market Value Contribution, By Equipment Type, 2022 & 2030 (Value %)
FIG. 21 Global Plant Biotechnology Services Market, by Pharmaceuticals Industry, Value, 2017-2030 (US$ Bn)
FIG. 22 Global Plant Biotechnology Services Market, by Sequencer, Value, 2017-2030 (US$ Bn)
FIG. 23 Global Plant Biotechnology Services Market, by Temperature Controllers, Value, 2017-2030 (US$ Bn)
FIG. 24 Global Plant Biotechnology Services Market, by Sensors, Value, 2017-2030 (US$ Bn)
FIG. 25 Global Plant Biotechnology Services Market, by Sterilizers, Value, 2017-2030 (US$ Bn)
FIG. 26 Global Plant Biotechnology Services Market, by Centrifuges, Value, 2017-2030 (US$ Bn)
FIG. 27 Global Plant Biotechnology Services Market, by Others, Value, 2017-2030 (US$ Bn)
FIG. 28 Global Plant Biotechnology Services Market Value Contribution, By Application, 2022 & 2030 (Value %)
FIG. 29 Global Plant Biotechnology Services Market, by Soil Handling, Value, 2017-2030 (US$ Bn)
FIG. 30 Global Plant Biotechnology Services Market, by Breeding, 2017-2030 (US$ Bn)
FIG. 31 Global Plant Biotechnology Services Market, by Product Development, 2017-2030 (US$ Bn)
FIG. 32 Global Plant Biotechnology Services Market, by Yield Improvement, 2017-2030 (US$ Bn)
FIG. 33 Global Plant Biotechnology Services Market, by Genetic Modification, 2017-2030 (US$ Bn)
FIG. 34 Global Plant Biotechnology Services Market, by Disease Resistance, 2017-2030 (US$ Bn)
FIG. 35 Global Plant Biotechnology Services Market, by Others, 2017-2030 (US$ Bn)
FIG. 36 Global Plant Biotechnology Services Market Value Contribution, By End User, 2022 & 2030 (Value %)
FIG. 37 Global Plant Biotechnology Services Market, by Research Institutions, Value, 2017-2030 (US$ Bn)
FIG. 38 Global Plant Biotechnology Services Market, by Pharmaceuticals Industry, 2017-2030 (US$ Bn)
FIG. 39 Global Plant Biotechnology Services Market, by Biotechnology Companies, Value, 2017-2030 (US$ Bn)
FIG. 40 Global Plant Biotechnology Services Market Value Contribution, By Service, 2022 & 2030 (Value %)
FIG. 41 Global Plant Biotechnology Services Market, by GMO Analysis, Value, 2017-2030 (US$ Bn)
FIG. 42 Global Plant Biotechnology Services Market, by Cellular Imaging, 2017-2030 (US$ Bn)
FIG. 43 Global Plant Biotechnology Services Market, by Analytical Chemistry, 2017-2030 (US$ Bn)
FIG. 44 Global Plant Biotechnology Services Market, by Genomics Services, 2017-2030 (US$ Bn)
FIG. 45 Global Plant Biotechnology Services Market, by Quality Assessment, 2017-2030 (US$ Bn)
FIG. 46 Global Plant Biotechnology Services Market Value Contribution, By Technology, 2022 & 2030 (Value %)
FIG. 47 Global Plant Biotechnology Services Market, by RF Technology, 2017-2030 (US$ Bn)
FIG. 48 Global Plant Biotechnology Services Market, by WIFI Technology, 2017-2030 (US$ Bn)
FIG. 49 Global Plant Biotechnology Services Market, by Imaging Technology, 2017-2030 (US$ Bn)
FIG. 50 Global Plant Biotechnology Services Market, by Bluetooth Technology, 2017-2030 (US$ Bn)
FIG. 51 Global Plant Biotechnology Services Market, by Cloud-Based Technology, 2017-2030 (US$ Bn)
FIG. 52 Global Plant Biotechnology Services Market Value Contribution, By Crop, 2022 & 2030 (Value %)
FIG. 53 Global Plant Biotechnology Services Market, by Cereals and Grains, 2017-2030 (US$ Bn)
FIG. 54 Global Plant Biotechnology Services Market, by Pharmaceuticals Industry, 2017-2030 (US$ Bn)
FIG. 55 Global Plant Biotechnology Services Market, by Agricultural Companies, 2017-2030 (US$ Bn)
FIG. 56 Global Plant Biotechnology Services Market, by Others, 2017-2030 (US$ Bn)
FIG. 57 North America Plant Biotechnology Services Market, 2017-2030 (US$ Bn)
FIG. 58 North America Plant Biotechnology Services Market, 2017-2030 (US$ Bn)
FIG. 59 U.S. Plant Biotechnology Services Market, 2017-2030 (US$ Bn)
FIG. 60 Canada Plant Biotechnology Services Market, 2017-2030 (US$ Bn)
FIG. 61 Europe Plant Biotechnology Services Market, 2017-2030 (US$ Bn)
FIG. 62 Germany Plant Biotechnology Services Market, 2017-2030 (US$ Bn)
FIG. 63 France Plant Biotechnology Services Market, 2017-2030 (US$ Bn)
FIG. 64 U.K. Plant Biotechnology Services Market, 2017-2030 (US$ Bn)
FIG. 65 Italy Plant Biotechnology Services Market, 2017-2030 (US$ Bn)
FIG. 66 Spain Plant Biotechnology Services Market, 2017-2030 (US$ Bn)
FIG. 67 Rest of Europe Plant Biotechnology Services Market, 2017-2030 (US$ Bn)
FIG. 68 Asia Pacific Plant Biotechnology Services Market, 2017-2030 (US$ Bn)
FIG. 69 China Plant Biotechnology Services Market, 2017-2030 (US$ Bn)
FIG. 70 Japan Plant Biotechnology Services Market, 2017-2030 (US$ Bn)
FIG. 71 India Plant Biotechnology Services Market, 2017-2030 (US$ Bn)
FIG. 72 South Korea Plant Biotechnology Services Market, 2017-2030 (US$ Bn)
FIG. 73 South-East Asia Plant Biotechnology Services Market, 2017-2030 (US$ Bn)
FIG. 74 Rest of Asia Pacific Plant Biotechnology Services Market, 2017-2030 (US$ Bn)
FIG. 75 Latin America Plant Biotechnology Services Market, 2017-2030 (US$ Bn)
FIG. 76 Brazil Plant Biotechnology Services Market, 2017-2030 (US$ Bn)
FIG. 77 Mexico Plant Biotechnology Services Market, 2017-2030 (US$ Bn)
FIG. 78 Rest of Latin America Plant Biotechnology Services Market, 2017-2030 (US$ Bn)
FIG. 79 Middle East & Africa Plant Biotechnology Services Market, 2017-2030 (US$ Bn)
FIG. 80 GCC Countries Plant Biotechnology Services Market, 2017-2030 (US$ Bn)
FIG. 81 South Africa Plant Biotechnology Services Market, 2017-2030 (US$ Bn)
FIG. 82 Rest of Middle East and Africa Plant Biotechnology Services Market, 2017-2030 (US$ Bn)

List of Tables
TABLE 1 Market Snapshot: Global Plant Biotechnology Services Market
TABLE 2 Global Plant Biotechnology Services Market: Market Drivers Impact Analysis
TABLE 3 Global Plant Biotechnology Services Market: Market Restraints Impact Analysis
TABLE 4 Global Plant Biotechnology Services Market, by Competitive Benchmarking, 2022
TABLE 5 Global Plant Biotechnology Services Market, by Geographical Presence Analysis, 2022
TABLE 6 Global Plant Biotechnology Services Market, by Key Strategies Analysis, 2022
TABLE 7 Global Plant Biotechnology Services Market, by Pharmaceuticals Industry, By Region, 2017-2022 (US$ Bn)
TABLE 8 Global Plant Biotechnology Services Market, by Pharmaceuticals Industry, By Region, 2023-2030 (US$ Bn)
TABLE 9 Global Plant Biotechnology Services Market, by Sequencer, By Region, 2017-2022 (US$ Bn)
TABLE 10 Global Plant Biotechnology Services Market, by Sequencer, By Region, 2023-2030 (US$ Bn)
TABLE 11 Global Plant Biotechnology Services Market, by Temperature Controllers, By Region, 2017-2022 (US$ Bn)
TABLE 12 Global Plant Biotechnology Services Market, by Temperature Controllers, By Region, 2023-2030 (US$ Bn)
TABLE 13 Global Plant Biotechnology Services Market, by Sensors, By Region, 2017-2022 (US$ Bn)
TABLE 14 Global Plant Biotechnology Services Market, by Sensors, By Region, 2023-2030 (US$ Bn)
TABLE 15 Global Plant Biotechnology Services Market, by Sterilizers, By Region, 2017-2022 (US$ Bn)
TABLE 16 Global Plant Biotechnology Services Market, by Sterilizers, By Region, 2023-2030 (US$ Bn)
TABLE 17 Global Plant Biotechnology Services Market, by Centrifuges, By Region, 2017-2022 (US$ Bn)
TABLE 18 Global Plant Biotechnology Services Market, by Centrifuges, By Region, 2023-2030 (US$ Bn)
TABLE 19 Global Plant Biotechnology Services Market, by Others, By Region, 2017-2022 (US$ Bn)
TABLE 20 Global Plant Biotechnology Services Market, by Others, By Region, 2023-2030 (US$ Bn)
TABLE 21 Global Plant Biotechnology Services Market, by Soil Handling, By Region, 2017-2022 (US$ Bn)
TABLE 22 Global Plant Biotechnology Services Market, by Soil Handling, By Region, 2023-2030 (US$ Bn)
TABLE 23 Global Plant Biotechnology Services Market, by Breeding, By Region, 2017-2022 (US$ Bn)
TABLE 24 Global Plant Biotechnology Services Market, by Breeding, By Region, 2023-2030 (US$ Bn)
TABLE 25 Global Plant Biotechnology Services Market, by Product Development, By Region, 2017-2022 (US$ Bn)
TABLE 26 Global Plant Biotechnology Services Market, by Product Development, By Region, 2023-2030 (US$ Bn)
TABLE 27 Global Plant Biotechnology Services Market, by Yield Improvement, By Region, 2017-2022 (US$ Bn)
TABLE 28 Global Plant Biotechnology Services Market, by Yield Improvement, By Region, 2023-2030 (US$ Bn)
TABLE 29 Global Plant Biotechnology Services Market, by Genetic Modification, By Region, 2017-2022 (US$ Bn)
TABLE 30 Global Plant Biotechnology Services Market, by Genetic Modification, By Region, 2023-2030 (US$ Bn)
TABLE 31 Global Plant Biotechnology Services Market, by Disease Resistance, By Region, 2017-2022 (US$ Bn)
TABLE 32 Global Plant Biotechnology Services Market, by Disease Resistance, By Region, 2023-2030 (US$ Bn)
TABLE 33 Global Plant Biotechnology Services Market, by Others, By Region, 2017-2022 (US$ Bn)
TABLE 34 Global Plant Biotechnology Services Market, by Others, By Region, 2023-2030 (US$ Bn)
TABLE 35 Global Plant Biotechnology Services Market, by Research Institutions, By Region, 2017-2022 (US$ Bn)
TABLE 36 Global Plant Biotechnology Services Market, by Research Institutions, By Region, 2023-2030 (US$ Bn)
TABLE 37 Global Plant Biotechnology Services Market, by Pharmaceuticals Industry, By Region, 2017-2022 (US$ Bn)
TABLE 38 Global Plant Biotechnology Services Market, by Pharmaceuticals Industry, By Region, 2023-2030 (US$ Bn)
TABLE 39 Global Plant Biotechnology Services Market, by Biotechnology Companies, By Region, 2017-2022 (US$ Bn)
TABLE 40 Global Plant Biotechnology Services Market, by Biotechnology Companies, By Region, 2023-2030 (US$ Bn)
TABLE 41 Global Plant Biotechnology Services Market, by GMO Analysis, By Region, 2017-2022 (US$ Bn)
TABLE 42 Global Plant Biotechnology Services Market, by GMO Analysis, By Region, 2023-2030 (US$ Bn)
TABLE 43 Global Plant Biotechnology Services Market, by Cellular Imaging, By Region, 2017-2022 (US$ Bn)
TABLE 44 Global Plant Biotechnology Services Market, by Cellular Imaging, By Region, 2023-2030 (US$ Bn)
TABLE 45 Global Plant Biotechnology Services Market, by Analytical Chemistry, By Region, 2017-2022 (US$ Bn)
TABLE 46 Global Plant Biotechnology Services Market, by Analytical Chemistry, By Region, 2023-2030 (US$ Bn)
TABLE 47 Global Plant Biotechnology Services Market, by Genomics Services, By Region, 2017-2022 (US$ Bn)
TABLE 48 Global Plant Biotechnology Services Market, by Genomics Services, By Region, 2023-2030 (US$ Bn)
TABLE 49 Global Plant Biotechnology Services Market, by Quality Assessment, By Region, 2017-2022 (US$ Bn)
TABLE 50 Global Plant Biotechnology Services Market, by Quality Assessment, By Region, 2023-2030 (US$ Bn)
TABLE 51 Global Plant Biotechnology Services Market, by RF Technology, By Region, 2017-2022 (US$ Bn)
TABLE 52 Global Plant Biotechnology Services Market, by RF Technology, By Region, 2023-2030 (US$ Bn)
TABLE 53 Global Plant Biotechnology Services Market, by WIFI Technology, By Region, 2017-2022 (US$ Bn)
TABLE 54 Global Plant Biotechnology Services Market, by WIFI Technology, By Region, 2023-2030 (US$ Bn)
TABLE 55 Global Plant Biotechnology Services Market, by Imaging Technology, By Region, 2017-2022 (US$ Bn)
TABLE 56 Global Plant Biotechnology Services Market, by Imaging Technology, By Region, 2023-2030 (US$ Bn)
TABLE 57 Global Plant Biotechnology Services Market, by Bluetooth Technology, By Region, 2017-2022 (US$ Bn)
TABLE 58 Global Plant Biotechnology Services Market, by Bluetooth Technology, By Region, 2023-2030 (US$ Bn)
TABLE 59 Global Plant Biotechnology Services Market, by Cloud-Based Technology, By Region, 2017-2022 (US$ Bn)
TABLE 60 Global Plant Biotechnology Services Market, by Cloud-Based Technology, By Region, 2023-2030 (US$ Bn)
TABLE 61 Global Plant Biotechnology Services Market, by Others, By Region, 2017-2022 (US$ Bn)
TABLE 62 Global Plant Biotechnology Services Market, by Others, By Region, 2023-2030 (US$ Bn)
TABLE 63 Global Plant Biotechnology Services Market, by Cereals and Grains, By Region, 2017-2022 (US$ Bn)
TABLE 64 Global Plant Biotechnology Services Market, by Cereals and Grains, By Region, 2023-2030 (US$ Bn)
TABLE 65 Global Plant Biotechnology Services Market, by Pharmaceuticals Industry, By Region, 2017-2022 (US$ Bn)
TABLE 66 Global Plant Biotechnology Services Market, by Pharmaceuticals Industry, By Region, 2023-2030 (US$ Bn)
TABLE 67 Global Plant Biotechnology Services Market, by Agricultural Companies, By Region, 2017-2022 (US$ Bn)
TABLE 68 Global Plant Biotechnology Services Market, by Agricultural Companies, By Region, 2023-2030 (US$ Bn)
TABLE 69 Global Plant Biotechnology Services Market, by Biotechnology Companies, By Region, 2017-2022 (US$ Bn)
TABLE 70 Global Plant Biotechnology Services Market, by Biotechnology Companies, By Region, 2023-2030 (US$ Bn)
TABLE 71 Global Plant Biotechnology Services Market, by Others, By Region, 2017-2022 (US$ Bn)
TABLE 72 Global Plant Biotechnology Services Market, by Others, By Region, 2023-2030 (US$ Bn)
TABLE 73 Global Plant Biotechnology Services Market, by Region, 2017-2022 (US$ Bn)
TABLE 74 Global Plant Biotechnology Services Market, by Region, 2023-2030 (US$ Bn)
TABLE 75 North America Plant Biotechnology Services Market, by Equipment Type, 2017-2022 (US$ Bn)
TABLE 76 North America Plant Biotechnology Services Market, by Equipment Type, 2023-2030 (US$ Bn)
TABLE 77 North America Plant Biotechnology Services Market, by Application, 2017-2022 (US$ Bn)
TABLE 78 North America Plant Biotechnology Services Market, by Application, 2023-2030 (US$ Bn)
TABLE 79 North America Plant Biotechnology Services Market, by Technology, 2017-2022 (US$ Bn)
TABLE 80 North America Plant Biotechnology Services Market, by Technology, 2023-2030 (US$ Bn)
TABLE 81 North America Plant Biotechnology Services Market, by Service, 2017-2022 (US$ Bn)
TABLE 82 North America Plant Biotechnology Services Market, by Service, 2023-2030 (US$ Bn)
TABLE 83 North America Plant Biotechnology Services Market, by Technology, 2017-2022 (US$ Bn)
TABLE 84 North America Plant Biotechnology Services Market, by Technology, 2023-2030 (US$ Bn)
TABLE 85 North America Plant Biotechnology Services Market, by Crop, 2017-2022 (US$ Bn)
TABLE 86 North America Plant Biotechnology Services Market, by Crop, 2023-2030 (US$ Bn)
TABLE 87 North America Plant Biotechnology Services Market, by Country, 2017-2022 (US$ Bn)
TABLE 88 North America Plant Biotechnology Services Market, by Country, 2023-2030 (US$ Bn)
TABLE 89 United States Plant Biotechnology Services Market, by Equipment Type, 2017-2022 (US$ Bn)
TABLE 90 United States Plant Biotechnology Services Market, by Equipment Type, 2023-2030 (US$ Bn)
TABLE 91 United States Plant Biotechnology Services Market, by Application, 2017-2022 (US$ Bn)
TABLE 92 United States Plant Biotechnology Services Market, by Application, 2023-2030 (US$ Bn)
TABLE 93 United States Plant Biotechnology Services Market, by Technology, 2017-2022 (US$ Bn)
TABLE 94 United States Plant Biotechnology Services Market, by Technology, 2023-2030 (US$ Bn)
TABLE 95 United States Plant Biotechnology Services Market, by Service, 2017-2022 (US$ Bn)
TABLE 96 United States Plant Biotechnology Services Market, by Service, 2023-2030 (US$ Bn)
TABLE 97 United States Plant Biotechnology Services Market, by Technology, 2017-2022 (US$ Bn)
TABLE 98 United States Plant Biotechnology Services Market, by Technology, 2023-2030 (US$ Bn)
TABLE 99 United States Plant Biotechnology Services Market, by Crop, 2017-2022 (US$ Bn)
TABLE 100 United States Plant Biotechnology Services Market, by Crop, 2023-2030 (US$ Bn)
TABLE 101 Canada Plant Biotechnology Services Market, by Equipment Type, 2017-2022 (US$ Bn)
TABLE 102 Canada Plant Biotechnology Services Market, by Equipment Type, 2023-2030 (US$ Bn)
TABLE 103 Canada Plant Biotechnology Services Market, by Application, 2017-2022 (US$ Bn)
TABLE 104 Canada Plant Biotechnology Services Market, by Application, 2023-2030 (US$ Bn)
TABLE 105 Canada Plant Biotechnology Services Market, by Crop, 2017-2022 (US$ Bn)
TABLE 106 Canada Plant Biotechnology Services Market, by Crop, 2023-2030 (US$ Bn)
TABLE 107 Canada Plant Biotechnology Services Market, by Service, 2017-2022 (US$ Bn)
TABLE 108 Canada Plant Biotechnology Services Market, by Service, 2023-2030 (US$ Bn)
TABLE 109 Canada Plant Biotechnology Services Market, by Application, 2017-2022 (US$ Bn)
TABLE 110 Canada Plant Biotechnology Services Market, by Application, 2023-2030 (US$ Bn)
TABLE 111 Canada Plant Biotechnology Services Market, by Technology, 2017-2022 (US$ Bn)
TABLE 112 Canada Plant Biotechnology Services Market, by Technology, 2023-2030 (US$ Bn)
TABLE 113 Canada Plant Biotechnology Services Market, by Crop, 2017-2022 (US$ Bn)
TABLE 114 Canada Plant Biotechnology Services Market, by Crop, 2023-2030 (US$ Bn)
TABLE 115 Europe Plant Biotechnology Services Market, by Equipment Type, 2017-2022 (US$ Bn)
TABLE 116 Europe Plant Biotechnology Services Market, by Equipment Type, 2023-2030 (US$ Bn)
TABLE 117 Europe Plant Biotechnology Services Market, by Application, 2017-2022 (US$ Bn)
TABLE 118 Europe Plant Biotechnology Services Market, by Application, 2023-2030 (US$ Bn)
TABLE 119 Europe Plant Biotechnology Services Market, by Technology, 2017-2022 (US$ Bn)
TABLE 120 Europe Plant Biotechnology Services Market, by Technology, 2023-2030 (US$ Bn)
TABLE 121 Europe Plant Biotechnology Services Market, by Service, 2017-2022 (US$ Bn)
TABLE 122 Europe Plant Biotechnology Services Market, by Service, 2023-2030 (US$ Bn)
TABLE 123 Europe Plant Biotechnology Services Market, by Application, 2017-2022 (US$ Bn)
TABLE 124 Europe Plant Biotechnology Services Market, by Application, 2023-2030 (US$ Bn)
TABLE 125 Europe Plant Biotechnology Services Market, by Technology, 2017-2022 (US$ Bn)
TABLE 126 Europe Plant Biotechnology Services Market, by Technology, 2023-2030 (US$ Bn)
TABLE 127 Europe Plant Biotechnology Services Market, by Crop, 2017-2022 (US$ Bn)
TABLE 128 Europe Plant Biotechnology Services Market, by Crop, 2023-2030 (US$ Bn)
TABLE 129 Europe Plant Biotechnology Services Market, by Country, 2017-2022 (US$ Bn)
TABLE 130 Europe Plant Biotechnology Services Market, by Country, 2023-2030 (US$ Bn)
TABLE 131 Germany Plant Biotechnology Services Market, by Equipment Type, 2017-2022 (US$ Bn)
TABLE 132 Germany Plant Biotechnology Services Market, by Equipment Type, 2023-2030 (US$ Bn)
TABLE 133 Germany Plant Biotechnology Services Market, by Application, 2017-2022 (US$ Bn)
TABLE 134 Germany Plant Biotechnology Services Market, by Application, 2023-2030 (US$ Bn)
TABLE 135 Germany Plant Biotechnology Services Market, by Technology, 2017-2022 (US$ Bn)
TABLE 136 Germany Plant Biotechnology Services Market, by Technology, 2023-2030 (US$ Bn)
TABLE 137 Germany Plant Biotechnology Services Market, by Service, 2017-2022 (US$ Bn)
TABLE 138 Germany Plant Biotechnology Services Market, by Service, 2023-2030 (US$ Bn)
TABLE 139 Germany Plant Biotechnology Services Market, by Application, 2017-2022 (US$ Bn)
TABLE 140 Germany Plant Biotechnology Services Market, by Application, 2023-2030 (US$ Bn)
TABLE 141 Germany Plant Biotechnology Services Market, by Technology, 2017-2022 (US$ Bn)
TABLE 142 Germany Plant Biotechnology Services Market, by Technology, 2023-2030 (US$ Bn)
TABLE 143 Germany Plant Biotechnology Services Market, by Crop, 2017-2022 (US$ Bn)
TABLE 144 Germany Plant Biotechnology Services Market, by Crop, 2023-2030 (US$ Bn)
TABLE 145 France Plant Biotechnology Services Market, by Equipment Type, 2017-2022 (US$ Bn)
TABLE 146 France Plant Biotechnology Services Market, by Equipment Type, 2023-2030 (US$ Bn)
TABLE 147 France Plant Biotechnology Services Market, by Application, 2017-2022 (US$ Bn)
TABLE 148 France Plant Biotechnology Services Market, by Application, 2023-2030 (US$ Bn)
TABLE 149 France Plant Biotechnology Services Market, by Technology, 2017-2022 (US$ Bn)
TABLE 150 France Plant Biotechnology Services Market, by Technology, 2023-2030 (US$ Bn)
TABLE 151 France Plant Biotechnology Services Market, by Service, 2017-2022 (US$ Bn)
TABLE 152 France Plant Biotechnology Services Market, by Service, 2023-2030 (US$ Bn)
TABLE 153 France Plant Biotechnology Services Market, by Application, 2017-2022 (US$ Bn)
TABLE 154 France Plant Biotechnology Services Market, by Application, 2023-2030 (US$ Bn)
TABLE 155 France Plant Biotechnology Services Market, by Technology, 2017-2022 (US$ Bn)
TABLE 156 France Plant Biotechnology Services Market, by Technology, 2023-2030 (US$ Bn)
TABLE 157 France Plant Biotechnology Services Market, by Crop, 2017-2022 (US$ Bn)
TABLE 158 France Plant Biotechnology Services Market, by Crop, 2023-2030 (US$ Bn)
TABLE 159 United Kingdom Plant Biotechnology Services Market, by Equipment Type, 2017-2022 (US$ Bn)
TABLE 160 United Kingdom Plant Biotechnology Services Market, by Equipment Type, 2023-2030 (US$ Bn)
TABLE 161 United Kingdom Plant Biotechnology Services Market, by Application, 2017-2022 (US$ Bn)
TABLE 162 United Kingdom Plant Biotechnology Services Market, by Application, 2023-2030 (US$ Bn)
TABLE 163 United Kingdom Plant Biotechnology Services Market, by Technology, 2017-2022 (US$ Bn)
TABLE 164 United Kingdom Plant Biotechnology Services Market, by Technology, 2023-2030 (US$ Bn)
TABLE 165 United Kingdom Plant Biotechnology Services Market, by Service, 2017-2022 (US$ Bn)
TABLE 166 United Kingdom Plant Biotechnology Services Market, by Service, 2023-2030 (US$ Bn)
TABLE 167 United Kingdom Plant Biotechnology Services Market, by Application, 2017-2022 (US$ Bn)
TABLE 168 United Kingdom Plant Biotechnology Services Market, by Application, 2023-2030 (US$ Bn)
TABLE 169 United Kingdom Plant Biotechnology Services Market, by Technology, 2017-2022 (US$ Bn)
TABLE 170 United Kingdom Plant Biotechnology Services Market, by Technology, 2023-2030 (US$ Bn)
TABLE 171 United Kingdom Plant Biotechnology Services Market, by Crop, 2017-2022 (US$ Bn)
TABLE 172 United Kingdom Plant Biotechnology Services Market, by Crop, 2023-2030 (US$ Bn)
TABLE 173 Italy Plant Biotechnology Services Market, by Equipment Type, 2017-2022 (US$ Bn)
TABLE 174 Italy Plant Biotechnology Services Market, by Equipment Type, 2023-2030 (US$ Bn)
TABLE 175 Italy Plant Biotechnology Services Market, by Application, 2017-2022 (US$ Bn)
TABLE 176 Italy Plant Biotechnology Services Market, by Application, 2023-2030 (US$ Bn)
TABLE 177 Italy Plant Biotechnology Services Market, by Technology, 2017-2022 (US$ Bn)
TABLE 178 Italy Plant Biotechnology Services Market, by Technology, 2023-2030 (US$ Bn)
TABLE 179 Italy Plant Biotechnology Services Market, by Service, 2017-2022 (US$ Bn)
TABLE 180 Italy Plant Biotechnology Services Market, by Service, 2023-2030 (US$ Bn)
TABLE 181 Italy Plant Biotechnology Services Market, by Application, 2017-2022 (US$ Bn)
TABLE 182 Italy Plant Biotechnology Services Market, by Application, 2023-2030 (US$ Bn)
TABLE 183 Italy Plant Biotechnology Services Market, by Technology, 2017-2022 (US$ Bn)
TABLE 184 Italy Plant Biotechnology Services Market, by Technology, 2023-2030 (US$ Bn)
TABLE 185 Italy Plant Biotechnology Services Market, by Crop, 2017-2022 (US$ Bn)
TABLE 186 Italy Plant Biotechnology Services Market, by Crop, 2023-2030 (US$ Bn)
TABLE 187 Spain Plant Biotechnology Services Market, by Equipment Type, 2017-2022 (US$ Bn)
TABLE 188 Spain Plant Biotechnology Services Market, by Equipment Type, 2023-2030 (US$ Bn)
TABLE 189 Spain Plant Biotechnology Services Market, by Application, 2017-2022 (US$ Bn)
TABLE 190 Spain Plant Biotechnology Services Market, by Application, 2023-2030 (US$ Bn)
TABLE 191 Spain Plant Biotechnology Services Market, by Technology, 2017-2022 (US$ Bn)
TABLE 192 Spain Plant Biotechnology Services Market, by Technology, 2023-2030 (US$ Bn)
TABLE 193 Spain Plant Biotechnology Services Market, by Service, 2017-2022 (US$ Bn)
TABLE 194 Spain Plant Biotechnology Services Market, by Service, 2023-2030 (US$ Bn)
TABLE 195 Spain Plant Biotechnology Services Market, by Equipment Type, 2017-2022 (US$ Bn)
TABLE 196 Spain Plant Biotechnology Services Market, by Application, 2023-2030 (US$ Bn)
TABLE 197 Spain Plant Biotechnology Services Market, by Application, 2017-2022 (US$ Bn)
TABLE 198 Spain Plant Biotechnology Services Market, by Technology, 2023-2030 (US$ Bn)
TABLE 199 Spain Plant Biotechnology Services Market, by Crop, 2017-2022 (US$ Bn)
TABLE 200 Spain Plant Biotechnology Services Market, by Crop, 2023-2030 (US$ Bn)
TABLE 201 Rest of Europe Plant Biotechnology Services Market, by Equipment Type, 2017-2022 (US$ Bn)
TABLE 202 Rest of Europe Plant Biotechnology Services Market, by Equipment Type, 2023-2030 (US$ Bn)
TABLE 203 Rest of Europe Plant Biotechnology Services Market, by Application, 2017-2022 (US$ Bn)
TABLE 204 Rest of Europe Plant Biotechnology Services Market, by Application, 2023-2030 (US$ Bn)
TABLE 205 Rest of Europe Plant Biotechnology Services Market, by Technology, 2017-2022 (US$ Bn)
TABLE 206 Rest of Europe Plant Biotechnology Services Market, by Technology, 2023-2030 (US$ Bn)
TABLE 207 Rest of Europe Plant Biotechnology Services Market, by Service, 2017-2022 (US$ Bn)
TABLE 208 Rest of Europe Plant Biotechnology Services Market, by Service, 2023-2030 (US$ Bn)
TABLE 209 Rest of Europe Plant Biotechnology Services Market, by Application, 2017-2022 (US$ Bn)
TABLE 210 Rest of Europe Plant Biotechnology Services Market, by Application, 2023-2030 (US$ Bn)
TABLE 211 Rest of Europe Plant Biotechnology Services Market, by Technology, 2017-2022 (US$ Bn)
TABLE 212 Rest of Europe Plant Biotechnology Services Market, by Technology, 2023-2030 (US$ Bn)
TABLE 213 Rest of Europe Plant Biotechnology Services Market, by Crop, 2017-2022 (US$ Bn)
TABLE 214 Rest of Europe Plant Biotechnology Services Market, by Crop, 2023-2030 (US$ Bn)
TABLE 215 Asia Pacific Plant Biotechnology Services Market, by Equipment Type, 2017-2022 (US$ Bn)
TABLE 216 Asia Pacific Plant Biotechnology Services Market, by Equipment Type, 2023-2030 (US$ Bn)
TABLE 217 Asia Pacific Plant Biotechnology Services Market, by Application, 2017-2022 (US$ Bn)
TABLE 218 Asia Pacific Plant Biotechnology Services Market, by Application, 2023-2030 (US$ Bn)
TABLE 219 Asia Pacific Plant Biotechnology Services Market, by Technology, 2017-2022 (US$ Bn)
TABLE 220 Asia Pacific Plant Biotechnology Services Market, by Technology, 2023-2030 (US$ Bn)
TABLE 221 Asia Pacific Plant Biotechnology Services Market, by Service, 2017-2022 (US$ Bn)
TABLE 222 Asia Pacific Plant Biotechnology Services Market, by Service, 2023-2030 (US$ Bn)
TABLE 223 Asia Pacific Plant Biotechnology Services Market, by Application, 2017-2022 (US$ Bn)
TABLE 224 Asia Pacific Plant Biotechnology Services Market, by Application, 2023-2030 (US$ Bn)
TABLE 225 Asia Pacific Plant Biotechnology Services Market, by Technology, 2017-2022 (US$ Bn)
TABLE 226 Asia Pacific Plant Biotechnology Services Market, by Technology, 2023-2030 (US$ Bn)
TABLE 227 Asia Pacific Plant Biotechnology Services Market, by Crop, 2017-2022 (US$ Bn)
TABLE 228 Asia Pacific Plant Biotechnology Services Market, by Crop, 2023-2030 (US$ Bn)
TABLE 229 China Plant Biotechnology Services Market, by Equipment Type, 2017-2022 (US$ Bn)
TABLE 230 China Plant Biotechnology Services Market, by Equipment Type, 2023-2030 (US$ Bn)
TABLE 231 China Plant Biotechnology Services Market, by Application, 2017-2022 (US$ Bn)
TABLE 232 China Plant Biotechnology Services Market, by Application, 2023-2030 (US$ Bn)
TABLE 233 China Plant Biotechnology Services Market, by Technology, 2017-2022 (US$ Bn)
TABLE 234 China Plant Biotechnology Services Market, by Technology, 2023-2030 (US$ Bn)
TABLE 235 China Plant Biotechnology Services Market, by Service, 2017-2022 (US$ Bn)
TABLE 236 China Plant Biotechnology Services Market, by Service, 2023-2030 (US$ Bn)
TABLE 237 China Plant Biotechnology Services Market, by Application, 2017-2022 (US$ Bn)
TABLE 238 China Plant Biotechnology Services Market, by Application, 2023-2030 (US$ Bn)
TABLE 239 China Plant Biotechnology Services Market, by Technology, 2017-2022 (US$ Bn)
TABLE 240 China Plant Biotechnology Services Market, by Technology, 2023-2030 (US$ Bn)
TABLE 241 China Plant Biotechnology Services Market, by Crop, 2017-2022 (US$ Bn)
TABLE 242 China Plant Biotechnology Services Market, by Crop, 2023-2030 (US$ Bn)
TABLE 243 Japan Plant Biotechnology Services Market, by Equipment Type, 2017-2022 (US$ Bn)
TABLE 244 Japan Plant Biotechnology Services Market, by Equipment Type, 2023-2030 (US$ Bn)
TABLE 245 Japan Plant Biotechnology Services Market, by Application, 2017-2022 (US$ Bn)
TABLE 246 Japan Plant Biotechnology Services Market, by Application, 2023-2030 (US$ Bn)
TABLE 247 Japan Plant Biotechnology Services Market, by Technology, 2017-2022 (US$ Bn)
TABLE 248 Japan Plant Biotechnology Services Market, by Technology, 2023-2030 (US$ Bn)
TABLE 249 Japan Plant Biotechnology Services Market, by Service, 2017-2022 (US$ Bn)
TABLE 250 Japan Plant Biotechnology Services Market, by Service, 2023-2030 (US$ Bn)
TABLE 251 Japan Plant Biotechnology Services Market, by Application, 2017-2022 (US$ Bn)
TABLE 252 Japan Plant Biotechnology Services Market, by Application, 2023-2030 (US$ Bn)
TABLE 253 Japan Plant Biotechnology Services Market, by Technology, 2017-2022 (US$ Bn)
TABLE 254 Japan Plant Biotechnology Services Market, by Technology, 2023-2030 (US$ Bn)
TABLE 255 Japan Plant Biotechnology Services Market, by Crop, 2017-2022 (US$ Bn)
TABLE 256 Japan Plant Biotechnology Services Market, by Crop, 2023-2030 (US$ Bn)
TABLE 257 India Plant Biotechnology Services Market, by Equipment Type, 2017-2022 (US$ Bn)
TABLE 258 India Plant Biotechnology Services Market, by Equipment Type, 2023-2030 (US$ Bn)
TABLE 259 India Plant Biotechnology Services Market, by Application, 2017-2022 (US$ Bn)
TABLE 260 India Plant Biotechnology Services Market, by Application, 2023-2030 (US$ Bn)
TABLE 261 India Plant Biotechnology Services Market, by Technology, 2017-2022 (US$ Bn)
TABLE 262 India Plant Biotechnology Services Market, by Technology, 2023-2030 (US$ Bn)
TABLE 263 India Plant Biotechnology Services Market, by Service, 2017-2022 (US$ Bn)
TABLE 264 India Plant Biotechnology Services Market, by Service, 2023-2030 (US$ Bn)
TABLE 265 India Plant Biotechnology Services Market, by Application, 2017-2022 (US$ Bn)
TABLE 266 India Plant Biotechnology Services Market, by Application, 2023-2030 (US$ Bn)
TABLE 267 India Plant Biotechnology Services Market, by Technology, 2017-2022 (US$ Bn)
TABLE 268 India Plant Biotechnology Services Market, by Technology, 2023-2030 (US$ Bn)
TABLE 269 India Plant Biotechnology Services Market, by Crop, 2017-2022 (US$ Bn)
TABLE 270 India Plant Biotechnology Services Market, by Crop, 2023-2030 (US$ Bn)
TABLE 271 South Korea Plant Biotechnology Services Market, by Equipment Type, 2017-2022 (US$ Bn)
TABLE 272 South Korea Plant Biotechnology Services Market, by Equipment Type, 2023-2030 (US$ Bn)
TABLE 273 South Korea Plant Biotechnology Services Market, by Application, 2017-2022 (US$ Bn)
TABLE 274 South Korea Plant Biotechnology Services Market, by Application, 2023-2030 (US$ Bn)
TABLE 275 South Korea Plant Biotechnology Services Market, by Technology, 2017-2022 (US$ Bn)
TABLE 276 South Korea Plant Biotechnology Services Market, by Technology, 2023-2030 (US$ Bn)
TABLE 277 South Korea Plant Biotechnology Services Market, by Service, 2017-2022 (US$ Bn)
TABLE 278 South Korea Plant Biotechnology Services Market, by Service, 2023-2030 (US$ Bn)
TABLE 279 South Korea Plant Biotechnology Services Market, by Application, 2017-2022 (US$ Bn)
TABLE 280 South Korea Plant Biotechnology Services Market, by Application, 2023-2030 (US$ Bn)
TABLE 281 South Korea Plant Biotechnology Services Market, by Technology, 2017-2022 (US$ Bn)
TABLE 282 South Korea Plant Biotechnology Services Market, by Technology, 2023-2030 (US$ Bn)
TABLE 283 South Korea Plant Biotechnology Services Market, by Crop, 2017-2022 (US$ Bn)
TABLE 284 South Korea Plant Biotechnology Services Market, by Crop, 2023-2030 (US$ Bn)
TABLE 285 South-East Asia Plant Biotechnology Services Market, by Equipment Type, 2017-2022 (US$ Bn)
TABLE 286 South-East Asia Plant Biotechnology Services Market, by Equipment Type, 2023-2030 (US$ Bn)
TABLE 287 South-East Asia Plant Biotechnology Services Market, by Application, 2017-2022 (US$ Bn)
TABLE 288 South-East Asia Plant Biotechnology Services Market, by Application, 2023-2030 (US$ Bn)
TABLE 289 South-East Asia Plant Biotechnology Services Market, by Technology, 2017-2022 (US$ Bn)
TABLE 290 South-East Asia Plant Biotechnology Services Market, by Technology, 2023-2030 (US$ Bn)
TABLE 291 South-East Asia Plant Biotechnology Services Market, by Service, 2017-2022 (US$ Bn)
TABLE 292 South-East Asia Plant Biotechnology Services Market, by Service, 2023-2030 (US$ Bn)
TABLE 293 South-East Asia Plant Biotechnology Services Market, by Application, 2017-2022 (US$ Bn)
TABLE 294 South-East Asia Plant Biotechnology Services Market, by Application, 2023-2030 (US$ Bn)
TABLE 295 South-East Asia Plant Biotechnology Services Market, by Technology, 2017-2022 (US$ Bn)
TABLE 296 South-East Asia Plant Biotechnology Services Market, by Technology, 2023-2030 (US$ Bn)
TABLE 297 South-East Asia Plant Biotechnology Services Market, by Crop, 2017-2022 (US$ Bn)
TABLE 298 South-East Asia Plant Biotechnology Services Market, by Crop, 2023-2030 (US$ Bn)
TABLE 299 Rest of Asia Pacific Plant Biotechnology Services Market, by Equipment Type, 2017-2022 (US$ Bn)
TABLE 300 Rest of Asia Pacific Plant Biotechnology Services Market, by Equipment Type, 2023-2030 (US$ Bn)
TABLE 301 Rest of Asia Pacific Plant Biotechnology Services Market, by Application, 2017-2022 (US$ Bn)
TABLE 302 Rest of Asia Pacific Plant Biotechnology Services Market, by Application, 2023-2030 (US$ Bn)
TABLE 303 Rest of Asia Pacific Plant Biotechnology Services Market, by Technology, 2017-2022 (US$ Bn)
TABLE 304 Rest of Asia Pacific Plant Biotechnology Services Market, by Technology, 2023-2030 (US$ Bn)
TABLE 305 Rest of Asia Pacific Plant Biotechnology Services Market, by Service, 2017-2022 (US$ Bn)
TABLE 306 Rest of Asia Pacific Plant Biotechnology Services Market, by Service, 2023-2030 (US$ Bn)
TABLE 307 Rest of Asia Pacific Plant Biotechnology Services Market, by Application, 2017-2022 (US$ Bn)
TABLE 308 Rest of Asia Pacific Plant Biotechnology Services Market, by Application, 2023-2030 (US$ Bn)
TABLE 309 Rest of Asia Pacific Plant Biotechnology Services Market, by Technology, 2017-2022 (US$ Bn)
TABLE 310 Rest of Asia Pacific Plant Biotechnology Services Market, by Technology, 2023-2030 (US$ Bn)
TABLE 311 Rest of Asia Pacific Plant Biotechnology Services Market, by Crop, 2017-2022 (US$ Bn)
TABLE 312 Rest of Asia Pacific Plant Biotechnology Services Market, by Crop, 2023-2030 (US$ Bn)
TABLE 313 Latin America Plant Biotechnology Services Market, by Application, 2017-2022 (US$ Bn)
TABLE 314 Latin America Plant Biotechnology Services Market, by Application, 2023-2030 (US$ Bn)
TABLE 315 Latin America Plant Biotechnology Services Market, by Technology, 2017-2022 (US$ Bn)
TABLE 316 Latin America Plant Biotechnology Services Market, by Technology, 2023-2030 (US$ Bn)
TABLE 317 Latin America Plant Biotechnology Services Market, by Technology, 2017-2022 (US$ Bn)
TABLE 318 Latin America Plant Biotechnology Services Market, by Technology, 2023-2030 (US$ Bn)
TABLE 319 Latin America Plant Biotechnology Services Market, by Service, 2017-2022 (US$ Bn)
TABLE 320 Latin America Plant Biotechnology Services Market, by Service, 2023-2030 (US$ Bn)
TABLE 321 Latin America Plant Biotechnology Services Market, by Application, 2017-2022 (US$ Bn)
TABLE 322 Latin America Plant Biotechnology Services Market, by Application, 2023-2030 (US$ Bn)
TABLE 323 Latin America Plant Biotechnology Services Market, by Technology, 2017-2022 (US$ Bn)
TABLE 324 Latin America Plant Biotechnology Services Market, by Technology, 2023-2030 (US$ Bn)
TABLE 325 Latin America Plant Biotechnology Services Market, by Crop, 2017-2022 (US$ Bn)
TABLE 326 Latin America Plant Biotechnology Services Market, by Crop, 2023-2030 (US$ Bn)
TABLE 327 Brazil Plant Biotechnology Services Market, by Equipment Type, 2017-2022 (US$ Bn)
TABLE 328 Brazil Plant Biotechnology Services Market, by Equipment Type, 2023-2030 (US$ Bn)
TABLE 329 Brazil Plant Biotechnology Services Market, by Application, 2017-2022 (US$ Bn)
TABLE 330 Brazil Plant Biotechnology Services Market, by Application, 2023-2030 (US$ Bn)
TABLE 331 Brazil Plant Biotechnology Services Market, by Technology, 2017-2022 (US$ Bn)
TABLE 332 Brazil Plant Biotechnology Services Market, by Technology, 2023-2030 (US$ Bn)
TABLE 333 Brazil Plant Biotechnology Services Market, by Service, 2017-2022 (US$ Bn)
TABLE 334 Brazil Plant Biotechnology Services Market, by Service, 2023-2030 (US$ Bn)
TABLE 335 Brazil Plant Biotechnology Services Market, by Application, 2017-2022 (US$ Bn)
TABLE 336 Brazil Plant Biotechnology Services Market, by Application, 2023-2030 (US$ Bn)
TABLE 337 Brazil Plant Biotechnology Services Market, by Technology, 2017-2022 (US$ Bn)
TABLE 338 Brazil Plant Biotechnology Services Market, by Technology, 2023-2030 (US$ Bn)
TABLE 339 Brazil Plant Biotechnology Services Market, by Crop, 2017-2022 (US$ Bn)
TABLE 340 Brazil Plant Biotechnology Services Market, by Crop, 2023-2030 (US$ Bn)
TABLE 341 Argentina Plant Biotechnology Services Market, by Equipment Type, 2017-2022 (US$ Bn)
TABLE 342 Argentina Plant Biotechnology Services Market, by Equipment Type, 2023-2030 (US$ Bn)
TABLE 343 Argentina Plant Biotechnology Services Market, by Application, 2017-2022 (US$ Bn)
TABLE 344 Argentina Plant Biotechnology Services Market, by Application, 2023-2030 (US$ Bn)
TABLE 345 Argentina Plant Biotechnology Services Market, by Technology, 2017-2022 (US$ Bn)
TABLE 346 Argentina Plant Biotechnology Services Market, by Technology, 2023-2030 (US$ Bn)
TABLE 347 Argentina Plant Biotechnology Services Market, by Service, 2017-2022 (US$ Bn)
TABLE 348 Argentina Plant Biotechnology Services Market, by Service, 2023-2030 (US$ Bn)
TABLE 349 Argentina Plant Biotechnology Services Market, by Application, 2017-2022 (US$ Bn)
TABLE 350 Argentina Plant Biotechnology Services Market, by Application, 2023-2030 (US$ Bn)
TABLE 351 Argentina Plant Biotechnology Services Market, by Technology, 2017-2022 (US$ Bn)
TABLE 352 Argentina Plant Biotechnology Services Market, by Technology, 2023-2030 (US$ Bn)
TABLE 353 Argentina Plant Biotechnology Services Market, by Crop, 2017-2022 (US$ Bn)
TABLE 354 Argentina Plant Biotechnology Services Market, by Crop, 2023-2030 (US$ Bn)
TABLE 355 Rest of Latin America Plant Biotechnology Services Market, by Equipment Type, 2017-2022 (US$ Bn)
TABLE 356 Rest of Latin America Plant Biotechnology Services Market, by Equipment Type, 2023-2030 (US$ Bn)
TABLE 357 Rest of Latin America Plant Biotechnology Services Market, by Application, 2017-2022 (US$ Bn)
TABLE 358 Rest of Latin America Plant Biotechnology Services Market, by Application, 2023-2030 (US$ Bn)
TABLE 359 Rest of Latin America Plant Biotechnology Services Market, by Technology, 2017-2022 (US$ Bn)
TABLE 360 Rest of Latin America Plant Biotechnology Services Market, by Technology, 2023-2030 (US$ Bn)
TABLE 361 Rest of Latin America Plant Biotechnology Services Market, by Service, 2017-2022 (US$ Bn)
TABLE 362 Rest of Latin America Plant Biotechnology Services Market, by Service, 2023-2030 (US$ Bn)
TABLE 363 Rest of Latin America Plant Biotechnology Services Market, by Application, 2017-2022 (US$ Bn)
TABLE 364 Rest of Latin America Plant Biotechnology Services Market, by Application, 2023-2030 (US$ Bn)
TABLE 365 Rest of Latin America Plant Biotechnology Services Market, by Technology, 2017-2022 (US$ Bn)
TABLE 366 Rest of Latin America Plant Biotechnology Services Market, by Technology, 2023-2030 (US$ Bn)
TABLE 367 Rest of Latin America Plant Biotechnology Services Market, by Crop, 2017-2022 (US$ Bn)
TABLE 368 Rest of Latin America Plant Biotechnology Services Market, by Crop, 2023-2030 (US$ Bn)
TABLE 369 Middle East and Africa Plant Biotechnology Services Market, by Equipment Type, 2017-2022 (US$ Bn)
TABLE 370 Middle East and Africa Plant Biotechnology Services Market, by Equipment Type, 2023-2030 (US$ Bn)
TABLE 371 Middle East and Africa Plant Biotechnology Services Market, by Application, 2017-2022 (US$ Bn)
TABLE 372 Middle East and Africa Plant Biotechnology Services Market, by Application, 2023-2030 (US$ Bn)
TABLE 373 Middle East and Africa Plant Biotechnology Services Market, by Technology, 2017-2022 (US$ Bn)
TABLE 374 Middle East and Africa Plant Biotechnology Services Market, by Technology, 2023-2030 (US$ Bn)
TABLE 375 Middle East and Africa Plant Biotechnology Services Market, by Service, 2017-2022 (US$ Bn)
TABLE 376 Middle East and Africa Plant Biotechnology Services Market, by Service, 2023-2030 (US$ Bn)
TABLE 377 Middle East and Africa Plant Biotechnology Services Market, by Application, 2017-2022 (US$ Bn)
TABLE 378 Middle East and Africa Plant Biotechnology Services Market, by Application, 2023-2030 (US$ Bn)
TABLE 379 Middle East and Africa Plant Biotechnology Services Market, by Technology, 2017-2022 (US$ Bn)
TABLE 380 Middle East and Africa Plant Biotechnology Services Market, by Technology, 2023-2030 (US$ Bn)
TABLE 381 Middle East and Africa Plant Biotechnology Services Market, by Crop, 2017-2022 (US$ Bn)
TABLE 382 Middle East and Africa Plant Biotechnology Services Market, by Crop, 2023-2030 (US$ Bn)
TABLE 383 GCC Countries Plant Biotechnology Services Market, by Equipment Type, 2017-2022 (US$ Bn)
TABLE 384 GCC Countries Plant Biotechnology Services Market, by Equipment Type, 2023-2030 (US$ Bn)
TABLE 385 GCC Countries Plant Biotechnology Services Market, by Application, 2017-2022 (US$ Bn)
TABLE 386 GCC Countries Plant Biotechnology Services Market, by Application, 2023-2030 (US$ Bn)
TABLE 387 GCC Countries Plant Biotechnology Services Market, by Technology, 2017-2022 (US$ Bn)
TABLE 388 GCC Countries Plant Biotechnology Services Market, by Technology, 2023-2030 (US$ Bn)
TABLE 389 GCC Countries Plant Biotechnology Services Market, by Service, 2017-2022 (US$ Bn)
TABLE 390 GCC Countries Plant Biotechnology Services Market, by Service, 2023-2030 (US$ Bn)
TABLE 391 GCC Countries Plant Biotechnology Services Market, by Application, 2017-2022 (US$ Bn)
TABLE 392 GCC Countries Plant Biotechnology Services Market, by Application, 2023-2030 (US$ Bn)
TABLE 393 GCC Countries Plant Biotechnology Services Market, by Technology, 2017-2022 (US$ Bn)
TABLE 394 GCC Countries Plant Biotechnology Services Market, by Technology, 2023-2030 (US$ Bn)
TABLE 395 GCC Countries Plant Biotechnology Services Market, by Crop, 2017-2022 (US$ Bn)
TABLE 396 GCC Countries Plant Biotechnology Services Market, by Crop, 2023-2030 (US$ Bn)
TABLE 397 South Africa Plant Biotechnology Services Market, by Equipment Type, 2017-2022 (US$ Bn)
TABLE 398 South Africa Plant Biotechnology Services Market, by Equipment Type, 2023-2030 (US$ Bn)
TABLE 399 South Africa Plant Biotechnology Services Market, by Application, 2017-2022 (US$ Bn)
TABLE 400 South Africa Plant Biotechnology Services Market, by Application, 2023-2030 (US$ Bn)
TABLE 401 South Africa Plant Biotechnology Services Market, by Technology, 2017-2022 (US$ Bn)
TABLE 402 South Africa Plant Biotechnology Services Market, by Technology, 2023-2030 (US$ Bn)
TABLE 403 South Africa Plant Biotechnology Services Market, by Service, 2017-2022 (US$ Bn)
TABLE 404 South Africa Plant Biotechnology Services Market, by Service, 2023-2030 (US$ Bn)
TABLE 405 South Africa Plant Biotechnology Services Market, by Application, 2017-2022 (US$ Bn)
TABLE 406 South Africa Plant Biotechnology Services Market, by Application, 2023-2030 (US$ Bn)
TABLE 407 South Africa Plant Biotechnology Services Market, by Technology, 2017-2022 (US$ Bn)
TABLE 408 South Africa Plant Biotechnology Services Market, by Technology, 2023-2030 (US$ Bn)
TABLE 409 South Africa Plant Biotechnology Services Market, by Pharmaceuticals Industry Application, 2017-2022 (US$ Bn)
TABLE 410 South Africa Plant Biotechnology Services Market, by Pharmaceuticals Industry Application, 2023-2030 (US$ Bn)
TABLE 411 Rest of Middle East and Africa Plant Biotechnology Services Market, by Equipment Type, 2017-2022 (US$ Bn)
TABLE 412 Rest of Middle East and Africa Plant Biotechnology Services Market, by Equipment Type, 2023-2030 (US$ Bn)
TABLE 413 Rest of Middle East and Africa Plant Biotechnology Services Market, by Application, 2017-2022 (US$ Bn)
TABLE 414 Rest of Middle East and Africa Plant Biotechnology Services Market, by Application, 2023-2030 (US$ Bn)
TABLE 415 Rest of Middle East and Africa Plant Biotechnology Services Market, by Technology, 2017-2022 (US$ Bn)
TABLE 416 Rest of Middle East and Africa Plant Biotechnology Services Market, by Technology, 2023-2030 (US$ Bn)
TABLE 417 Rest of Middle East and Africa Plant Biotechnology Services Market, by Service, 2017-2022 (US$ Bn)
TABLE 418 Rest of Middle East and Africa Plant Biotechnology Services Market, by Service, 2023-2030 (US$ Bn)
TABLE 419 Rest of Middle East and Africa Plant Biotechnology Services Market, by Application, 2017-2022 (US$ Bn)
TABLE 420 Rest of Middle East and Africa Plant Biotechnology Services Market, by Application, 2023-2030 (US$ Bn)
TABLE 421 Rest of Middle East and Africa Plant Biotechnology Services Market, by Technology, 2017-2022 (US$ Bn)
TABLE 422 Rest of Middle East and Africa Plant Biotechnology Services Market, by Technology, 2023-2030 (US$ Bn)
TABLE 423 Rest of Middle East and Africa Plant Biotechnology Services Market, by Crop, 2017-2022 (US$ Bn)
TABLE 424 Rest of Middle East and Africa Plant Biotechnology Services Market, by Crop, 2023-2030 (US$ Bn)

Frequently Asked Questions

What is the current size of the global plant biotechnology services market?

The global plant biotechnology services market was valued at USD 50.8 Billion in 2022.

What is the expected growth rate of the plant biotechnology services market between 2023 and 2030?

The plant biotechnology services market is expected to grow at a CAGR of 7.5% between 2023 and 2030, reaching USD 84.2 Billion in 2030.

Which segment is leading the market share in terms of equipment type?

Sequencer is the leading segment by equipment type, holding over 20% share in value in 2022.

Which application segment governs the demand for plant biotechnology services worldwide?

Genetic modification governs the global demand for plant biotechnology services, holding a massive share of over 30% in 2022.

Which end user segment governs the demand for plant biotechnology services worldwide?

The biotechnology companies segment is expected to post the highest CAGR during the forecast period.

Which region is fueling the growth of the plant biotechnology services industry?

North America is fueling the growth of the plant biotechnology services industry, with an over one-third share in 2022.

Who are the major players in the global plant biotechnology services market?

The top players include Thermo Fisher Scientific Inc., Agilent Technologies, Inc., Eurofins Scientific SE, and GenScript Biotech Corporation.

What are the major market drivers of the plant biotechnology services industry?

The major market drivers are increasing demand for sustainable agriculture, advancements in gene editing technologies, and growing global population and food security concerns.

What are the major market restraints of the plant biotechnology services industry?

Major market restraints include the complex and stringent regulatory landscape surrounding GMOs, public concerns, and skepticism about genetically modified crops.

What are the major market opportunities of the plant biotechnology services industry?

Growing demand for sustainable agriculture solutions, advancements in precision breeding techniques, and increasing need for crop resilience and adaptation to climate change.

Wood Based Panel Market

Published:
Report ID: 37085

Mobile Crushers Market

Published:
Report ID: 37006

Bamboos Market

Published:
Report ID: 36577

Automotive Webbing Market

Published:
Report ID: 36560

Geosynthetics Market

Published:
Report ID: 36207

Laminated Veneer Lumber Market

Published:
Report ID: 35834

Radiation Shielding Materials Market

Published:
Report ID: 15703

Thermochromic Materials Market

Published:
Report ID: 11162

Smart Mirrors Market

Published:
Report ID: 10279

3D Printed Nanocellulose Market

Published:
Report ID: 34690

Aerospace Plastics Market

Published:
Report ID: 2684

Fire Protection Materials Market For Construction Market

Published:
Report ID: 33848

Purchase Options

$2999
Delivery Format: Excel.
$4999
Designed for the individual purchaser.
$6999
Users located at a single corporate site or regional office.
$7999
Allowed for unlimited sharing globally within one company.
Smallform of Sample request

Have a question?

User Profile

Don’t settle for less – trust Mitul to help you find the best solution.

Report delivery within 24 to 48 hours

– Other Info –

What people say?-

User Review

I am very impressed with the information in this report. The author clearly did their research when they came up with this product and it has already given me a lot of ideas.

Jana Schmidt
CEDAR CX Technologies

– Connect with us –

Phone

+91 6232 49 3207


support

24/7 Research Support


sales@credenceresearch.com

– Research Methodology –

Going beyond the basics: advanced techniques in research methodology

– Trusted By –

Pepshi, LG, Nestle
Motorola, Honeywell, Johnson and johnson
LG Chem, SIEMENS, Pfizer
Unilever, Samsonite, QIAGEN