Market Overview
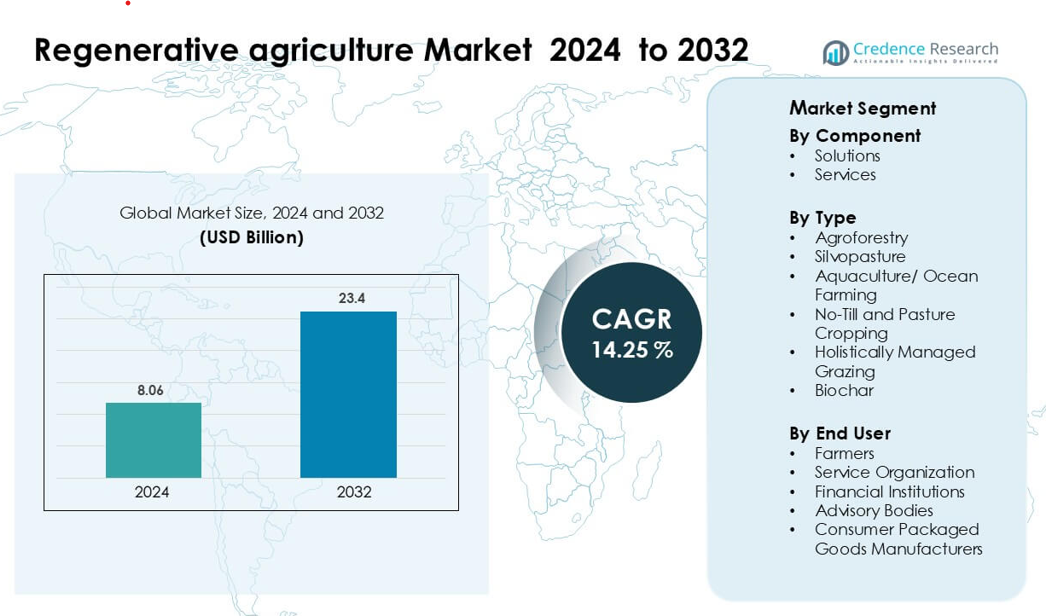
Regenerative agriculture Market was valued at USD 8.06 billion in 2024 and is anticipated to reach USD 23.4 billion by 2032, growing at a CAGR of 14.25% during the forecast period.
| REPORT ATTRIBUTE |
DETAILS |
| Historical Period |
2020-2023 |
| Base Year |
2024 |
| Forecast Period |
2025-2032 |
| Regenerative Agriculture Market Size 2024 |
USD 8.06 billion |
| Regenerative Agriculture Market, CAGR |
14.25% |
| Regenerative Agriculture Market Size 2032 |
USD 23.4 billion |
The regenerative agriculture market includes leading innovators such as Carbon Robotics, Indigo Ag, Aker Technologies, Ecorobotix, Continuum Ag, Cargill, Ruumi, Biotrex, Astanor Ventures, and Agreed.Earth. These companies advanced adoption through soil analytics, automated field systems, biological inputs, and large-scale regenerative sourcing programs. Strategic partnerships with food manufacturers and farmer networks strengthened market reach and improved outcome-based verification. North America remained the leading region in 2024 with about 37% share, driven by strong policy support, high investment in digital soil tools, and widespread participation in carbon-focused farming programs.
Market Insights
- The Regenerative Agriculture Market reached USD 8.06 billion in 2024 and is projected to hit USD 23.4 billion by 2032, growing at a 14.25 % CAGR during the forecast period.
- Strong drivers include soil restoration needs, corporate climate commitments, and expanding financial incentives that support large-scale adoption across farming systems.
- Key trends involve rapid growth of digital soil intelligence tools, rising demand for regenerative-certified food products, and wider integration of livestock into regenerative cropping systems.
- The competitive landscape features players such as Carbon Robotics, Indigo Ag, Aker Technologies, Ecorobotix, Continuum Ag, and Cargill, competing through technology innovation, carbon measurement accuracy, and farmer-centric service models.
- North America led the market with 37% share, followed by Europe at 29%, while agroforestry remained the dominant practice category with roughly 34% segment share due to strong climate and soil restoration benefits.
Access crucial information at unmatched prices!
Request your sample report today & start making informed decisions powered by Credence Research Inc.!
Download Sample
Market Segmentation Analysis:
By Component
Solutions led the regenerative agriculture market in 2024 with about 63% share. Farmers adopted digital soil tools, carbon measurement platforms, and regenerative input systems to improve soil health and boost yield stability. Strong uptake came from crop monitoring software and precision nutrient tools that lowered input use and improved field efficiency. Services grew as producers sought training, certification, and program management support, but solutions stayed ahead due to faster scalability and direct impact on farm productivity.
- For instance, Perennial’s ATLAS‑SOC model has been trained on over 350,000 soil samples, enabling digital soil mapping workflows that generate up to 20× more soil‑organic‑carbon (SOC) inputs for biogeochemical models while reducing the number of physical soil samples required.
By Type
Agroforestry dominated the market in 2024 with nearly 34% share. This method gained traction because tree-crop systems improved soil carbon, reduced erosion, and created diversified income streams. Farmers favored agroforestry for stronger climate resistance and long-term land value. Silvopasture and no-till practices advanced as demand rose for healthier grazing cycles and lower soil disturbance. Biochar and holistically managed grazing grew at steady rates as producers focused on carbon retention and improved pasture resilience.
- For instance, in Uttar Pradesh, India, a state‑led agroforestry carbon finance project is projected to generate 4.5 million carbon credits by integrating tree-based farming across 29 districts.
By End User
Farmers held the largest share in 2024 with about 58%. Producers adopted regenerative methods to enhance soil fertility, reduce fertilizer dependence, and manage climate risks across large crop areas. Adoption rose quickly as farmers gained access to digital tools, credit programs, and field-level advisory support. Service organizations and advisory bodies expanded their roles through certification and monitoring programs, while financial institutions backed outcomes-based lending tied to soil improvement. Consumer packaged goods manufacturers increased investment to secure low-carbon raw materials.
Key Growth Drivers
Growing Need for Soil Health Restoration
Soil degradation increased across major farming regions, pushing producers toward regenerative practices. Farmers adopted methods such as agroforestry, cover cropping, and no-till to rebuild soil structure and enhance organic matter. Rising nutrient loss and declining moisture retention encouraged wider uptake of biological inputs and carbon-rich amendments. Governments supported soil restoration through incentive schemes and sustainability grants, which accelerated adoption. Global food companies also demanded raw materials grown through healthier soil processes, strengthening market growth. Better soil function reduced fertilizer reliance, raised water efficiency, and improved long-term yield stability, making regenerative systems a preferred farming approach.
- For instance, PepsiCo partnered with Soil Capital across more than 14,000 hectares in Europe, helping farmers implement cover‑cropping and reduced tillage to improve soil health and water efficiency.
Rising Corporate Commitments to Climate-Smart Supply Chains
Large consumer-goods companies adopted regenerative agriculture to meet climate goals and reduce supply-chain emissions. Brands set measurable targets for soil carbon improvement, biodiversity protection, and chemical reduction. These commitments created strong demand for regenerative programs across grains, dairy, and specialty crops. Producers received technical support, digital tools, and long-term purchase contracts that encouraged transition. Companies valued regenerative practices for lowering Scope 3 emissions and strengthening raw-material resilience. Retailers also promoted regenerative-certified products to meet rising consumer interest in climate-positive goods. This alignment between corporate sustainability goals and farm-level practice change accelerated market expansion.
- For instance, PepsiCo committed to scaling regenerative farming across 10 million acres globally by 2030 (refined from an earlier 7 million‑acre target), aligning with its Scope 3 emission reduction ambitions.
Expanding Financial and Policy Support for Regenerative Programs
Governments and financial institutions introduced new funding models to scale regenerative agriculture. Carbon markets, green lending, and performance-based credit programs rewarded farmers for measurable improvements in soil health. Agricultural policies shifted toward outcomes such as reduced erosion, lower emissions, and improved water retention. These instruments helped reduce transition risk and upfront investment costs. Banks and insurers favored regenerative producers due to stronger climate resilience and lower long-term operational risk. Subsidies for composting, biochar, and precision tools further strengthened adoption. This broad financial backing provided stability and made regenerative systems economically attractive to farmers.
Key Trend & Opportunity
Growth of Digital Soil Intelligence and Monitoring Tools
Digital platforms transformed regenerative agriculture by offering real-time insights on soil carbon, moisture, and microbial activity. These tools helped farmers measure outcomes and refine practices such as cover cropping, crop rotations, and grazing cycles. Remote-sensing systems supported large-scale monitoring for corporate supply chains and carbon programs. The trend created strong opportunities for analytics firms and ag-tech startups focused on data validation and regenerative reporting. Better measurement improved access to incentives, insurance discounts, and carbon revenue. This technology wave made regenerative systems more precise, transparent, and scalable across different geographies.
- For instance, Indigo Ag’s platform combines satellite imagery, remote sensing, farm‑management data, and modeling: in its second carbon‑credit issuance, it issued 111,389 credits, covering 423,740 acres across more than 5,000 fields.
Rising Demand for Regenerative-Certified Food Products
Consumers increasingly sought food grown under regenerative systems due to concerns about soil health, climate impact, and nutrient quality. Brands responded by launching regenerative-certified grains, dairy, spices, and packaged goods. Retailers expanded shelf space for climate-positive labels, creating visibility for producers. This demand opened opportunities for regional cooperatives, farmer groups, and specialty product lines. Transparent labeling improved trust and helped companies differentiate premium offerings. As more markets adopted regenerative standards, producers gained access to value-added price segments and long-term supply agreements. This trend strengthened commercial pathways for regenerative farming.
- For instance, SIMPLi, a CPG brand, offers Regenerative Organic Certified® quinoa, lupini beans, black beans, kidney beans, amaranth and other pantry staples, sourcing directly from farmers across Peru, Argentina, Paraguay and Greece.
Integration of Livestock into Regenerative Crop Systems
Holistic grazing and mixed crop-livestock systems gained traction as farmers pursued healthier soil cycles and higher biodiversity. Managed grazing improved nutrient cycling and supported natural grassland regeneration. Producers integrated livestock to reduce synthetic inputs and diversify income. These systems offered opportunities for meat and dairy companies seeking lower-emission supply chains. Grazing-based carbon gains attracted strong interest from carbon-credit programs. The trend supported higher land productivity and created new business models for rotational grazing services and regenerative livestock networks.
Key Challenge
High Transition Costs and Long Payback Periods
Farmers faced significant costs when shifting to regenerative practices, including investments in training, new equipment, composting infrastructure, and advisory services. Early years often showed lower or inconsistent yields before soil systems stabilized. Limited financial reserves made it hard for smallholders to absorb risk. Uncertain carbon market returns and slow certification processes added more pressure. Many producers struggled to access credit due to unclear revenue projections. These financial barriers slowed adoption, especially in regions without strong subsidy programs or long-term supply contracts.
Limited Standardization and Measurement Complexity
The market lacked unified standards to verify regenerative outcomes across soil, biodiversity, and carbon metrics. Different programs used varying methodologies, creating confusion for farmers and buyers. Measurement of soil carbon remained complex due to natural variability and the influence of climate and land history. Inconsistent reporting made it difficult for companies to track progress across supply chains. Certification processes required time, technical knowledge, and reliable data systems. These challenges limited scalability and slowed integration with corporate sustainability targets.
Regional Analysis
North America
North America led the regenerative agriculture market in 2024 with about 37% share. Strong policy incentives, carbon programs, and advanced digital soil tools supported wide adoption across the U.S. and Canada. Farmers shifted toward practices such as cover cropping, no-till, and holistic grazing to manage climate risks and improve soil structure. Food companies invested heavily in regenerative sourcing partnerships that strengthened market visibility. Large-scale farms enabled rapid scaling of measurement systems and carbon-credit participation, further boosting the region’s leadership.
Europe
Europe held nearly 29% share in 2024, driven by strict environmental regulations and strong demand for sustainable food systems. EU initiatives promoting soil restoration, biodiversity improvement, and reduced chemical use accelerated adoption. Countries such as France, Germany, and the U.K. expanded regenerative pilot programs tied to long-term climate strategies. Retailers and consumer brands supported regenerative-certified products, enhancing visibility across premium categories. Farmers benefited from subsidy-backed transitions, making Europe a key hub for structured regenerative farming frameworks.
Asia-Pacific
Asia-Pacific accounted for about 22% share in 2024, supported by rising food security needs and climate-resilient agriculture programs. Countries like India, Australia, and Japan promoted regenerative methods to address soil degradation, water scarcity, and crop vulnerability. Smallholder-focused training and government-backed natural farming schemes expanded adoption. Growing interest from food exporters and multinational buyers strengthened regional supply chains. The region also advanced agroforestry and mixed-farming systems suited to diverse climates, creating strong long-term growth potential.
Latin America
Latin America captured nearly 8% share in 2024, driven by large-scale grazing systems and strong biodiversity-focused initiatives. Brazil, Argentina, and Colombia saw rising adoption of agroforestry, silvopasture, and rotational grazing to improve pasture health. International funding supported projects targeting soil carbon restoration in degraded lands. Farmers leveraged regenerative methods to enhance export competitiveness and reduce chemical dependence. Regional progress accelerated as global buyers sought climate-positive raw materials from Latin American supply networks.
Middle East & Africa
The Middle East & Africa region held around 4% share in 2024, with growth led by efforts to combat desertification and improve soil fertility. Countries invested in regenerative practices such as composting, water-efficient cropping, and integrated livestock systems to handle harsh climates. Development agencies supported training programs aimed at smallholders. Adoption rose slowly due to limited financing but gained momentum through pilot projects and carbon initiatives. Growing interest in climate-resilient farming positioned the region for steady expansion.
Market Segmentations:
By Component
By Type
- Agroforestry
- Silvopasture
- Aquaculture/ Ocean Farming
- No-Till and Pasture Cropping
- Holistically Managed Grazing
- Biochar
By End User
- Farmers
- Service Organization
- Financial Institutions
- Advisory Bodies
- Consumer Packaged Goods Manufacturers
By Geography
- North America
- Europe
- Germany
- France
- U.K.
- Italy
- Spain
- Rest of Europe
- Asia Pacific
- China
- Japan
- India
- South Korea
- South-east Asia
- Rest of Asia Pacific
- Latin America
- Brazil
- Argentina
- Rest of Latin America
- Middle East & Africa
- GCC Countries
- South Africa
- Rest of the Middle East and Africa
Competitive Landscape
The regenerative agriculture market features a mix of ag-tech innovators, sustainability-focused startups, and established agribusiness leaders. Companies such as Carbon Robotics, Indigo Ag, Aker Technologies, Ecorobotix, and Continuum Ag advanced adoption through digital soil tools, automated weeding systems, and outcome-based measurement platforms. Large players like Cargill strengthened their position by launching regenerative sourcing programs across grains and specialty crops. Investors such as Astanor Ventures supported scalable models in soil health, biological inputs, and carbon validation. Many companies formed partnerships with food manufacturers, farmer networks, and financial institutions to expand field trials and commercial deployment. The competitive environment emphasized technology integration, carbon quantification accuracy, and farmer-centric service models, creating strong differentiation across global markets.
Shape Your Report to Specific Countries or Regions & Enjoy 30% Off!
Key Player Analysis
Recent Developments
- In 2025, Indigo Ag and Google launched a water-focused regenerative program in Oklahoma. The project aims to replenish about 1.5 billion gallons through regenerative practices by 2032.
- In 2025, Carbon Robotics introduced the LaserWeeder G2 with Nvidia GPUs. The robot can eliminate up to 600,000 weeds per hour, reducing herbicide use on farms
Report Coverage
The research report offers an in-depth analysis based on Component, Type, End-User and Geography. It details leading market players, providing an overview of their business, product offerings, investments, revenue streams, and key applications. Additionally, the report includes insights into the competitive environment, SWOT analysis, current market trends, as well as the primary drivers and constraints. Furthermore, it discusses various factors that have driven market expansion in recent years. The report also explores market dynamics, regulatory scenarios, and technological advancements that are shaping the industry. It assesses the impact of external factors and global economic changes on market growth. Lastly, it provides strategic recommendations for new entrants and established companies to navigate the complexities of the market.
Future Outlook
- Adoption of regenerative practices will expand as farmers seek stronger soil health and climate resilience.
- Digital soil monitoring tools will become standard for measuring carbon, moisture, and biological activity.
- Corporates will scale regenerative sourcing programs across grains, dairy, and specialty crops.
- Carbon-credit participation will rise as verification systems become more reliable and accessible.
- Livestock integration with cropping systems will grow to support natural nutrient cycles.
- Governments will introduce more performance-based incentives to accelerate farm-level transitions.
- Consumer demand for regenerative-certified products will strengthen global retail visibility.
- Investment from agritech firms and sustainability funds will increase technology deployment.
- Large food companies will push for unified regenerative standards across supply chains.
- Climate-focused farming networks will expand, enabling faster knowledge transfer and regional scaling.


