Market overview
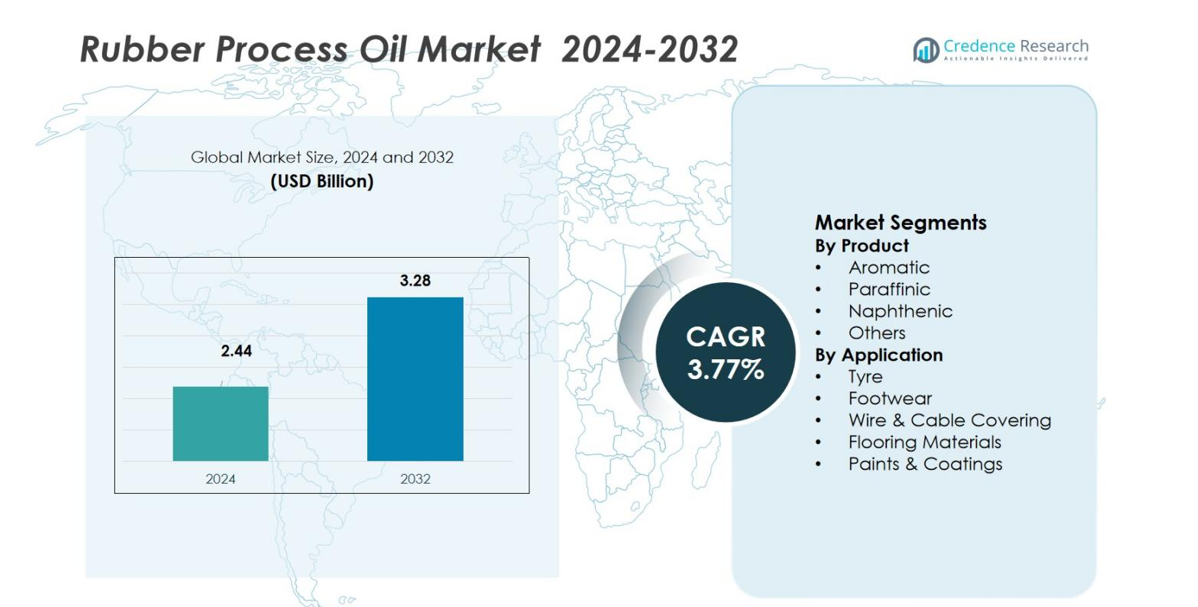
Rubber Process Oil Market size was valued at USD 2.44 Billion in 2024 and is anticipated to reach USD 3.28 Billion by 2032, at a CAGR of 3.77% during the forecast period.
| REPORT ATTRIBUTE |
DETAILS |
| Historical Period |
2020-2023 |
| Base Year |
2024 |
| Forecast Period |
2025-2032 |
| Rubber Process Oil Market Size 2024 |
USD 2.44 Billion |
| Rubber Process Oil Market, CAGR |
3.77% |
| Rubber Process Oil Market Size 2032 |
USD 3.28 Billion |
Rubber Process Oil Market is driven by the presence of major players such as Panama Petrochem Ltd, Lub Line, Idemitsu Kosan Co. Ltd., Nynas, Indian Oil Corporation Ltd, ORGKHIM Biochemical Holding, Lukoil, H&R Group, HollyFrontier Corporation, and LODHA Petro, all of whom focus on refining quality, low-PAH formulations, and customized solutions for tyre, footwear, and industrial rubber applications. These companies continue to expand manufacturing capabilities and enhance product performance to meet evolving regulatory and industry requirements. Asia-Pacific emerged as the leading region in 2024, accounting for 48.9% share, supported by large-scale tyre production, strong industrial output, and expanding polymer processing activities across China, India, and Southeast Asia.
Market Insights
- The Rubber Process Oil Market was valued at USD 2.44 Billion in 2024 and is projected to reach USD 3.28 Billion by 2032, registering a CAGR of 3.77% during the forecast period.
- Rising demand from tyre manufacturing and industrial rubber goods remains the primary market driver, with the tyre segment holding 62.4% share due to expanding automotive production and replacement cycles.
- A key market trend includes the growing shift toward low-PAH and eco-friendly process oils such as TDAE and MES as global regulations tighten, particularly in Europe and Asia.
- Major players focus on refining advancements, high-purity aromatic and paraffinic oils, and tailored formulations to strengthen their presence amid intense product-quality-driven competition.
- Asia-Pacific dominated the market with 48.9% share in 2024, driven by strong manufacturing activity, while Europe held 21.4% share supported by rapid adoption of sustainable and REACH-compliant rubber process oils.
Access crucial information at unmatched prices!
Request your sample report today & start making informed decisions powered by Credence Research Inc.!
Download Sample
Market Segmentation Analysis:
By Product:
The Rubber Process Oil Market by product is led by the Aromatic segment, which accounted for 46.8% share in 2024, driven by its strong solvency, high compatibility with natural and synthetic rubbers, and extensive use in tyre manufacturing. Aromatic oils enhance elasticity, softness, and filler dispersion, making them preferred in heavy-duty automotive and industrial applications. The Paraffinic segment, holding a significant share, benefits from low volatility and superior oxidation stability, supporting demand in heat-resistant rubber goods. Naphthenic oils continue expanding due to better low-temperature performance, while the Others category supports niche compounding needs.
- For instance, Ergon’s HyPrene L2000 naphthenic oil demonstrates superior performance in tire tread applications, achieving the fastest cure time in carbon black formulations and producing measurably better abrasion resistance and winter traction properties compared to alternative process oils in the same formulation types.
By Application:
The Tyre segment dominated the Rubber Process Oil Market with a 62.4% share in 2024, primarily driven by rising automotive production, accelerating replacement tyre demand, and stricter performance requirements for tread and sidewall compounds. Rubber process oils enhance viscosity, flexibility, and dispersion quality, making them essential for high-performance tyre formulations. The Footwear segment follows due to expanding EVA and rubber-based footwear manufacturing, while Wire & Cable Covering shows steady growth with increasing electrical infrastructure investments. Flooring Materials and Paints & Coatings continue to gain traction due to urban construction growth and the need for durable, elastic polymer blends.
- For instance, Continental has incorporated synthetic rubber derived from renewable sources such as used cooking oil and recycled pyrolysis oil to improve sustainability in tire production, with renewable materials comprising 26% of their mix in 2024.
Key Growth Drivers
Rising Demand from Tyre Manufacturing
The tyre manufacturing industry remains the strongest growth driver for the Rubber Process Oil Market, supported by increasing automotive production, expanding replacement tyre demand, and the rapid growth of commercial vehicle fleets. Rubber process oils enhance elasticity, abrasion resistance, and filler dispersion in tyre compounds, making them indispensable for both OEM and aftermarket applications. The global shift toward fuel-efficient and high-performance tyres further amplifies the need for specialty process oils that improve rolling resistance and tread durability, strengthening long-term market expansion.
- For instance, Shell’s Flavex 595, a non-labelled process oil produced using residual aromatic extract (RAE) technology, is widely used as an extender oil in tyre manufacturing, improving the durability and performance of tyres.
Expansion of Industrial Rubber Goods
Growing demand for industrial rubber products such as conveyor belts, hoses, gaskets, seals, and molded components significantly drives market growth. Manufacturing, mining, construction, and infrastructure development rely heavily on durable rubber compounds where process oils improve flexibility, processing efficiency, and compound stability. As industries modernize operations and expand production capacity, the need for high-quality rubber goods increases. This directly boosts consumption of aromatic, paraffinic, and naphthenic process oils used to enhance performance characteristics under high pressure, temperature variations, and heavy mechanical stress.
- For instance, Witmans supplies REACH-compliant bio process oils that enhance processing efficiency and durability in rubber molded products such as seals, gaskets, and hoses used in automotive and industrial machinery.
Growth in Footwear and Polymer Products
The expanding footwear industry, particularly in Asia-Pacific, contributes strongly to market growth due to rising production of EVA-based and rubber-soled footwear. Rubber process oils help improve softness, color stability, and workability in both mass-market and premium footwear lines. Additionally, their increasing use in polymer-based consumer goods such as mats, grips, insulation products, and flexible packaging materials supports market growth. As consumer spending rises and manufacturing shifts toward cost-effective rubber-polymer blends, process oils become vital in achieving consistent material performance and production efficiency.
Key Trends & Opportunities
Shift Toward Low-PAH and Environment-Friendly Oils
A major market trend is the accelerating transition toward low-PAH, non-carcinogenic, and environmentally compliant process oils due to stringent regulations in Europe and Asia. Manufacturers are shifting from conventional aromatic oils to treated distillate aromatic extract (TDAE), mild extraction solvate (MES), and naphthenic alternatives. This shift creates strong opportunities for players offering sustainable, REACH-compliant formulations. As OEMs increasingly adopt green tyre technologies and eco-friendly rubber solutions, demand for refined and specialty low-toxicity process oils grows substantially.
- For instance, Basekim’s TDAE process oil is refined to reduce harmful PAHs, making it compliant with EU REACH regulations and widely used in tire manufacturing across Europe for its safety and durability benefits.
Rising Applications in Electrical and Construction Sectors
Expanding use of rubber compounds in wire & cable insulation, flooring materials, and waterproofing membranes is creating new opportunities for the Rubber Process Oil Market. Rapid urbanization, infrastructure growth, and rising electricity consumption are driving demand for flexible, heat-resistant, and durable rubber materials. Process oils serve as essential plasticizers that enhance electrical resistance, thermal stability, and surface finish. As countries invest in smart grids, residential development, and commercial construction, demand for specialized rubber compounds and consequently process oils continues to accelerate.
- For instance, Polygomma Industries manufactures EPDM rubber waterproofing membranes that offer long-lasting protection against water damage, strong UV resistance, and are widely used for waterproofing roofs, basements, and industrial ponds.
Key Challenges
Stringent Environmental and Safety Regulations
The Rubber Process Oil Market faces significant challenges due to strict global regulations limiting the use of polycyclic aromatic hydrocarbons (PAHs) and carcinogenic compounds. Compliance with EU REACH, EPA standards, and Asia-specific environmental rules requires manufacturers to reformulate products, invest in cleaner refining technologies, and transition to eco-friendly variants. This increases production costs and complicates raw material sourcing. Smaller manufacturers particularly struggle with certification and process upgrades, which may limit market entry and reduce competitiveness against large global suppliers.
Volatility in Crude Oil Prices and Supply Constraints
Rubber process oils are petroleum-derived, making the market highly vulnerable to fluctuations in crude oil prices and supply chain disruptions. Unstable crude markets impact feedstock availability, refining margins, and overall production costs, creating pricing pressures for manufacturers and end users. Geopolitical tensions, refinery shutdowns, and transportation delays further contribute to inconsistent supply. This volatility challenges producers’ ability to maintain stable pricing contracts and affects profitability, especially in price-sensitive applications like tyres, footwear, and general rubber goods.
Regional Analysis
North America
North America held 18.6% share of the Rubber Process Oil Market in 2024, supported by strong tyre replacement demand, expanding automotive aftermarket, and increased production of industrial rubber goods. The United States drives regional consumption due to its large vehicle parc, robust construction activities, and steady investment in wire and cable applications. Demand for low-PAH and REACH-compliant oils continues to rise as manufacturers shift toward sustainable formulations. Growth in polymer-based consumer products and roofing materials also strengthens market adoption, while Mexico’s expanding manufacturing sector contributes to steady regional demand.
Europe
Europe accounted for 21.4% share in 2024, driven by stringent environmental regulations that accelerate the shift toward TDAE, MES, and low-PAH naphthenic oils. Germany, France, and Italy dominate demand due to strong automotive production and advanced rubber goods manufacturing capabilities. The region’s focus on sustainable tyres and eco-friendly rubber compounds creates opportunities for high-purity process oils. Investments in energy-efficient infrastructure, electrical applications, and flooring materials further support growth. Rising adoption of high-performance elastomers in industrial applications also boosts market expansion across Western and Central Europe.
Asia-Pacific
Asia-Pacific led the Rubber Process Oil Market with 48.9% share in 2024, driven by rapid industrialization, leading tyre manufacturing hubs, and large-scale production of footwear, automotive parts, and polymer goods. China, India, Japan, and South Korea anchor regional demand owing to strong automotive growth, expansive construction activities, and dominant rubber processing industries. Affordable labor, rising domestic consumption, and expanding export capabilities further strengthen the region’s leadership. Asia-Pacific continues to see increased adoption of low-toxicity oils as regulatory frameworks tighten, enhancing demand for paraffinic and naphthenic product types.
Latin America
Latin America captured 6.7% share of the market in 2024, supported by growing automotive aftermarket demand and expanding manufacturing capabilities in Brazil, Mexico, and Argentina. The tyre industry drives a significant portion of consumption, particularly in replacement tyres for commercial and passenger vehicles. Increasing construction activity supports the adoption of rubber-based flooring, insulation, and waterproofing materials. Growth in the footwear sector, especially in Brazil, further contributes to demand for process oils. As regional industries modernize and environmental compliance improves, the shift toward cleaner and high-performance process oils is gaining momentum.
Middle East & Africa
The Middle East & Africa region held 4.4% share in 2024, driven by growing industrial activity, rising automotive service demand, and increasing investments in infrastructure development. The UAE, Saudi Arabia, and South Africa lead consumption, particularly in wire and cable insulation, construction materials, and tyre applications. Expanding petrochemical production capacity provides access to feedstock, supporting local manufacturing of process oils. Demand for durable rubber goods in mining, construction, and transportation industries continues to rise. The region is gradually transitioning toward higher-quality and low-PAH oils as regulatory standards strengthen and industrial modernization accelerates.
Market Segmentations:
By Product
- Aromatic
- Paraffinic
- Naphthenic
- Others
By Application
- Tyre
- Footwear
- Wire & Cable Covering
- Flooring Materials
- Paints & Coatings
By Geography
- North America
- Europe
- Germany
- France
- U.K.
- Italy
- Spain
- Rest of Europe
- Asia Pacific
- China
- Japan
- India
- South Korea
- South-east Asia
- Rest of Asia Pacific
- Latin America
- Brazil
- Argentina
- Rest of Latin America
- Middle East & Africa
- GCC Countries
- South Africa
- Rest of the Middle East and Africa
Competitive Landscape
Competitive landscape in the Rubber Process Oil Market is shaped by leading players such as Panama Petrochem Ltd, Lub Line, Idemitsu Kosan Co. Ltd., Nynas, Indian Oil Corporation Ltd., ORGKHIM Biochemical Holding, Lukoil, H&R Group, HollyFrontier Corporation, and LODHA Petro. These companies compete on product quality, refining technology, regulatory compliance, and customized formulations tailored for tyre, footwear, and industrial rubber applications. Global players focus on expanding their portfolios of low-PAH, eco-friendly, and REACH-compliant oils to meet tightening environmental norms across Europe and Asia. Strategic investments in advanced extraction technologies, capacity expansion, and long-term supply partnerships with tyre and rubber manufacturers strengthen competitive positioning. Regional players emphasize cost-effective aromatic and paraffinic oils to serve high-volume markets in Asia-Pacific. Continuous innovation in refining efficiency, improved solvency performance, and enhanced compatibility with synthetic elastomers further defines competition, while sustainability-driven product upgrades remain central to long-term market differentiation.
Shape Your Report to Specific Countries or Regions & Enjoy 30% Off!
Key Player Analysis
- Panama Petrochem Ltd
- Lub Line
- Idemitsu Kosan Co. Ltd.
- Nynas
- Indian Oil Corporation Ltd
- ORGKHIM Biochemical Holding
- Lukoil
- H&R Group
- HollyFrontier Corporation
- LODHA Petro
Recent Developments
- In July 2025, Shell successfully completed the acquisition of a 100% equity interest in Raj Petro Specialities Pvt. Ltd. from the Brenntag Group , strengthening Shell Lubricants’ presence in India’s market by supplying customers in the power transmission, personal care, and pharmaceutical sectors, with complementary product portfolios and increased scale of business.
- In 2024, Nynas introduced the EVO line of naphthenic products (including tyre oils), which offer an approximate 25% carbon footprint reduction as drop-in replacements, and achieved an EcoVadis Gold sustainability rating
Report Coverage
The research report offers an in-depth analysis based on Product, Application and Geography. It details leading market players, providing an overview of their business, product offerings, investments, revenue streams, and key applications. Additionally, the report includes insights into the competitive environment, SWOT analysis, current market trends, as well as the primary drivers and constraints. Furthermore, it discusses various factors that have driven market expansion in recent years. The report also explores market dynamics, regulatory scenarios, and technological advancements that are shaping the industry. It assesses the impact of external factors and global economic changes on market growth. Lastly, it provides strategic recommendations for new entrants and established companies to navigate the complexities of the market.
Future Outlook
- The market will experience steady growth driven by rising tyre production and global automotive demand.
- Adoption of low-PAH, eco-friendly, and REACH-compliant process oils will accelerate across major manufacturing regions.
- Asia-Pacific will continue to dominate consumption as industrial production and rubber goods manufacturing expand.
- Demand for specialty paraffinic and naphthenic oils will rise due to their superior stability and performance in high-end applications.
- Increasing investments in sustainable and green tyre technologies will create new opportunities for advanced process oils.
- The footwear, wire & cable, and flooring sectors will generate higher demand as construction and consumer goods markets expand.
- Digitalization and automation in rubber processing will drive the need for high-consistency, high-purity process oils.
- Manufacturers will focus on efficient refining technologies to reduce emissions and improve product quality.
- Volatility in crude oil prices will remain a key factor shaping production costs and supply strategies.
- Regulatory shifts toward safer formulations will push producers to diversify into cleaner and specialty-grade oils.


