
Market Overview
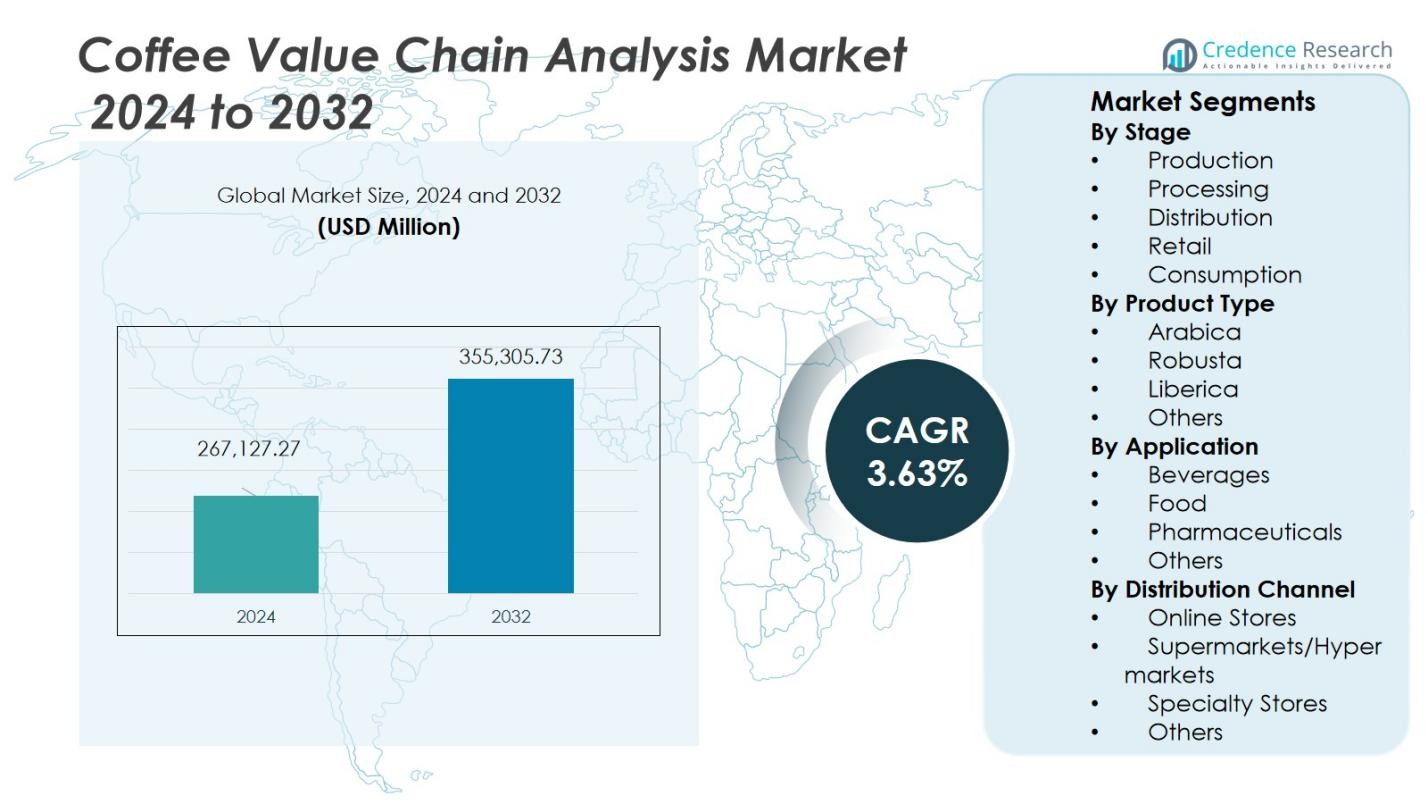
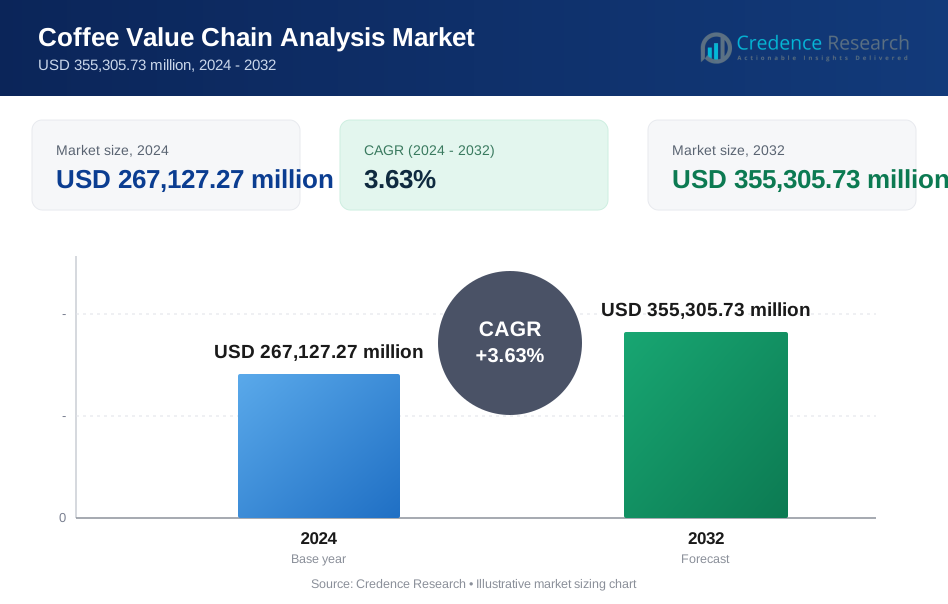
The Coffee Value Chain Analysis Market size was valued at USD 267,127.27 million in 2024 and is anticipated to reach USD 355,305.73 million by 2032, growing at a CAGR of 3.63% during the forecast period.
| REPORT ATTRIBUTE | DETAILS |
|---|---|
| Historical Period | 2020-2023 |
| Base Year | 2024 |
| Forecast Period | 2025-2032 |
| Coffee Value Chain Analysis Market Size 2024 | USD 267,127.27 Million |
| Coffee Value Chain Analysis Market, CAGR | 3.63% |
| Coffee Value Chain Analysis Market Size 2032 | USD 355,305.73 Million |
The Coffee Value Chain Analysis Market is led by prominent players such as Starbucks Corporation, Nestlé S.A., JDE Peet’s, Tata Coffee Limited, Lavazza Group, Illycaffè S.p.A., The Kraft Heinz Company, Peet’s Coffee, Caribou Coffee Company, and Blue Bottle Coffee. These companies dominate through strong sourcing networks, advanced roasting technologies, and extensive retail presence across global markets. They focus on sustainable production, transparent supply chains, and innovation in specialty and ready-to-drink coffee segments to strengthen brand positioning. North America leads the market with a 29% share in 2024, driven by high coffee consumption, premiumization trends, and established café culture across the region.
Market Insights
- The Coffee Value Chain Analysis Market was valued at USD 267,127.27 million in 2024 and is projected to reach USD 355,305.73 million by 2032, growing at a CAGR of 3.63%.
- Rising global coffee consumption and growing demand for premium and sustainable products drive overall market expansion.
- Increasing adoption of specialty blends, ready-to-drink formats, and direct trade models shapes major market trends.
- The market is moderately consolidated, with leading players such as Starbucks, Nestlé, and JDE Peet’s dominating production, processing, and retail operations.
- North America leads with a 29% regional share, while the production stage holds 38% and the beverages segment accounts for 71% of total market revenue, supported by strong consumption across developed and emerging economies.
Market Segmentation Analysis:
By Stage
The production stage dominates the Coffee Value Chain Analysis Market with a 38% share in 2024. This stage benefits from expanding coffee cultivation in regions such as Latin America, Africa, and Asia-Pacific. Technological improvements in irrigation, seed genetics, and sustainable farming practices enhance yield quality and consistency. The growing shift toward certified organic and fair-trade coffee also strengthens producer margins and traceability. Demand for specialty and premium-grade beans continues to rise, encouraging investments in farm-level quality management and cooperative sourcing networks that boost production efficiency and market stability.
- For instance, World Coffee Research has developed hybrid coffee varieties resilient to climate change and pests, boosting farm-level yields and flavor profiles.
By Product Type
Arabica coffee leads the market with a 62% share in 2024, driven by its superior flavor profile and premium positioning. Consumers prefer Arabica for its smooth taste, balanced acidity, and aromatic richness, making it the preferred choice for specialty blends and retail brands. Growing demand from North America and Europe for high-quality, sustainably sourced coffee supports Arabica’s dominance. Meanwhile, Robusta and Liberica varieties expand gradually in emerging markets due to affordability and stronger caffeine content, but Arabica remains the global benchmark for premium coffee consumption and value generation.
- For instance, Lavazza's Classico blend, which uses high-quality Arabica beans, is renowned for its balanced medium roast and affordability, catering to a broad consumer base seeking premium yet accessible coffee.
By Application
The beverages segment holds the largest share at 71% in 2024, supported by strong consumption through cafes, restaurants, and ready-to-drink formats. Rising global coffee culture, urban lifestyles, and growing penetration of premium instant and cold-brew products drive this segment’s dominance. Major brands invest in product innovation, flavor expansion, and sustainability certifications to attract health-conscious consumers. The food segment also grows steadily through bakery and confectionery applications, while pharmaceutical use remains limited to functional formulations leveraging caffeine’s therapeutic benefits. Beverage applications remain the primary revenue generator throughout the coffee value chain.
Key Growth Drivers
Rising Global Coffee Consumption and Premiumization
The Coffee Value Chain Analysis Market grows due to rising global demand for specialty and premium coffee. Consumers increasingly seek high-quality, ethically sourced beans and unique flavor experiences. Expanding coffee culture in emerging markets, coupled with a surge in café chains and artisanal brands, drives demand for superior blends. Premiumization trends push producers to improve quality control, traceability, and sustainable practices across the supply chain, reinforcing value creation from farm to retail.
- For instance, in India, the Coffee Board’s Integrated Coffee Development Project has enabled nearly 150,000 tribal families in the Araku Valley to increase coffee production by 20% through improved farming practices and access to financing, supporting both community empowerment and sustainable growth.
Expansion of Sustainable and Fair-Trade Practices
Growing consumer awareness of ethical sourcing fuels the adoption of fair-trade and environmentally responsible production. Farmers and exporters increasingly align with sustainability certifications like Rainforest Alliance and UTZ to secure global market access. Companies invest in transparent supply chains to ensure fair compensation and resource conservation. This shift not only supports farmer livelihoods but also enhances brand reputation and consumer trust, creating a long-term growth driver for the global coffee value chain.
- For instance, Nestlé’s Nescafé surpassed its 2025 goal early by sourcing 32% of its coffee from farmers practicing regenerative agriculture in 2024, training over 200,000 farmers and reducing greenhouse gas emissions by 20-40% per kilogram of green coffee
Technological Advancements in Processing and Logistics
Automation and digitalization across coffee processing, roasting, and logistics optimize efficiency and quality control. Smart farming techniques, blockchain traceability, and AI-enabled quality grading systems enhance transparency and reduce operational costs. Logistics improvements, including temperature-controlled transport and predictive demand forecasting, ensure product freshness and minimize losses. These advancements strengthen integration across the value chain, supporting scalable growth and improved profitability for producers, traders, and retailers alike.
Key Trends & Opportunities
Emergence of Specialty Coffee and Direct Trade Models
The growing demand for specialty coffee fosters direct trade relationships between farmers and roasters. This model enhances price transparency and allows smallholders to receive fairer compensation. Specialty roasters promote single-origin and micro-lot coffees, appealing to premium consumers seeking authenticity and flavor diversity. This trend creates opportunities for local cooperatives and emerging producers to participate in higher-value segments while improving traceability and supply chain sustainability.
- For instance, Wakuli Coffee directly partners with farmers, ensuring they pay prices higher than market averages to reward quality and sustainability, which encourages farmers to invest in their farms.
Growth of Ready-to-Drink and Functional Coffee Products
Shifting lifestyles and rising urbanization drive demand for convenient, ready-to-drink coffee products. Brands introduce cold brew, nitro, and functional coffee blends infused with protein, vitamins, and adaptogens. These innovations attract health-conscious and on-the-go consumers, especially in Asia-Pacific and North America. The fusion of functionality with indulgence presents new market opportunities for manufacturers, fostering diversification beyond traditional roasted or ground coffee formats.
- For instance, Nestlé expanded its Nescafé Ready-to-Drink cold coffee range into India, the Middle East, North Africa, and Brazil in 2025, enhancing availability of functional cold coffee options in these key regions.
Key Challenges
Price Volatility and Supply Chain Vulnerability
The Coffee Value Chain Analysis Market faces ongoing challenges from fluctuating coffee bean prices due to unpredictable weather and production instability. Droughts, pests, and geopolitical disruptions affect yields and export flows, particularly in key producing countries like Brazil and Vietnam. These fluctuations impact farmer income and increase cost pressures across the supply chain. Long-term resilience requires investment in climate-adaptive farming and diversified sourcing strategies to stabilize global supply.
Quality Inconsistencies and Limited Infrastructure in Developing Regions
Inconsistent processing standards and poor post-harvest handling affect product quality and export potential in emerging markets. Limited access to advanced milling, drying, and storage infrastructure hampers efficiency and reduces competitiveness. Smallholders often lack financial and technical resources to adopt modern practices, widening the gap between premium and conventional producers. Addressing these bottlenecks through training programs and infrastructure development remains vital for maintaining quality and ensuring equitable growth across the coffee value chain.
Regional Analysis
North America
North America holds a 29% share of the Coffee Value Chain Analysis Market in 2024, driven by strong consumption patterns and an expanding specialty coffee culture. The United States leads with high demand for premium, single-origin, and ready-to-drink coffee products. Consumers prioritize ethically sourced and sustainably produced beans, prompting companies to enhance transparency and traceability. Major roasters and retailers, including Starbucks and Nestlé, invest in advanced roasting and packaging technologies to maintain quality. Canada’s growing café network and increasing household coffee machine adoption further support steady regional growth across the value chain.
Europe
Europe accounts for 27% of the market share in 2024, supported by a mature coffee-drinking culture and strong demand for organic and fair-trade coffee. Countries such as Germany, Italy, and France dominate due to established roasting industries and a preference for artisanal coffee products. Sustainability initiatives and circular economy practices strengthen regional competitiveness. The European Union’s emphasis on traceable imports encourages collaboration between producers and processors. Growth in premium blends, capsule systems, and cold brew variants reinforces Europe’s position as a hub for innovation and sustainable coffee value chain integration.
Asia-Pacific
Asia-Pacific captures a 24% share of the Coffee Value Chain Analysis Market in 2024, emerging as the fastest-growing region. Rising disposable incomes and urban lifestyles in China, Japan, India, and South Korea drive consumption. Expanding café culture and growing e-commerce channels support product diversification and international brand penetration. Countries like Vietnam and Indonesia serve as major production hubs, benefiting from favorable climates and government support for sustainable farming. Investments in value-added processing, local roasting, and export infrastructure enhance competitiveness across the regional coffee value chain.
Latin America
Latin America holds a 14% share in 2024, serving as a cornerstone of global coffee production and exports. Brazil, Colombia, and Mexico dominate due to extensive plantations, technological farming practices, and strong export networks. The region benefits from improving logistics and sustainability programs supported by international trade alliances. Producers increasingly adopt traceability systems and certifications to meet global demand for ethical sourcing. Despite exposure to climate variability, Latin America remains vital to maintaining supply stability and innovation in coffee cultivation, processing, and export efficiency.
Middle East & Africa
The Middle East & Africa region represents a 6% share in 2024, supported by growing coffee culture and expanding retail infrastructure. Ethiopia and Kenya lead in production, offering specialty Arabica beans with unique flavor profiles. The Gulf Cooperation Council (GCC) countries experience rising consumption through premium cafés and international coffee chains. Investments in roasting facilities and distribution centers enhance regional processing capacity. Africa’s focus on improving farmer training and sustainable cultivation practices strengthens its position within the global coffee value chain, creating opportunities for export diversification and economic growth.
Market Segmentations:
By Stage
- Production
- Processing
- Distribution
- Retail
- Consumption
By Product Type
- Arabica
- Robusta
- Liberica
- Others
By Application
- Beverages
- Food
- Pharmaceuticals
- Others
By Distribution Channel
- Online Stores
- Supermarkets/Hypermarkets
- Specialty Stores
- Others
By Region
- North America
- U.S.
- Canada
- Mexico
- Europe
- Germany
- France
- U.K.
- Italy
- Spain
- Rest of Europe
- Asia Pacific
- China
- Japan
- India
- South Korea
- South-east Asia
- Rest of Asia Pacific
- Latin America
- Brazil
- Argentina
- Rest of Latin America
- Middle East & Africa
- GCC Countries
- South Africa
- Rest of the Middle East and Africa
Competitive Landscape
The competitive landscape of the Coffee Value Chain Analysis Market includes major players such as Starbucks Corporation, Nestlé S.A., JDE Peet’s, Tata Coffee Limited, Lavazza Group, Illycaffè S.p.A., The Kraft Heinz Company, Peet’s Coffee, Caribou Coffee Company, and Blue Bottle Coffee. The market remains moderately consolidated, with these companies maintaining dominance through extensive sourcing networks, proprietary roasting techniques, and strong retail presence. Strategic priorities focus on sustainable sourcing, transparent supply chains, and digital integration across production and distribution. Leading brands invest in carbon-neutral operations, recyclable packaging, and fair-trade partnerships to align with evolving consumer ethics. Product innovation in specialty, instant, and ready-to-drink coffee categories strengthens competitiveness, while mergers and acquisitions expand regional footprints. Increasing emphasis on direct trade, traceability, and premium blends continues to define differentiation within the global coffee value chain.
Key Player Analysis
- Starbucks Corporation
- Nestlé S.A.
- JDE Peet’s
- Tata Coffee Limited
- Lavazza Group
- Illycaffè S.p.A.
- The Kraft Heinz Company
- Peet’s Coffee
- Caribou Coffee Company
- Blue Bottle Coffee
Recent Developments
- In August 2025, Keurig Dr Pepper (KDP) announced a major acquisition agreement to purchase JDE Peet's for €15.7 billion (approximately $18.4 billion). This deal will create Global Coffee Co., which is projected to become the world's largest pure-play coffee company with $16 billion in annual sales second only to Nestlé.
- In October 2025, Cropster, a global software provider for coffee businesses, announced the acquisition of Firescope, a South Korea-based developer of innovative roasting software.
- In October 2025, Clearstone Capital, a Canadian private equity firm, announced the acquisition of Brüst Beverages, an innovative producer of premium ready-to-drink protein coffee.
Report Coverage
The research report offers an in-depth analysis based on Stage, Product Type, Application, Distribution Channel and Region. It details leading market players, providing an overview of their business, product offerings, investments, revenue streams, and key applications. Additionally, the report includes insights into the competitive environment, SWOT analysis, current market trends, as well as the primary drivers and constraints. Furthermore, it discusses various factors that have driven market expansion in recent years. The report also explores market dynamics, regulatory scenarios, and technological advancements that are shaping the industry. It assesses the impact of external factors and global economic changes on market growth. Lastly, it provides strategic recommendations for new entrants and established companies to navigate the complexities of the market.
Future Outlook
- The market will experience steady growth driven by rising global coffee consumption.
- Sustainability and ethical sourcing will remain core priorities for leading producers.
- Technological adoption in processing and logistics will enhance efficiency and transparency.
- Premium and specialty coffee demand will expand across developed and emerging regions.
- Ready-to-drink and functional coffee products will create new growth opportunities.
- Climate-resilient farming practices will gain importance to stabilize long-term supply.
- Direct trade and farmer partnerships will strengthen value chain integration.
- Digital traceability systems will improve consumer confidence and quality assurance.
- Mergers and acquisitions will continue to reshape competitive dynamics globally.
- Asia-Pacific and Latin America will emerge as key growth hubs for production and consumption.
Request a Free Sample
Fill in your details and we'll send you a free sample report.
- Sample data tables & charts
- Research methodology
Need a Custom Version of This Report?
Tailor the scope, geography, or segments to your exact requirements.
- Custom geography or segment scope
- Direct access to our analyst team
Frequently Asked Questions
What is the current market size for the Coffee Value Chain Analysis Market, and what is its projected size in 2032?
At what Compound Annual Growth Rate is the Coffee Value Chain Analysis Market projected to grow between 2025 and 2032?
Which Coffee Value Chain Analysis Market segment held the largest share in 2024?
What are the primary factors fueling the growth of the Coffee Value Chain Analysis Market?
Who are the leading companies in the Coffee Value Chain Analysis Market?
Which region commanded the largest share of the Coffee Value Chain Analysis Market in 2024?
Table of Content
Chapter 1 Market Segmentation
- 1.1 Segmentation Framework
- 1.1.1 Product and Service Classification
- 1.1.2 Application and End-Use Classification
- 1.1.3 Technology and Solution Classification
- 1.1.4 Customer and Distribution Channel Classification
- 1.1.5 Geographic Segmentation
- 1.1.6 Market Segment Definitions and Boundaries
Chapter 2 Introduction
- 2.1 Report Objectives and Scope
- 2.2 Product Definition and Industry Terminology
- 2.3 Market Inclusions and Exclusions
- 2.4 Research Process
- 2.4.1 Primary Research and Expert Interviews
- 2.4.2 Secondary Research and Source Review
- 2.4.3 Top-Down and Bottom-Up Estimation
- 2.4.4 Data Triangulation and Verification
- 2.5 Market Size Measurement Basis
- 2.5.1 2024: USD 267,127.27 million → 2032: USD 355,305.73 million
- 2.6 Historical and Forecast Reference Periods
- 2.6.1 Base Year: 2024
- 2.6.2 Forecast Period: 2024-2032
- 2.7 Research Assumptions and Limitations
Chapter 3 Executive Summary
- 3.1 Market Snapshot and Key Findings
- 3.2 Base-Year Market Size, 2024
- 3.3 Forecast Market Size, 2032
- 3.4 Revenue and Volume Growth Outlook
- 3.5 Key Demand and Supply Indicators
- 3.6 Leading Market Segments
- 3.7 Fastest-Growing Market Opportunities
- 3.8 Regional Performance Highlights
- 3.9 Technology and Industry Transformation
- 3.10 Competitive Landscape Summary
- 3.11 Analyst View and Strategic Implications
Chapter 4 Global Coffee Value Chain Analysis Market Trends and Developments
- 4.1 Historical Industry Development
- 4.2 Recent Market Trends and Developments
- 4.3 Demand and Customer Behavior Trends
- 4.4 Technology and Product Innovation
- 4.5 Artificial Intelligence, Automation and Digitalization
- 4.6 Local Manufacturing and Supply Chain Realignment
- 4.7 Industry Partnerships, Mergers and Acquisitions
- 4.8 Sustainability and Circular Economy Developments
- 4.9 Government and Private Sector Investment Trends
- 4.10 Emerging Business Models and Commercialization
- 4.11 Industry Developments and Announcements
Chapter 5 Global Coffee Value Chain Analysis Market Production, Supply and Demand Analysis
- 5.1 Demand Trend and Consumption Analysis
- 5.2 Demand Forecast, 2024-2032
- 5.3 Production and Output Trend
- 5.4 Production and Output Forecast, 2024-2032
- 5.5 Installed Capacity and Capacity Utilization
- 5.6 Company-Wise Production Plants and Statistics
- 5.6.1 Installed Production Capacity
- 5.6.2 Actual Production
- 5.6.3 Planned Capacity and Expansion Targets
- 5.7 Supply Chain Structure and Procurement Trends
- 5.8 Supply-Demand Gap and Bottlenecks
- 5.9 Import Dependence and Sourcing Structure
- 5.10 Contract Manufacturing and Outsourcing
- 5.11 Regional Supply and Demand Concentration
Chapter 6 Global Coffee Value Chain Analysis Market Pricing Analysis
- 6.1 Pricing Structure and Measurement
- 6.2 Historical Pricing Trends
- 6.3 Pricing Outlook, 2024-2032
- 6.4 Average Selling Price and Unit Economics
- 6.5 Pricing by Product and Market Segment
- 6.6 Geographic Pricing Differences
- 6.7 Key Input, Energy, Labor and Logistics Costs
- 6.8 Contract Pricing and Purchasing Models
- 6.9 Pricing Sensitivity and Competitive Positioning
- 6.10 Price, Margin and Profitability Implications
Chapter 7 Global Coffee Value Chain Analysis Market Dynamics
- 7.1 Market Growth Drivers
- 7.1.1 Demand-Side Drivers
- 7.1.2 Technology and Innovation Drivers
- 7.1.3 Infrastructure and Investment Drivers
- 7.1.4 Regulatory and Policy Drivers
- 7.2 Market Restraints
- 7.2.1 Cost and Affordability Constraints
- 7.2.2 Technology and Adoption Barriers
- 7.2.3 Supply Chain and Operational Constraints
- 7.3 Market Challenges
- 7.3.1 Competitive Pressure and Margin Erosion
- 7.3.2 Skills, Infrastructure and Implementation Gaps
- 7.4 Emerging Market Opportunities
- 7.5 Market Dynamics Impact and Time-Horizon Assessment
Chapter 8 Global Coffee Value Chain Analysis Value Chain Analysis
- 8.1 Industry Value Chain Overview
- 8.2 Upstream Suppliers and Critical Inputs
- 8.3 Technology and Component Providers
- 8.4 Manufacturing or Service Delivery
- 8.5 Distribution, Channel Partners and Integrators
- 8.6 Downstream Applications and End Users
- 8.7 Value Addition and Profit Pools
- 8.8 Vertical Integration and Outsourcing
- 8.9 Supplier Concentration and Risk
- 8.10 Supply Chain Localization and Resilience
Chapter 9 Global Coffee Value Chain Analysis Market Regulations and Policies
- 9.1 Relevant Laws, Standards and Compliance Frameworks
- 9.2 Product, Service, Safety and Quality Requirements
- 9.3 Government Policies, Incentives and Subsidies
- 9.4 Imports, Exports and Trade Barriers
- 9.5 Public Procurement and Local Content Requirements
- 9.6 Environmental and Sustainability Compliance
- 9.7 Upcoming Policy Changes and Market Implications
Chapter 10 Global Coffee Value Chain Analysis Market Hotspots and Opportunities
- 10.1 Market Opportunity Mapping and Growth Hotspots
- 10.2 High-Growth Applications and Customer Groups
- 10.3 Underserved Markets and White-Space Opportunities
- 10.4 Emerging Technology and Product Opportunities
- 10.5 New Capacity and Investment Hotspots
- 10.6 Market Entry and Expansion Opportunities
- 10.7 Distribution and Partnership Opportunities
- 10.8 Near-Term and Long-Term Commercial Potential
- 10.9 Opportunity Attractiveness and Execution Risks
Chapter 11 Global Coffee Value Chain Analysis Market Outlook, 2024-2032
- 11.1 Market Size and Analysis
- 11.1.1 Revenue (Market Measurement: 2024: USD 267,127.27 million → 2032: USD 355,305.73 million)
- 11.1.2 Market Volume and Quantity Sold
- 11.1.3 Historical Market Size
- 11.1.4 Base-Year Market Size, 2024
- 11.2 Market Forecast, 2024-2032
- 11.2.1 Revenue Forecast to 2032
- 11.2.2 Volume Forecast to 2032
- 11.2.3 CAGR and Year-on-Year Growth
- 11.2.4 Incremental Revenue Opportunity
- 11.3 Forecast Assumptions and Scenario Analysis
- 11.3.1 Base-Case Forecast
- 11.3.2 Optimistic and Conservative Scenarios
- 11.3.3 Technology, Pricing and Policy Sensitivities
- 11.4 Market Attractiveness and Growth Outlook
Chapter 12 Global Coffee Value Chain Analysis Market Segmentation and Outlook
- 12.1 Segmentation Summary and Market Shares, 2024
- 12.2 Largest and Fastest-Growing Segments
- 12.3 Segment Growth Comparison
- 12.4 Segment Attractiveness and Priority Matrix
Chapter 13 Global Coffee Value Chain Analysis Geographic Market Outlook, 2024-2032
- 13.1 Regional Market Size and Share, 2024
- 13.2 Regional Market Forecast, 2024-2032
- 13.3 Regional Pricing, Production and Demand Differences
- 13.4 North America
- 13.4.1 United States
- 13.4.2 Canada
- 13.4.3 Mexico
- 13.5 Europe
- 13.5.1 Germany
- 13.5.2 France
- 13.5.3 Italy
- 13.5.4 United Kingdom
- 13.5.5 Spain
- 13.5.6 Poland
- 13.5.7 Russia
- 13.5.8 Netherlands
- 13.5.9 Belgium
- 13.5.10 Sweden
- 13.5.11 Denmark
- 13.5.12 Norway
- 13.5.13 Rest of Europe
- 13.6 Asia Pacific
- 13.6.1 China
- 13.6.2 India
- 13.6.3 Japan
- 13.6.4 South Korea
- 13.6.5 Thailand
- 13.6.6 Indonesia
- 13.6.7 Vietnam
- 13.6.8 Malaysia
- 13.6.9 Australia
- 13.6.10 Rest of Asia Pacific
- 13.7 Latin America
- 13.7.1 Brazil
- 13.7.2 Argentina
- 13.7.3 Colombia
- 13.7.4 Chile
- 13.7.5 Rest of Latin America
- 13.8 Middle East
- 13.8.1 Saudi Arabia
- 13.8.2 United Arab Emirates
- 13.8.3 Turkey
- 13.8.4 Israel
- 13.8.5 Iran
- 13.8.6 Rest of the Middle East
- 13.9 Africa
- 13.9.1 South Africa
- 13.9.2 Egypt
- 13.9.3 Nigeria
- 13.9.4 Morocco
- 13.9.5 Rest of Africa
- 13.10 Regional Investment, Policy and Supply Chain Differences
- 13.11 Regional Competitive Landscape
- 13.12 Geographic Growth Hotspots
Chapter 14 Global Coffee Value Chain Analysis Technology, Innovation and Sustainability Outlook
- 14.1 Technology Landscape and Maturity
- 14.2 Product, Process and Service Innovation
- 14.3 AI, Automation and Digital Tools in the Industry
- 14.4 Technology Adoption and Performance Benchmarking
- 14.5 Innovation Pipeline and R&D Investment
- 14.6 Patent and Intellectual Property Trends
- 14.7 Energy Efficiency and Resource Management
- 14.8 Sustainability, Recycling and Circularity
- 14.9 Technology Roadmap, 2024-2032
- 14.10 Risks of Obsolescence and Technology Substitution
Chapter 15 Global Coffee Value Chain Analysis Market Key Strategic Imperatives
- 15.1 Growth and Market Entry Priorities
- 15.2 High-Return Products and Segments
- 15.3 Pricing, Profitability and Cost Optimization
- 15.4 Technology Investment and Product Differentiation
- 15.5 Supply Chain Localization and Resilience
- 15.6 Distribution and Customer Acquisition
- 15.7 Partnership, Acquisition and Capacity Strategy
- 15.8 Regional Expansion Priorities
- 15.9 Short-, Medium- and Long-Term Actions
Chapter 16 Competition Outlook
- 16.1 Industry Competition Characteristics
- 16.2 Market Structure and Concentration
- 16.3 Market Share and Competitive Positioning, 2024
- 16.4 Company-Wise Revenue and Product Benchmarking
- 16.5 Production and Service Capacity Benchmarking
- 16.6 Technology, Pricing and Differentiation
- 16.7 Regional Footprint and Distribution Strength
- 16.8 Mergers, Acquisitions and Strategic Alliances
- 16.9 New Entrants and Competitive Threats
- 16.10 Porter's Five Forces and Industry Attractiveness
- 16.11 Competitive Outlook, 2024-2032
Chapter 17 Company Profiles
- 17.1 Company Coverage and Selection Criteria
- 17.2 Leading Market Participants – Standard Profile Structure
- 17.2.1 Business Description
- 17.2.2 Company Ownership and Geographic Presence
- 17.2.3 Product and Service Portfolio
- 17.2.4 Manufacturing and Operating Footprint
- 17.2.5 Production Capacity and Expansion Plans
- 17.2.6 Financial Performance and Investment
- 17.2.7 Market Share and Competitive Position
- 17.2.8 Technology and Innovation Capabilities
- 17.2.9 Strategic Alliances or Partnerships
- 17.2.10 Recent Developments
- 17.2.11 Growth Strategy and Outlook
- 17.3 Other Relevant Market Participants
Note: Every listed company is profiled on the structure shown under the first company. The company list is preliminary and may change based on research findings, market developments, data availability and client requirements.
Chapter 18 Disclaimer
- 18.1 Research and Forecast Disclaimer
- 18.2 Data Source and Estimation Limitations
Note: The depth of individual sections depends on data availability for this market. Volume, capacity, trade and other unit-based metrics are included where applicable.

