Market overview
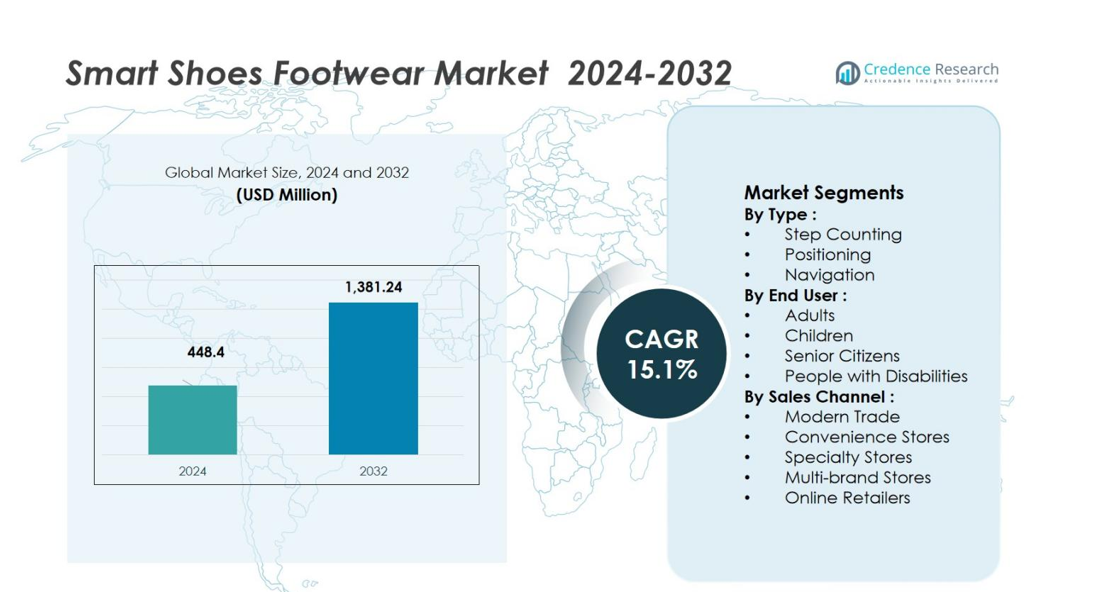
The Smart Shoes Footwear Market size was valued at USD 448.4 million in 2024 and is anticipated to reach USD 1,381.24 million by 2032, growing at a CAGR of 15.1% during the forecast period.
| REPORT ATTRIBUTE |
DETAILS |
| Historical Period |
2020-2023 |
| Base Year |
2024 |
| Forecast Period |
2025-2032 |
| Smart Shoes Footwear Market Size 2024 |
USD 448.4 million |
| Smart Shoes Footwear Market, CAGR |
15.1% |
| Smart Shoes Footwear Market Size 2032 |
USD 1,381.24 million |
The Smart Shoes Footwear Market is driven by key players such as Nike, Inc., Adidas Group, Under Armour, Inc., PUMA SE, Digitsole, Sole Power, LLC, Intellinium, and Powerlace Technology Inc. These companies leverage advancements in wearable technology, such as integrated sensors, GPS systems, and step-counting features, to strengthen their market positions. North America leads the market, holding 44.0% of the global share in 2024, supported by high consumer spending and the growing adoption of smart technologies in wearable products. Europe follows with 29.5% of the market share, driven by strong health-awareness trends and regulatory frameworks. The Asia Pacific region, capturing 15.8% of the market, is rapidly growing due to increasing disposable incomes and a rising interest in fitness and tech-integrated products. Other regions like Latin America and MEA show promising growth potential as tech-savvy consumer bases continue to emerge.
Market Insights
- The Smart Shoes Footwear Market size was USD 448.4 million in 2024 and is forecast to reach USD 1,381.24 million by 2032, representing a CAGR of 15.1 %.
- The Step Counting segment dominated the market in 2024 with a 42.5 % share, driven by consumer focus on fitness tracking and health monitoring.
- Key trends include growing integration of sensor technologies in footwear and increasing consumer demand for eco‑friendly, smart and sustainable products in the footwear sector.
- Major players such as Nike, Adidas, Under Armour, PUMA, Digitsole and others intensify rivalry through innovation, partnerships and global retail expansion, while maintaining leadership in brand and technology.
- Regionally, North America held 44.0 % of the market in 2023, followed by Europe at 29.5 % and Asia‑Pacific at 15.8 %, with Latin America and MEA emerging as growth hotspots.
Access crucial information at unmatched prices!
Request your sample report today & start making informed decisions powered by Credence Research Inc.!
Download Sample
Market Segmentation Analysis:
By Type:
In the Smart Shoes Footwear Market, the Step Counting segment holds the dominant position, accounting for 42.5% of the market share in 2024. The growth of this segment is driven by the increasing demand for fitness tracking and health monitoring features in footwear. Consumers, particularly fitness enthusiasts and health-conscious individuals, are increasingly seeking shoes equipped with step counting features to monitor their daily physical activity. As a result, this segment is expected to continue leading the market throughout the forecast period, fueled by the growing trend of integrating smart technology into everyday products.
- For instance, Under Armour’s HOVR series includes built-in sensors that record metrics such as stride length and cadence, syncing data to the MapMyRun app for activity analysis.
By End User:
Among the end-user categories, the Adults segment is the dominant sub-segment, holding a substantial 58.7% share of the market in 2024. This is driven by the rising popularity of wearable technology, particularly for fitness and health monitoring. Adults, especially those in the age range of 25-45 years, are increasingly adopting smart shoes for their daily activities, including walking, running, and fitness tracking. The growing awareness of the health benefits of such products, along with the increased integration of smart features like step counting and navigation, further strengthens the demand in this sub-segment.
- For instance, Xiaomi’s Mijia Smart Shoes, featuring Intel’s Curie module, enable users to track distance and calories directly through smartphone integration.
By Sales Channel:
The Online Retailers segment is the leading sub-segment in the Smart Shoes Footwear Market, capturing 38.3% of the market share in 2024. The increasing consumer preference for convenience, along with the rise of e-commerce platforms, has significantly contributed to the growth of this segment. Online sales provide greater accessibility to a wide variety of smart shoe models and brands, coupled with the ease of home delivery. This trend is further amplified by the availability of product reviews and detailed product descriptions online, making it a preferred choice for consumers in the smart footwear market.
Key Growth Drivers
Rising Health Awareness
The growing awareness of health and fitness is a primary driver for the Smart Shoes Footwear Market. Consumers are increasingly prioritizing physical well-being, leading to a surge in demand for wearable devices, including smart shoes. These shoes provide features like step counting, posture monitoring, and real-time feedback, enabling users to track and improve their physical activity. As fitness tracking becomes more ingrained in daily routines, the market for smart shoes is expected to experience continued growth, especially among health-conscious adults.
- For instance, Xiaomi’s Mijia Smart Sneakers, developed in collaboration with Intel, which use embedded motion sensors to analyze running form and calorie burn, storing data via the Mi Fit app.
Technological Advancements
Advancements in wearable technology are a significant growth driver for the smart shoes market. Manufacturers are incorporating innovative technologies such as sensor integration, Bluetooth connectivity, and GPS systems into footwear, enhancing the functionality and appeal of these products. These technological improvements allow for more precise tracking of physical activity, improved user experiences, and increased comfort. As smart shoes become more sophisticated, with features like navigation and posture correction, they are expected to capture a larger share of the overall footwear market.
- For instance, Nike’s Adapt BB basketball shoes incorporate self-lacing technology powered by Bluetooth, allowing users to adjust the fit through a mobile app.
Increasing Adoption of E-commerce
The rise in online shopping has substantially boosted the demand for smart shoes, making them more accessible to a wider audience. The growth of e-commerce platforms has facilitated the distribution of smart footwear globally, enabling consumers to explore a variety of products with ease. Online retailers also offer convenient delivery options and detailed product reviews, helping customers make informed purchasing decisions. This growing reliance on e-commerce for footwear purchases is expected to drive the expansion of the smart shoes market, especially among younger, tech-savvy consumers.
Key Trends & Opportunities
Integration of Smart Technology
The integration of advanced smart technology into shoes is a major trend in the market, presenting significant opportunities for growth. Consumers are increasingly seeking footwear that goes beyond traditional functions to include smart features like navigation, step tracking, and real-time health monitoring. As this trend gains traction, opportunities arise for brands to innovate and create shoes that offer additional functionality, such as personalized fitness recommendations or energy-harvesting capabilities. Companies investing in research and development to enhance these technologies are poised to capture a larger market share.
- For instance, Altra Running’s Torin IQ smart running shoes come equipped with pressure sensors, microchips, and Bluetooth connectivity to provide real-time feedback on impact force and running efficiency.
Eco-Friendly and Sustainable Footwear
Sustainability is becoming a growing trend in the footwear industry, and it is expected to influence the smart shoes market significantly. Consumers are becoming more eco-conscious, pushing manufacturers to adopt sustainable practices in their product design and manufacturing processes. Companies are increasingly exploring the use of recycled materials, biodegradable components, and energy-efficient technologies to create environmentally friendly smart shoes. This trend presents opportunities for brands to tap into the eco-conscious consumer base, offering products that align with both sustainability and advanced technology.
- For instance, Adidas launched the Futurecraft Loop Sneaker, a fully recyclable and carbon-neutral shoe designed to be returned and remade into new footwear, reducing waste and resource use.
Key Challenges
High Production Costs
One of the main challenges in the Smart Shoes Footwear Market is the high production costs associated with integrating advanced technologies. The cost of sensors, connectivity features, and durable materials can significantly increase the overall price of smart shoes, making them less affordable for price-sensitive consumers. This challenge limits the market’s potential in certain regions where consumers may not be willing to invest in high-priced products. Manufacturers must find ways to reduce production costs while maintaining product quality and advanced features to remain competitive in the market.
Consumer Education and Awareness
Despite the growing popularity of wearable technology, there is still a need for greater consumer education and awareness regarding the benefits and functionalities of smart shoes. Many potential customers may not fully understand how these shoes can improve their health or daily life. Overcoming this knowledge gap is crucial for driving market adoption. Companies need to invest in educating consumers through marketing campaigns, product demonstrations, and collaborations with fitness experts to highlight the value and benefits of integrating smart technology into footwear.
Regional Analysis
North America
In the smart shoes footwear market, the North America region held a dominant share of 44.0% in 2023. This leadership stems from high consumer spending power, widespread adoption of wearable technologies, and a strong presence of major brands. The region’s well-established retail networks and advanced e-commerce infrastructure support rapid distribution of smart footwear innovations. As health- and fitness-conscious consumers increasingly demand footwear that integrates step-counting, positioning, and navigation features, the North America market remains a critical growth arena for manufacturers focused on technology-driven footwear solutions.
Europe
Europe presents a significant regional market within the smart shoes sector, supported by increasing consumer interest in connected wearables and rigorous data protection standards that foster trust in smart products. The region accounted for 29.5% of the market share in 2023 and is expected to register the fastest CAGR in the forecast period. Key drivers include strong health-awareness trends, regulatory frameworks encouraging product innovation, and the presence of major European sports-footwear brands leveraging smart-shoe technology to gain market traction. The rising demand for both performance and lifestyle footwear is also contributing to market growth in this region.
Asia Pacific
The Asia Pacific region is emerging as a robust growth opportunity for smart shoes, driven by rising disposable incomes, growing fitness-wearable adoption, and rapid expansion of online retail channels. The region held 15.8% of the market share in 2023, and it is expected to see strong growth in the forecast period. Governments promoting active lifestyles, manufacturers ramping up production in China and India, and an increasing interest in tech-infused footwear further enhance regional momentum. As consumers in this region embrace connected products, Asia Pacific is poised to expand its contribution to the global smart shoes market significantly.
Latin America
Latin America is gradually gaining importance in the smart footwear market, supported by internet penetration, rising brand awareness, and younger demographics seeking connected products. Although the region’s share is smaller, holding 7.4% in 2023, it is showing solid growth potential. The expanding e-commerce landscape and a growing health- and tech-conscious consumer base are positioning Latin America as a regional growth frontier. As demand for wearable technology increases, manufacturers targeting this region can benefit from early-mover advantages and greater adoption of smart shoes in the coming years.
Middle East & Africa (MEA)
The Middle East & Africa (MEA) region represents a growing segment of the global smart-shoes market, supported by increasing urbanization, rising interest in fitness and sports, and improving online retail infrastructure. MEA accounted for 3.3% of the global market share in 2023. Although the region’s share is modest, its growth potential is significant as emerging economies within MEA adopt smart-wearable technologies. Manufacturers targeting this region can benefit from tailoring offerings to local consumer preferences and leveraging digital-first sales channels to drive further adoption of smart shoes.
Market Segmentations:
By Type :
- Step Counting
- Positioning
- Navigation
By End User :
- Adults
- Children
- Senior Citizens
- People with Disabilities
By Sales Channel :
- Modern Trade
- Convenience Stores
- Specialty Stores
- Multi-brand Stores
- Online Retailers
By Geography
- North America
- Europe
- Germany
- France
- U.K.
- Italy
- Spain
- Rest of Europe
- Asia Pacific
- China
- Japan
- India
- South Korea
- South-east Asia
- Rest of Asia Pacific
- Latin America
- Brazil
- Argentina
- Rest of Latin America
- Middle East & Africa
- GCC Countries
- South Africa
- Rest of the Middle East and Africa
Competitive Landscape
The competitive landscape of the smart shoes footwear market is shaped by major players such as Nike, Inc., Adidas Group, Under Armour, Inc., PUMA SE, Digitsole, Salted Venture Inc., Sole Power, LLC, Intellinium and Powerlace Technology Inc., each pursuing differentiated strategies across technology, design and distribution. These players leverage sensor‑integration, Bluetooth connectivity and embedded navigation capabilities to strengthen their market positioning, while also forging strategic partnerships and acquiring niche technology firms to bolster innovation. Competitive pressure is rising as new entrants attempt to undercut on cost and niche features, but incumbents maintain advantage via established brand equity, global retail networks and extensive R&D capabilities. Manufacturers increasingly invest in direct‑to‑consumer channels and omnichannel strategies to improve margins and tap younger, tech‑savvy consumer segments. As the market evolves, differentiation through sustainability, customization and data‑driven services is becoming a key battleground, and firms unable to rapidly scale or innovate may face margin erosion or falling behind in emerging regional growth zones.
Shape Your Report to Specific Countries or Regions & Enjoy 30% Off!
Key Player Analysis
- PUMA SE
- Digitsole
- Intellinium
- Under Armour, Inc.
- Adidas Group
- Powerlace Technology Inc.
- No New Folk Studio Inc.
- Salted Venture Inc.
- Nike, Inc.
- Sole Power, LLC
Recent Developments
- In October 2025 Nike, Inc. announced that it is developing a motorised footwear system in collaboration with Dephy, dubbed “Project Amplify”.
- In May 2025 Monitor (part of Båstadgruppen) announced a partnership with Quin to develop the world’s first connected smart safety shoes for workplace use, scheduled for launch in autumn 2025.
- In September 2025, Under Armour partnered with UNLESS to introduce three regenerative footwear styles built with plant‑based materials.
Report Coverage
The research report offers an in-depth analysis based on Type, End User, Sales Channel and Geography. It details leading market players, providing an overview of their business, product offerings, investments, revenue streams, and key applications. Additionally, the report includes insights into the competitive environment, SWOT analysis, current market trends, as well as the primary drivers and constraints. Furthermore, it discusses various factors that have driven market expansion in recent years. The report also explores market dynamics, regulatory scenarios, and technological advancements that are shaping the industry. It assesses the impact of external factors and global economic changes on market growth. Lastly, it provides strategic recommendations for new entrants and established companies to navigate the complexities of the market.
Future Outlook
- Smart shoes will become increasingly embedded in wellness ecosystems, enabling real‑time gait analysis, posture monitoring and fatigue tracking and thereby driving consumer adoption.
- The convergence of sensor technologies with footwear will open up new product tiers featuring advanced navigation, positioning and environmental awareness capabilities tailored for diverse use‑cases.
- Online retail will continue to dominate distribution growth as e‑commerce and omnichannel strategies enable broader global access and faster introduction of next‑generation smart footwear.
- Emerging markets in Asia‑Pacific, Latin America and MEA will play a pivotal role in expanding the overall addressable market as rising disposable incomes and tech readiness spur adoption.
- Integration of sustainable materials and circular design practices in smart shoes will become a key differentiator as environmentally conscious consumers demand eco‑friendly innovations.
- Partnerships between footwear brands, tech firms and sports/health platforms will accelerate innovation and ecosystem development, fueling differentiation and value‑added services.
- Data‑driven services such as personalized training insights, injury prevention alerts and predictive analytics will become an important revenue stream, shifting the smart shoes model beyond hardware.
- Price pressure and component‑cost decline will enable smart shoes to move from premium segments into more mainstream categories, widening the consumer base.
- As product complexity increases, regulators and manufacturers will face growing scrutiny around data privacy, cybersecurity and sensor integrity in footwear applications.
- Fierce competition and rapid technology turnover will challenge companies to scale effectively and protect margins, making innovation cadence and brand loyalty critical success factors.


