Market Overview:
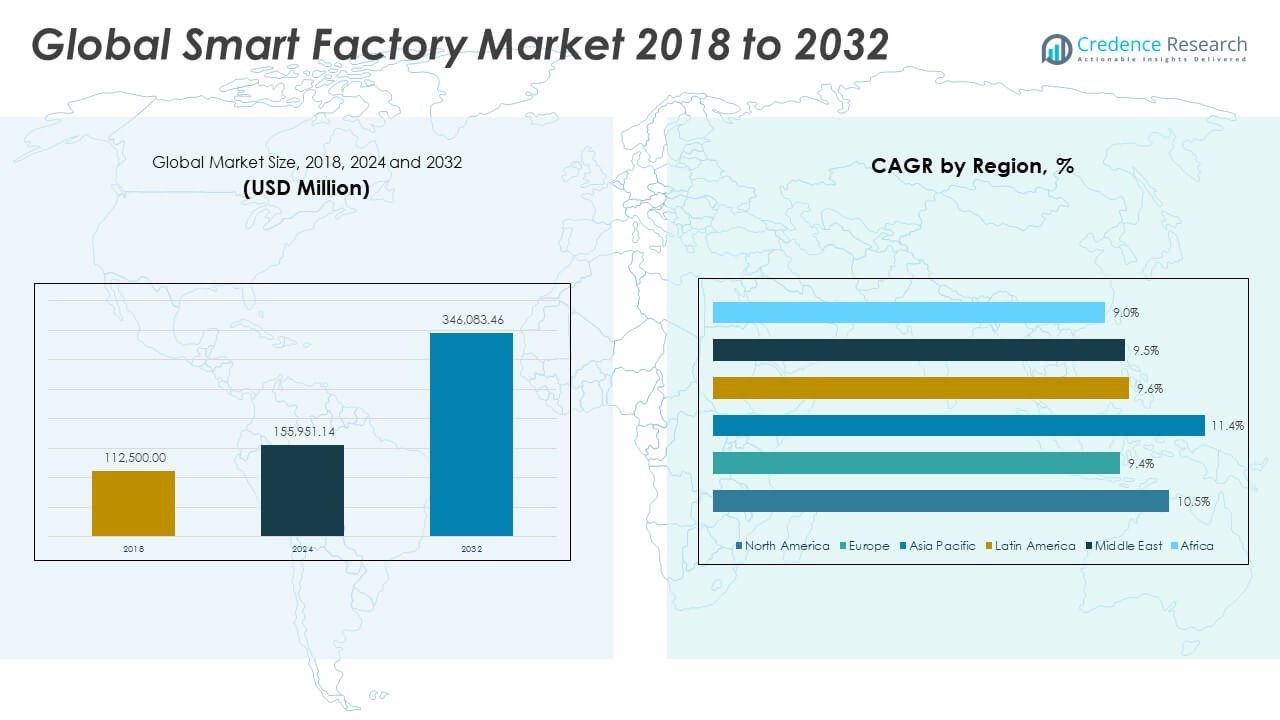
The Smart Factory Market size was valued at USD 112,500.00 million in 2018 to USD 155,951.14 million in 2024 and is anticipated to reach USD 346,083.46 million by 2032, at a CAGR of 10.52% during the forecast period.
| REPORT ATTRIBUTE |
DETAILS |
| Historical Period |
2020-2023 |
| Base Year |
2024 |
| Forecast Period |
2025-2032 |
| Smart Factory Market Size 2024 |
USD 155,951.14 million |
| Smart Factory Market, CAGR |
10.52% |
| Smart Factory Market Size 2032 |
USD 346,083.46 million |
The growth of the Smart Factory Market is driven by rapid advancements in industrial automation, the integration of IoT and AI technologies, and a growing emphasis on operational efficiency. Companies across manufacturing sectors are investing in smart solutions to enhance productivity, reduce downtime, and optimize supply chains. The demand for predictive maintenance, real-time data analytics, and remote monitoring has significantly increased, further accelerating the adoption of smart factory systems. Additionally, government initiatives promoting Industry 4.0 adoption are fostering favorable conditions for market expansion.
Regionally, North America and Europe lead the Smart Factory Market due to early adoption of advanced manufacturing technologies, strong digital infrastructure, and substantial investments by key industry players. The U.S., Germany, and the U.K. are particularly dominant owing to their robust industrial sectors and innovation-driven economies. Meanwhile, Asia Pacific is emerging as the fastest-growing region, supported by large-scale industrialization in countries like China, India, and South Korea. These nations are expanding their manufacturing bases and embracing automation to enhance global competitiveness, contributing significantly to regional market growth.
Access crucial information at unmatched prices!
Request your sample report today & start making informed decisions powered by Credence Research Inc.!
Download Sample
Market Insights:
- The Smart Factory Market was valued at USD 155,951.14 million in 2024 and is projected to reach USD 346,083.46 million by 2032, growing at a CAGR of 10.52%.
- Industrial automation, IoT, and AI integration are key drivers boosting smart factory adoption across manufacturing sectors.
- High initial costs and complex integration processes pose major restraints for small and mid-sized enterprises.
- North America leads the market due to early technological adoption and strong industrial infrastructure.
- Asia Pacific is the fastest-growing region, driven by rapid industrialization in China, India, and South Korea.
- Europe maintains steady growth with strong regulatory support and investment in Industry 4.0 initiatives.
- Real-time monitoring, predictive maintenance, and energy-efficient systems continue to gain traction globally.
Market Drivers
Adoption of Industrial IoT and Cyber-Physical Systems Is Transforming Manufacturing Workflows
The integration of the Industrial Internet of Things (IIoT) and cyber-physical systems is a major catalyst for the Smart Factory Market. Manufacturers implement interconnected sensors and devices to monitor and automate production environments. These systems facilitate real-time data collection, enabling instant decision-making and improved process control. It enhances transparency across the manufacturing value chain and drives operational precision. Smart factories become more agile and responsive to demand fluctuations. IIoT-enabled predictive maintenance reduces downtime and increases asset life. Cyber-physical systems support decentralized decision-making. The convergence of physical production and digital intelligence reshapes industrial operations globally.
Growing Emphasis on Cost Reduction and Productivity Optimization Fuels Market Demand
Manufacturers across sectors prioritize smart technologies to reduce costs and boost productivity. Automation minimizes human error, accelerates workflows, and cuts energy usage. The Smart Factory Market benefits from growing interest in lean manufacturing practices. Companies integrate robotics and automated material handling systems to streamline floor operations. It enhances throughput while optimizing resource allocation. By reducing machine idle time and improving supply chain visibility, organizations ensure maximum efficiency. Enterprises view smart factories as vital for staying competitive in global markets. The demand for scalable and cost-effective automation tools continues to expand.
Government-Led Industry 4.0 Initiatives Encourage Technology Deployment at Scale
Government initiatives promoting Industry 4.0 adoption have accelerated market momentum. National programs like Germany’s Industrie 4.0 and China’s Made in China 2025 prioritize automation, AI, and digital transformation. These initiatives offer funding, tax incentives, and training resources to manufacturers. The Smart Factory Market gains from regulatory frameworks that favor advanced manufacturing infrastructure. It strengthens collaboration between public institutions, technology firms, and industrial players. Standardized protocols and innovation hubs reduce entry barriers. Countries aim to modernize traditional manufacturing sectors through structured digitalization. These strategies drive large-scale adoption of smart technologies across various verticals.
- For example, Bosch’s leadership in the German Industrie 4.0 initiative showcases measurable advancements: its Stuttgart-Feuerbach plant implemented real-time wireless connectivity and 5G across operations, enabling instant, reliable transfer of data for collaborative robot and human workflows
High Demand for Real-Time Monitoring, Data Analytics, and Quality Control Solutions
Manufacturers increasingly rely on real-time insights to guide operational decisions. Advanced analytics tools and AI platforms enable factories to detect quality issues early and minimize defects. The Smart Factory Market responds to the demand for systems that ensure consistent product quality. It empowers organizations to fine-tune production parameters based on live feedback. Embedded sensors track performance indicators and alert managers to irregularities. This proactive approach improves customer satisfaction and reduces waste. Companies invest in scalable analytics solutions that support continuous improvement. The emphasis on data-driven quality assurance drives smart factory deployments across industries.
- For example, Bosch’s AI-based zero-defect production system is presently deployed in over 50 plants and 800 lines, employing advanced analytics and machine learning to detect and remedy process anomalies early preventing costly rework and scrap. Coupled with predictive maintenance tools, these systems contributed to Bosch’s reduction in unscheduled downtime and consistent quality improvements across its global network.
Market Trends
Integration of Edge Computing to Enhance Localized Decision-Making and Reduce Latency
Edge computing gains traction as manufacturers seek faster processing at the production level. It enables decentralized data analysis, reducing dependence on cloud connectivity. The Smart Factory Market experiences rising demand for edge-enabled solutions that process critical information on-site. It lowers response times and supports uninterrupted factory operations. Manufacturers deploy edge devices to monitor machine health and initiate corrective actions in real time. The trend reflects a shift toward distributed intelligence within industrial environments. Edge computing enhances security by limiting data exposure. Companies use it to maintain production continuity even in low-connectivity settings.
- Siemens, for example, has documented deployment of industrial edge gateways capable of processing over 40,000 data points per second in real-time for predictive maintenance and automated machine control.
Surge in Demand for Digital Twins to Optimize Production and Lifecycle Management
Digital twins create virtual replicas of physical assets, enabling real-time simulation and monitoring. Manufacturers use them to predict performance, improve design accuracy, and manage maintenance. The Smart Factory Market reflects increasing adoption of digital twin technology across sectors like automotive and aerospace. It allows manufacturers to detect anomalies before failures occur. These models offer insights into product behavior under varying conditions. Companies replicate entire production lines virtually to test process changes without disrupting operations. It supports lean development and reduces time-to-market. The growing use of digital twins marks a significant trend in advanced manufacturing.
- For instance, in the aerospace sector, digital twin deployments by GE Aviation have enabled component failure prediction with accuracy rates surpassing 95%, ensuring higher reliability and extending asset lifecycles.
Rising Focus on Sustainable and Energy-Efficient Manufacturing Practices
Sustainability has emerged as a strategic priority for manufacturers worldwide. Firms implement green technologies and resource optimization tools to meet regulatory and consumer expectations. The Smart Factory Market aligns with this trend through energy-monitoring systems and carbon footprint analytics. It enables organizations to identify high-consumption areas and minimize waste. Smart energy grids and automated climate controls further reduce environmental impact. Manufacturers invest in cleaner processes while maintaining profitability. Compliance with ESG standards drives innovation in production design. Sustainability remains a driving theme across digital transformation initiatives in factories.
Expansion of Human-Machine Collaboration and Collaborative Robotics (Cobots)
Collaborative robots are increasingly deployed to work alongside human operators. These cobots assist in precision tasks, heavy lifting, and repetitive operations. The Smart Factory Market observes a growing preference for flexible robotic systems that improve workforce productivity. It allows manufacturers to address labor shortages and ensure ergonomic safety. Cobots support adaptive manufacturing environments where changes in demand require frequent reconfigurations. Manufacturers integrate AI-enabled robots for assembly, packaging, and quality inspection. These systems adapt quickly to new workflows and enhance production agility. Human-machine collaboration reshapes traditional factory dynamics.
Market Challenges Analysis
High Initial Investment and Integration Complexity Limit Adoption Among SMEs
The cost of transitioning to a smart factory remains a key concern for small and medium enterprises. High capital requirements for automation, AI, and IoT integration deter budget-constrained manufacturers. The Smart Factory Market faces slow uptake among firms that lack internal IT infrastructure or technical expertise. It takes time and skilled personnel to configure and integrate various hardware and software platforms. Organizations also face challenges in scaling pilot projects across multiple facilities. Ensuring compatibility among legacy systems and modern technologies complicates implementation. SMEs struggle to justify ROI in the short term. Financial and technical barriers restrict broader adoption across developing regions.
Cybersecurity Risks and Data Management Complexities Threaten Operational Integrity
Connected systems and real-time data exchange increase the surface area for cyber threats. Hackers target industrial control systems, IoT sensors, and cloud platforms to disrupt operations or steal data. The Smart Factory Market contends with rising concerns over data privacy, IP theft, and ransomware attacks. It demands rigorous cybersecurity protocols, encryption, and access control systems. Manufacturers must also manage vast volumes of structured and unstructured data. Inadequate data governance leads to inefficiencies and decision-making errors. Cyber incidents can cause significant financial losses and damage reputations. Security remains a critical hurdle in scaling smart factory initiatives.
Market Opportunities
Expansion in Emerging Economies Creates New Demand for Automation Solutions
Rapid industrialization across Asia Pacific, Latin America, and the Middle East opens avenues for market growth. Manufacturers in these regions aim to modernize production lines and increase export competitiveness. The Smart Factory Market can leverage this momentum by offering modular and cost-effective solutions. It provides opportunities for technology vendors to partner with local firms. Governments promote automation through policy support and investment in digital infrastructure. Smart factory adoption in emerging economies addresses efficiency gaps and workforce challenges. Growth in these markets expands the global footprint of smart manufacturing.
Rising Customization Needs and Flexible Manufacturing Drive Technology Innovation
Consumers increasingly demand personalized products delivered at high speed. Manufacturers invest in flexible systems that can rapidly switch between product lines. The Smart Factory Market supports these needs through AI-driven scheduling and real-time feedback systems. It encourages innovation in adaptive machinery, digital workflows, and decentralized production. Companies design smart factories to support batch-size-one production models. This trend creates new opportunities for software developers and automation hardware providers. It strengthens the role of smart manufacturing in next-generation supply chains.
Market Segmentation Analysis:
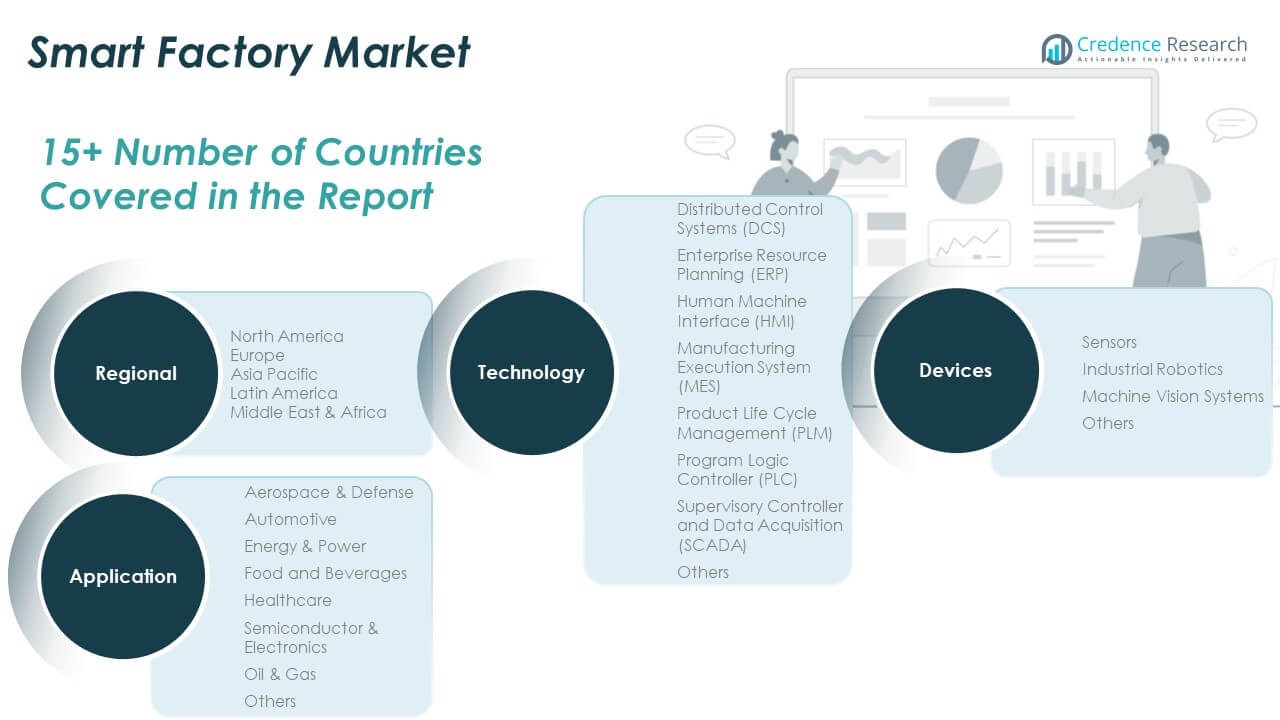
The Smart Factory Market is segmented by technology, application, and field devices, each contributing uniquely to its expansion.
By technology, Manufacturing Execution Systems (MES) dominate due to their central role in managing production operations. Distributed Control Systems (DCS), Programmable Logic Controllers (PLC), and Supervisory Control and Data Acquisition (SCADA) systems maintain steady demand in process industries. Enterprise Resource Planning (ERP) and Product Life Cycle Management (PLM) systems support seamless integration between business functions and production units. Human Machine Interfaces (HMI) facilitate real-time monitoring, enhancing operator efficiency. The market benefits from diverse technology adoption tailored to operational requirements.
- For example, BMW’s Regensburg facility implemented adaptive finishing cells driven by Siemens Opcenter MES, combined with AI and robotics. This real deployment resulted in paint micro-defects being cut by 34%, a rise in first-pass quality from 91% to 98%, and autonomous cell processing of 1,800 car bodies daily.
By application, the Smart Factory Market sees high penetration in the automotive and semiconductor sectors, where precision, speed, and scalability are critical. Energy & power and oil & gas industries invest in automation to improve asset reliability and reduce downtime. Food & beverages and healthcare sectors deploy smart solutions for regulatory compliance and quality control. Aerospace & defense leverage advanced systems for production optimization.
By field devices, sensors form the backbone of real-time data acquisition. Industrial robotics drive automation and labor efficiency across multiple sectors. Machine vision systems support quality inspection, defect detection, and process control. Each field device segment reinforces the growing demand for intelligent, interconnected manufacturing environments.
- For example, at BMW’s Regensburg plant, adaptive finishing cells use stroboscopic cameras to segment clear-coat textures in real time. Heat maps are streamed to the MES, enabling closed-loop control and showcasing AI-driven sensor arrays for precise defect detection and quality validation.
Segmentation:
By Technology
- Distributed Control Systems (DCS)
- Enterprise Resource Planning (ERP)
- Human Machine Interface (HMI)
- Manufacturing Execution System (MES)
- Product Life Cycle Management (PLM)
- Programmable Logic Controller (PLC)
- Supervisory Control and Data Acquisition (SCADA)
- Others
By Application
- Aerospace & Defense
- Automotive
- Energy & Power
- Food and Beverages
- Healthcare
- Semiconductor & Electronics
- Oil & Gas
- Others
By Field Devices
- Sensors
- Industrial Robotics
- Machine Vision Systems
- Others
By Region
- North America – U.S., Canada, Mexico
- Europe – UK, France, Germany, Italy, Spain, Russia, Rest of Europe
- Asia Pacific – China, Japan, South Korea, India, Australia, Southeast Asia, Rest of APAC
- Latin America – Brazil, Argentina, Rest of Latin America
- Middle East – GCC Countries, Israel, Turkey, Rest of Middle East
- Africa – South Africa, Egypt, Rest of Africa
Regional Analysis:
The North America Smart Factory Market size was valued at USD 27,337.50 million in 2018 to USD 37,209.01 million in 2024 and is anticipated to reach USD 82,403.09 million by 2032, at a CAGR of 10.5% during the forecast period. North America accounted for 23.85% of the global market share in 2024. North America leads in digital manufacturing due to its strong industrial base and advanced technology infrastructure. The presence of leading automation companies and continuous investment in R&D strengthens its position. It benefits from early adoption of robotics, AI, and IoT in key sectors like automotive, aerospace, and electronics. The U.S. drives most of the regional demand with its focus on smart manufacturing hubs and innovation zones. Canada contributes through energy, food, and machinery industries modernizing their production systems. The market grows steadily as enterprises seek to optimize labor and improve safety. Government-backed initiatives, such as smart manufacturing programs, encourage broader implementation.
The Europe Smart Factory Market size was valued at USD 20,733.75 million in 2018 to USD 27,146.83 million in 2024 and is anticipated to reach USD 55,391.58 million by 2032, at a CAGR of 9.4% during the forecast period. Europe accounted for 17.41% of the global market share in 2024. Europe maintains its leadership in Industry 4.0 adoption driven by strong policy support and cross-industry collaboration. Germany dominates with its robust engineering sector and commitment to digital transformation. France, Italy, and the UK expand their automation capabilities in pharmaceuticals, chemicals, and consumer goods. The region emphasizes energy efficiency and compliance, making smart factory solutions attractive. It sees growing demand for predictive maintenance and process optimization tools. The European Union funds several digital manufacturing programs that support SMEs and startups.
The Asia Pacific Smart Factory Market size was valued at USD 46,485.00 million in 2018 to USD 66,130.43 million in 2024 and is anticipated to reach USD 155,910.87 million by 2032, at a CAGR of 11.4% during the forecast period. Asia Pacific accounted for 42.41% of the global market share in 2024. Asia Pacific holds the largest share due to rapid industrialization, expanding manufacturing capacity, and policy-driven digital initiatives. China dominates the region’s growth with massive investments in automation and robotics across electronics and automotive sectors. Japan and South Korea lead in precision manufacturing and innovation in AI-based factory systems. India accelerates adoption through its Make in India campaign and digital economy reforms. The region witnesses significant demand from textile, food, and energy industries. It benefits from a large skilled workforce and cost-effective infrastructure. Cross-border supply chain integration boosts the need for smart solutions.
The Latin America Smart Factory Market size was valued at USD 7,751.25 million in 2018 to USD 10,649.90 million in 2024 and is anticipated to reach USD 22,069.74 million by 2032, at a CAGR of 9.6% during the forecast period. Latin America accounted for 6.83% of the global market share in 2024. Latin America shows steady growth in smart manufacturing driven by modernization of traditional industries. Brazil leads the market with initiatives in automotive, energy, and food processing sectors. Mexico supports smart factory implementation through export-driven industries like electronics and aerospace. It seeks to improve productivity and reduce dependency on manual labor. The market gains traction from local automation providers expanding their offerings. Public-private partnerships enhance digital training and technology transfer. Challenges like regulatory complexity and infrastructure gaps persist, yet progress continues.
The Middle East Smart Factory Market size was valued at USD 5,692.50 million in 2018 to USD 7,515.83 million in 2024 and is anticipated to reach USD 15,471.83 million by 2032, at a CAGR of 9.5% during the forecast period. The Middle East accounted for 4.82% of the global market share in 2024. The Middle East accelerates digital transformation in industrial sectors such as oil and gas, chemicals, and logistics. The UAE and Saudi Arabia drive adoption with national strategies like Vision 2030 that prioritize smart infrastructure. It witnesses rising demand for remote operations, safety automation, and predictive analytics. Industrial zones and free trade areas create platforms for tech investment. The region also focuses on renewable energy and water management, where smart systems improve efficiency. Government-funded innovation hubs attract foreign tech firms and local startups. The market benefits from increasing awareness of cybersecurity and digital resilience. It positions itself as a regional hub for advanced manufacturing solutions.
The Africa Smart Factory Market size was valued at USD 4,500.00 million in 2018 to USD 7,299.15 million in 2024 and is anticipated to reach USD 14,836.34 million by 2032, at a CAGR of 9.0% during the forecast period. Africa accounted for 4.68% of the global market share in 2024. Africa represents an emerging market with growing interest in smart manufacturing to enhance local industrial productivity. South Africa leads with early-stage implementation in mining, automotive, and consumer goods sectors. Nigeria and Kenya invest in digital infrastructure to attract tech-driven industries. The region focuses on improving power reliability and supply chain automation. It relies on foreign partnerships and aid-driven programs for skill development and system integration. Manufacturers explore low-cost automation and mobile-based factory solutions to overcome labor shortages. Infrastructure limitations and digital literacy gaps remain key challenges.
Shape Your Report to Specific Countries or Regions & Enjoy 30% Off!
Key Player Analysis:
- ABB Ltd.
- Cognex Corporation
- Siemens AG
- Schneider Electric SE
- Yokogawa Electric Corporation
- KUKA AG
- Rockwell Automation Inc.
- Honeywell International Inc.
- Robert Bosch GmbH
- Mitsubishi Electric Corporation
- Fanuc Corporation
- Emerson Electric Co.
- FLIR Systems Inc.
Competitive Analysis:
The Smart Factory Market features strong competition among global technology providers, automation firms, and industrial software vendors. Key players include Siemens, ABB, Schneider Electric, Rockwell Automation, Honeywell, and Mitsubishi Electric. These companies focus on expanding their portfolios through AI integration, edge computing, and IIoT-based platforms. It drives competition through strategic collaborations, acquisitions, and product innovations aimed at improving factory intelligence and flexibility. Companies emphasize scalable solutions tailored to various industry verticals. New entrants offer niche technologies and cloud-native platforms that challenge traditional automation models. The market witnesses growing demand for customizable and interoperable systems. Competitive intensity remains high across mature and emerging regions.
Recent Developments:
- In July 2025, ABB introduced three new families of factory robots tailored for the Chinese market, enabling mid-sized companies to accelerate their transition to smart factory environments.
- In May 2025, Cognex Corporation formed a partnership with IMA E-COMMERCE to integrate AI-powered vision systems and barcode readers into logistics automation.
- In April 2025, Siemens AG announced the acquisition of Dotmatics, strengthening its position in digital transformation for smart manufacturing. Additionally, its planned acquisition of Altair in 2025 is aimed at boosting its offerings in simulation and automation, both central to the next generation of smart factories.
- In June 2024, ABB launched its OmniCore robotics control platform enhancing flexibility and intelligence across its complete line of robots—both updates directly advancing smart manufacturing solutions.
Market Concentration & Characteristics:
The Smart Factory Market is moderately concentrated, with a few dominant players holding significant global share. It reflects high entry barriers due to capital intensity and the need for specialized expertise. The market combines hardware, software, and service components, creating a dynamic and integrated ecosystem. Demand is driven by industrial automation, real-time analytics, and AI-enhanced control systems. It favors providers that deliver end-to-end solutions with global support capabilities. Customization, scalability, and cybersecurity compliance shape product differentiation. Rapid technological advancement and evolving manufacturing requirements continue to define its competitive landscape.
Report Coverage:
The research report offers an in-depth analysis based on technology, application, and field devices. It details leading market players, providing an overview of their business, product offerings, investments, revenue streams, and key applications. Additionally, the report includes insights into the competitive environment, SWOT analysis, current market trends, as well as the primary drivers and constraints. Furthermore, it discusses various factors that have driven market expansion in recent years. The report also explores market dynamics, regulatory scenarios, and technological advancements that are shaping the industry. It assesses the impact of external factors and global economic changes on market growth. Lastly, it provides strategic recommendations for new entrants and established companies to navigate the complexities of the market.
Future Outlook:
- AI-powered predictive maintenance will see expanded deployment across process-heavy industries.
- Cloud-native platforms and edge computing will become standard in next-generation factory systems.
- Robotics integration will extend beyond assembly lines into logistics, inspection, and materials handling.
- Digital twins will play a central role in optimizing product design, testing, and performance monitoring.
- Small and mid-sized enterprises will increase adoption through modular, low-cost smart factory solutions.
- Sustainability goals will drive demand for energy-efficient automation and carbon tracking systems.
- Industrial cybersecurity will evolve rapidly to protect increasingly connected factory ecosystems.
- Government incentives and national digitalization programs will boost smart manufacturing infrastructure.
- Regional expansion will continue, with Asia Pacific emerging as the primary growth engine.
- Cross-sector collaboration between tech providers, manufacturers, and research institutions will shape innovation.


