Smart Shopping Cart Market By Technology (Bar Codes, RFIDs, ZigBee); By Mode of Sales (Direct, Distributor); By Application (Shopping Malls, Supermarket) – Growth, Share, Opportunities & Competitive Analysis, 2024 – 2032

Report ID: 15466 | Report Format : Excel, PDF

Market Overview

The Smart Shopping Cart Market was valued at USD 2,338.7 million in 2024 and is projected to reach USD 16,952.2 million by 2032, growing at a CAGR of 28.10% during the forecast period (2024–2032).

REPORT ATTRIBUTE DETAILS
Historical Period 2020-2023
Base Year 2024
Forecast Period 2025-2032
Smart Shopping Cart Market Size 2024 USD 2,338.7 million
Smart Shopping Cart Market, CAGR 28.10%
Smart Shopping Cart Market Size 2032 USD 16,952.2 million


The Smart Shopping Cart market is led by major players such as AiFi Inc., Caper Inc., Fujitsu Limited, IBM Corporation, Microsoft Corporation, SAP SE, Cust2mate Ltd., Grabango Co., and Walmart Inc. These companies dominate through advanced AI, IoT, and computer vision technologies that enhance automated checkout and data-driven retail management. North America remains the leading region, accounting for 34% of the global market share in 2024, driven by strong technology adoption and large retail networks. Europe and Asia-Pacific follow, supported by expanding smart retail infrastructure and increasing investments in digital transformation across supermarkets and hypermarkets.

Smart Shopping Cart Market size

Market Insights

  • The Smart Shopping Cart market was valued at USD 2,338.7 million in 2024 and is projected to reach USD 16,952.2 million by 2032, growing at a CAGR of 28.10% during the forecast period.
  • Key market drivers include rising adoption of AI, IoT, and RFID technologies that enhance operational efficiency, automate checkout, and improve customer convenience.
  • Market trends show increasing demand for contactless shopping, predictive analytics integration, and smart retail expansion in supermarkets and hypermarkets, with the supermarket segment holding 67% share in 2024.
  • The competitive landscape features companies such as AiFi Inc., Caper Inc., Fujitsu Limited, IBM, Microsoft, and Cust2mate Ltd., focusing on partnerships and real-time data platforms to enhance customer experience.
  • North America leads with 34% market share, followed by Europe at 27% and Asia-Pacific at 28%, driven by strong retail digitalization and expanding smart shopping infrastructure.

Access crucial information at unmatched prices!

Request your sample report today & start making informed decisions powered by Credence Research Inc.!

Download Sample

Market Segmentation Analysis:

By Technology

The RFID segment dominated the Smart Shopping Cart market in 2024, accounting for over 52% of the market share. RFID technology enables real-time item tracking, faster billing, and reduced checkout time, improving operational efficiency for retailers. Its seamless integration with IoT and AI platforms enhances inventory visibility and reduces human error. Bar code technology remains cost-effective for smaller retailers, while ZigBee offers reliable wireless communication for advanced, interconnected retail environments. Growing investment in smart retail infrastructure continues to strengthen RFID adoption globally.

  • For instance, in April 2024, Amazon announced it was removing its “Just Walk Out” technology from all Amazon Fresh grocery stores in the U.S. and replacing it with the Dash Cart, a “smart shopping cart”.

By Mode of Sales:

The direct sales segment led the market with a share exceeding 60% in 2024, driven by large-scale retailers and technology partners seeking customized smart cart solutions. Direct sales allow vendors to offer integrated hardware–software packages tailored to client needs, ensuring better data security and performance monitoring. Distributors play a key role in expanding reach across small and medium retail chains, particularly in emerging markets. Increasing retailer preference for vendor-managed services and end-to-end implementation boosts the direct sales channel’s dominance.

  • For instance, Fujitsu did collaborate with AEON Retail, deploying AI-based video analysis and other retail technology solutions across a number of stores, including a 2021 deployment of an AI-powered operations system in 76 stores.

By Application:

Supermarkets emerged as the leading application segment, capturing around 67% of the global market share in 2024. The strong growth stems from higher foot traffic, large product assortments, and the need to reduce checkout congestion. Smart carts equipped with digital payment systems and product recommendation displays enhance customer engagement and basket value. Shopping malls are gradually adopting the technology to improve shopper convenience and streamline retail operations. Rising demand for contactless shopping and automation further accelerates smart cart adoption in supermarkets worldwide.

Key Growth Drivers

Rising Adoption of Automated Retail Technologies

The growing integration of automation, artificial intelligence, and Internet of Things (IoT) in retail environments is a major driver of the Smart Shopping Cart market. Retailers are adopting smart carts equipped with sensors, RFID scanners, and image recognition systems to automate billing and enhance operational efficiency. These technologies enable real-time inventory tracking, reduce checkout time, and improve customer convenience. Large retailers are deploying AI-driven analytics to understand shopping behavior and personalize promotions. The demand for automation to minimize labor dependency and optimize in-store management continues to accelerate market adoption globally.

  • For instance, Walmart announced the expansion of an AI-powered logistics platform for its supply chain. Walmart tested digital shelf labels in some stores, which use a mobile app to instantly update prices and give associates more time to assist customers.

Expanding Supermarket and Hypermarket Networks

The global expansion of supermarkets and hypermarkets significantly supports smart shopping cart demand. These large retail formats require efficient systems to handle high customer volumes and diverse product ranges. Smart carts simplify product scanning, reduce queue times, and provide instant digital payment options, enhancing overall customer satisfaction. Retail chains are prioritizing digital transformation to attract tech-savvy consumers and streamline inventory management. The increasing establishment of organized retail infrastructure, particularly in Asia-Pacific and the Middle East, is creating substantial opportunities for smart cart integration across modern retail stores.

  • For instance, Carrefour, operated by Majid Al Futtaim in the UAE, has launched various AI-powered initiatives to enhance the in-store experience, including pilot programs for AI-powered, checkout-free stores.

Growing Consumer Preference for Contactless Shopping

Consumer inclination toward contactless shopping experiences has surged since the pandemic, driving smart cart adoption. Shoppers increasingly favor solutions that minimize human contact, reduce waiting times, and ensure secure payments. Smart shopping carts equipped with touchless payment modules and self-checkout interfaces meet these expectations. Retailers benefit from enhanced customer retention and reduced operational bottlenecks. The integration of digital wallets, QR-based billing, and loyalty programs into smart carts further promotes seamless shopping. Rising awareness of hygiene, combined with the convenience of automated transactions, continues to fuel the adoption of these intelligent systems.

Key Trends & Opportunities

Integration of Artificial Intelligence and Predictive Analytics

AI-driven smart carts represent a major trend in the retail sector, providing data-driven insights and personalized recommendations. Retailers are leveraging predictive analytics to optimize inventory planning and understand purchasing patterns. Smart carts can analyze customer journeys, suggest complementary products, and deliver targeted promotions in real time. These features not only improve sales but also strengthen customer engagement. With increasing data availability and advanced analytics tools, retailers are adopting AI-powered smart carts to enhance the overall in-store experience and support strategic decision-making in pricing and marketing.

  • For instance, Amazonintegrated AI-based predictive systems into its Dash Cart technology, which uses computer vision and sensor fusion to identify items and offer product recommendations based on a customer’s shopping list, past purchases, and store-specific promotions. 

Expansion of Smart Retail Ecosystems in Emerging Markets

Emerging economies are presenting vast opportunities for smart shopping cart manufacturers due to rapid urbanization and rising disposable incomes. Governments and private investors are supporting smart city projects and digital retail transformation. Retailers in countries such as India, Brazil, and Indonesia are modernizing stores to integrate IoT-enabled systems and enhance shopping convenience. The shift from traditional retail to organized formats is boosting technology adoption. Local partnerships and affordable product innovations are helping vendors tap into these high-growth markets, creating long-term opportunities for smart cart penetration.

Key Challenges

High Initial Investment and Integration Costs

The high upfront cost of smart shopping cart systems remains a critical challenge for widespread adoption. Implementing RFID technology, AI-driven software, and wireless communication systems demands significant capital expenditure. Small and medium retailers often struggle to justify these investments due to tight profit margins and uncertain ROI. Additionally, integrating smart carts with existing point-of-sale systems and store networks can be complex and time-consuming. The lack of standardized communication protocols between hardware and software further increases deployment challenges, especially across diverse retail environments.

Data Privacy and Security Concerns

Smart shopping carts rely heavily on customer data collection and wireless communication, raising concerns about data privacy and cybersecurity. Retailers must ensure compliance with regulations such as GDPR and CCPA to protect sensitive user information. Unauthorized data access, tracking misuse, or payment breaches can damage consumer trust and lead to financial losses. Maintaining secure data transmission between smart carts, store servers, and cloud platforms remains a technical challenge. Addressing these security vulnerabilities through robust encryption, authentication protocols, and transparent data policies is essential for long-term market sustainability.

Regional Analysis

North America:

North America dominated the Smart Shopping Cart market in 2024, holding about 34% of the global market share. The region’s growth is driven by high adoption of advanced retail technologies and strong investments by supermarket chains such as Walmart and Kroger. Widespread use of RFID, AI, and IoT-enabled systems enhances checkout efficiency and customer analytics. The U.S. remains the key contributor, supported by well-developed retail infrastructure and consumer preference for contactless shopping. Continuous innovation and early technology integration maintain North America’s leadership in the global market.

Europe:

Europe accounted for around 27% of the market share in 2024, supported by growing retail digitalization and sustainability-focused smart store initiatives. Countries such as Germany, the U.K., and France are rapidly adopting smart carts to improve store efficiency and customer convenience. Retailers prioritize eco-friendly materials and energy-efficient smart carts to align with EU sustainability goals. Increasing investments in AI-based retail systems and enhanced payment integration strengthen market penetration. European supermarkets are focusing on smart shopping solutions to attract tech-savvy customers and optimize in-store operations.

Asia-Pacific:

Asia-Pacific held about 28% of the global market share in 2024, emerging as the fastest-growing regional market. Expansion of organized retail, rising disposable income, and rapid urbanization fuel adoption. Countries such as China, Japan, South Korea, and India are investing heavily in smart retail and IoT-based automation. Local and international retailers are integrating digital carts to enhance operational efficiency and customer experience. The region’s growing smartphone penetration and preference for cashless transactions further drive market growth. Government support for smart infrastructure accelerates technology implementation across urban shopping centers.

Latin America:

Latin America represented around 7% of the Smart Shopping Cart market in 2024, supported by gradual modernization of retail networks. Brazil, Mexico, and Chile lead regional adoption, driven by expanding supermarket chains and rising demand for seamless shopping experiences. Retailers are adopting cost-effective RFID and barcode-based carts to enhance checkout convenience. Growing middle-class populations and improving digital infrastructure are creating favorable conditions for technology integration. However, high deployment costs and limited awareness still restrain widespread adoption, though market growth remains steady with ongoing retail transformation.

Middle East & Africa:

The Middle East & Africa accounted for about 4% of the global market share in 2024, showing gradual progress in smart retail adoption. The United Arab Emirates and Saudi Arabia lead with heavy investments in smart store technologies under national digital transformation agendas. Modern shopping malls and hypermarkets are integrating intelligent cart systems to enhance shopper experience. Africa’s growth is emerging, supported by expanding urban retail spaces and improving internet access. Although market penetration remains low, increasing government and private retail investments are expected to boost regional adoption through 2032.

Market Segmentations:

By Technology

  • Bar Codes
  • RFIDs
  • ZigBee

By Mode of Sales

  • Direct
  • Distributor

By Application

  • Shopping Malls
  • Supermarket

By Geography

  • North America
    • U.S.
    • Canada
  • Europe
    • Germany
    • France
    • U.K.
    • Italy
    • Spain
    • Rest of Europe
  • Asia Pacific
    • China
    • Japan
    • India
    • South Korea
    • South-east Asia
    • Rest of Asia Pacific
  • Latin America
    • Brazil
    • Mexico
    • Rest of Latin America
  • Middle East & Africa
    • GCC Countries
    • South Africa
    • Rest of Middle East and Africa

Competitive Landscape

The Smart Shopping Cart market is moderately consolidated, with a mix of global technology firms and specialized retail automation providers. Leading players such as AiFi Inc., Caper Inc., Fujitsu Limited, IBM Corporation, Microsoft Corporation, and Walmart Inc. dominate through strong R&D capabilities and established retail partnerships. Companies like Cust2mate Ltd., Veeve Inc., Grabango Co., and Focal Systems Inc. focus on AI-powered solutions that integrate machine vision and real-time analytics to enhance checkout automation. Strategic collaborations, mergers, and product innovations remain central to maintaining competitive advantage. Major players are expanding partnerships with supermarket chains and deploying pilot projects across North America, Europe, and Asia-Pacific to strengthen market presence. Continuous development of IoT-based systems, self-checkout technologies, and data-driven retail platforms is shaping the competition. Price differentiation, user experience, and integration flexibility are key factors influencing vendor positioning in this rapidly evolving market.

Key Player Analysis

  • AiFi Inc.
  • Caper Inc.
  • Cart Technologies, LLC
  • Cust2mate Ltd.
  • Focal Systems Inc.
  • Fujitsu Limited
  • Grabango Co.
  • IMAGR Limited
  • International Business Machines Corporation (IBM)
  • Microsoft Corporation
  • Retail AI, Inc.
  • SAP SE
  • SK Telecom Co., Ltd.
  • Standard Cognition Corp.
  • Tracxpoint, Inc.
  • V-Mark Enterprise Limited
  • Veeve Inc.
  • Walmart Inc.
  • Wanzl India Pvt. Ltd.
  • ZooZ by PayU Company

Recent Developments

  • In December 2024, Walmart Chile and Shopic implemented AI-Powered Smart Carts to transform Retail industry in Chile.
  • In April 2024, Amazon announced plans to offer Dash carts to third-party grocers, expanding the checkout technology beyond Amazon grocery banners and Whole Foods Market stores.
  • In January 2024, Microsoft announced new generative AI and data solutions across the shopper journey, offering copilot experiences through Microsoft Cloud for Retail.
  • In May 2023, Grocery smart cart provider Shopic announced a partnership with the Microsoft Experience Center EMEA in Munich to showcase its innovative smart cart technology.
  • In September 2022, Seattle startup Veeve announced the expansion of its checkout-free, smart shopping-cart technology from grocery stores to big-box retailers with a new attachment that effectively turns regular shopping carts into smart carts

Report Coverage

The research report offers an in-depth analysis based on Technology, Mode of Sales, End-User and Geography. It details leading market players, providing an overview of their business, product offerings, investments, revenue streams, and key applications. Additionally, the report includes insights into the competitive environment, SWOT analysis, current market trends, as well as the primary drivers and constraints. Furthermore, it discusses various factors that have driven market expansion in recent years. The report also explores market dynamics, regulatory scenarios, and technological advancements that are shaping the industry. It assesses the impact of external factors and global economic changes on market growth. Lastly, it provides strategic recommendations for new entrants and established companies to navigate the complexities of the market.

Future Outlook

  1. The market will continue to grow rapidly, supported by expanding smart retail and automation demand.
  2. Retailers will adopt AI, IoT, and RFID-enabled carts to enhance operational efficiency and customer engagement.
  3. Increasing preference for contactless and cashless shopping will strengthen smart cart integration in supermarkets.
  4. Software-driven analytics will provide personalized shopping experiences and real-time inventory management.
  5. Partnerships between technology providers and retail chains will accelerate large-scale smart cart deployment.
  6. High initial costs will encourage manufacturers to develop cost-efficient and modular smart cart systems.
  7. Data security advancements will improve consumer trust in automated shopping solutions.
  8. Asia-Pacific will emerge as the fastest-growing region, while North America will retain market leadership.
  9. Supermarkets will remain the dominant end-user segment, supported by high foot traffic and automation needs.
  10. Continuous R&D and digital transformation in retail will drive innovation and long-term market sustainability.

1. Preface
1.1. Report Description
1.1.1. Purpose of the Report
1.1.2. Target Audience
1.1.3. USP and Key Offerings
1.2. Research Scope
1.3. Research Methodology
1.3.1. Phase I – Secondary Research
1.3.2. Phase II – Primary Research
1.3.3. Phase III – Expert Panel Review
1.3.4. Approach Adopted
1.3.4.1. Top-Down Approach
1.3.4.2. Bottom-Up Approach
1.3.5. Assumptions
1.4. Market Introduction
1.5. Market Research Scope

2. Executive Summary
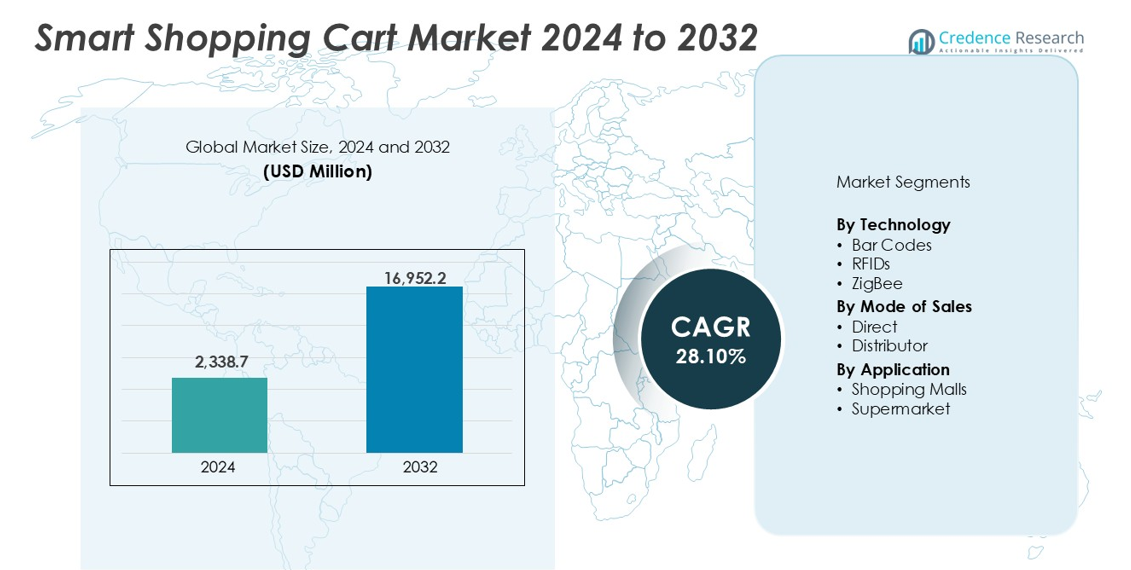
2.1. Market Snapshot: Global Smart Shopping Cart Market
2.2. Global Smart Shopping Cart Market, By Technology
2.3. Global Smart Shopping Cart Market, By Mode of Sales
2.4. Global Smart Shopping Cart Market, By Application
2.5. Global Smart Shopping Cart Market, By Region

3. Market Dynamics & Factors Analysis
3.1. Introduction
3.1.1. Global Smart Shopping Cart Market Value, 2019-2032, (US$ Mn))
3.1.2. Y-o-Y Growth Trend Analysis
3.2. Market Dynamics
3.2.1. Market Drivers
3.2.2. Market Restraints
3.2.3. Market Opportunities
3.2.4. Major Industry Challenges
3.3. Growth and Development Patterns
3.4. Investment Feasibility Analysis
3.5. Market Opportunity Analysis
3.5.1. Type
3.5.2. Mode of Sales
3.5.3. Geography

4. Premium Insights
4.1. STAR (Situation, Task, Action, Results) Analysis
4.2. Porter’s Five Forces Analysis
4.2.1. Threat of New Entrants
4.2.2. Bargaining Power of Buyers/Consumers
4.2.3. Bargaining Power of Suppliers
4.2.4. Threat of Substitute Types
4.2.5. Intensity of Competitive Rivalry
4.3. Key Market Trends
4.3.1. Demand Side Trends
4.3.2. Supply Side Trends
4.4. Value Chain Analysis
4.5. Technology Analysis
4.6. Analysis and Recommendations
4.7. Marketing Strategy Analysis
4.7.1. Direct Marketing
4.7.2. Indirect Marketing
4.7.3. Marketing Channel Development Trend

5. Market Positioning of Key Players, 2024
5.1. Company market share of key players, 2024
5.2. Competitive Benchmarking
5.3. Market Positioning of Key Vendors
5.4. Geographical Presence Analysis
5.5. Major Strategies Adopted by Key Players
5.5.1. Key Strategies Analysis
5.5.2. Mergers and Acquisitions
5.5.3. Partnerships
5.5.4. Product Launch
5.5.5. Geographical Expansion
5.5.6. Others

6. Economic Impact Analysis
6.1. Recession Impact
6.1.1. North America
6.1.2. Europe
6.1.3. Asia Pacific
6.1.4. Latin America
6.1.5. Middle East and Africa
6.2. Ukraine-Russia War Impact
6.2.1. North America
6.2.2. Europe
6.2.3. Asia Pacific
6.2.4. Latin America
6.2.5. Middle East and Africa
6.3. COVID-19 Impact Analysis
6.3.1. North America
6.3.2. Europe
6.3.3. Asia Pacific
6.3.4. Latin America
6.3.5. Middle East and Africa

7. Global Smart Shopping Cart Market
7.1. Global Smart Shopping Cart Market, by Technology, 2019-2032 (US$ Mn))
7.1.1. Overview
7.1.2. Global Smart Shopping Cart Market, By Technology, 2024 vs 2032 (in%)
7.1.3. Global Smart Shopping Cart Market, By Bar Codes, 2019-2032 (US$ Mn))
7.1.4. Global Smart Shopping Cart Market, By RFIDs, 2019-2032 (US$ Mn))
7.1.5. Global Smart Shopping Cart Market, By ZigBee, 2019-2032 (US$ Mn))
7.2. Global Smart Shopping Cart Market, by Mode of Sales, 2019-2032 (US$ Mn))
7.2.1. Overview
7.2.2. Global Smart Shopping Cart Market, By Mode of Sales, 2024 vs 2032 (in%)
7.2.3. Global Smart Shopping Cart Market, By Direct, 2019-2032 (US$ Mn))
7.2.4. Global Smart Shopping Cart Market, By Distributor, 2019-2032 (US$ Mn))
7.3. Global Smart Shopping Cart Market, by Application, 2019-2032 (US$ Mn))
7.3.1. Overview
7.3.2. Global Smart Shopping Cart Market, By Application, 2024 vs 2032 (in%)
7.3.3. Global Smart Shopping Cart Market, By Shopping Malls, 2019-2032 (US$ Mn))
7.3.4. Global Smart Shopping Cart Market, By Supermarket, 2019-2032 (US$ Mn))

8. North America Smart Shopping Cart Market Analysis
8.1. North America Smart Shopping Cart Market, by Technology, 2019-2032(US$ Mn))
8.1.1. Overview
8.1.2. SRC Analysis
8.2. North America Smart Shopping Cart Market, by Mode of Sales, 2019-2032(US$ Mn))
8.2.1. Overview
8.2.2. SRC Analysis
8.3. North America Smart Shopping Cart Market, by Application, 2019-2032(US$ Mn))
8.3.1. Overview
8.3.2. SRC Analysis
8.4. North America Smart Shopping Cart Market, by Country, 2019-2032 (US$ Mn))
8.4.1. U.S.
8.4.1.1. U.S. Smart Shopping Cart Market Estimates and Forecast, 2019-2032 (US$ Mn))
8.4.1.2. U.S. Smart Shopping Cart, By Technology, 2019-2032 (US$ Mn))
8.4.1.3. U.S. Smart Shopping Cart, By Mode of Sales, 2019-2032 (US$ Mn))
8.4.1.4. U.S. Smart Shopping Cart, By Application, 2019-2032 (US$ Mn))
8.4.2. Canada
8.4.2.1. Canada Smart Shopping Cart Market Estimates and Forecast, 2019-2032 (US$ Mn))
8.4.2.2. Canada Smart Shopping Cart, By Technology, 2019-2032 (US$ Mn))
8.4.2.3. Canada Smart Shopping Cart, By Mode of Sales, 2019-2032 (US$ Mn))
8.4.2.4. Canada Smart Shopping Cart, By Application, 2019-2032 (US$ Mn))

9. Europe Smart Shopping Cart Market Analysis
9.1. Europe Smart Shopping Cart Market, by Technology, 2019-2032(US$ Mn))
9.1.1. Overview
9.1.2. SRC Analysis
9.2. Europe Smart Shopping Cart Market, by Mode of Sales, 2019-2032(US$ Mn))
9.2.1. Overview
9.2.2. SRC Analysis
9.3. Europe Smart Shopping Cart Market, by Application, 2019-2032(US$ Mn))
9.3.1. Overview
9.3.2. SRC Analysis
9.4. Europe Smart Shopping Cart Market, by Country, 2019-2032 (US$ Mn))
9.4.1. Germany
9.4.1.1. Germany Smart Shopping Cart Market Estimates and Forecast, 2019-2032 (US$ Mn))
9.4.1.2. Germany Smart Shopping Cart, By Technology, 2019-2032 (US$ Mn))
9.4.1.3. Germany Smart Shopping Cart, By Mode of Sales, 2019-2032 (US$ Mn))
9.4.1.4. Germany Smart Shopping Cart, By Application, 2019-2032 (US$ Mn))
9.4.2. France
9.4.2.1. France Smart Shopping Cart Market Estimates and Forecast, 2019-2032 (US$ Mn))
9.4.2.2. France Smart Shopping Cart, By Technology, 2019-2032 (US$ Mn))
9.4.2.3. France Smart Shopping Cart, By Mode of Sales, 2019-2032 (US$ Mn))
9.4.2.4. France Smart Shopping Cart, By Application, 2019-2032 (US$ Mn))
9.4.3. UK
9.4.3.1. UK Smart Shopping Cart Market Estimates and Forecast, 2019-2032 (US$ Mn))
9.4.3.2. UK Smart Shopping Cart, By Technology, 2019-2032 (US$ Mn))
9.4.3.3. UK Smart Shopping Cart, By Mode of Sales, 2019-2032 (US$ Mn))
9.4.3.4. UK Smart Shopping Cart, By Application, 2019-2032 (US$ Mn))
9.4.4. Italy
9.4.4.1. Italy Smart Shopping Cart Market Estimates and Forecast, 2019-2032 (US$ Mn))
9.4.4.2. Italy Smart Shopping Cart, By Technology, 2019-2032 (US$ Mn))
9.4.4.3. Italy Smart Shopping Cart, By Mode of Sales, 2019-2032 (US$ Mn))
9.4.4.4. Italy Smart Shopping Cart, By Application, 2019-2032 (US$ Mn))
9.4.5. Spain
9.4.5.1. Spain Smart Shopping Cart Market Estimates and Forecast, 2019-2032 (US$ Mn))
9.4.5.2. Spain Smart Shopping Cart, By Technology, 2019-2032 (US$ Mn))
9.4.5.3. Spain Smart Shopping Cart, By Mode of Sales, 2019-2032 (US$ Mn))
9.4.5.4. Spain Smart Shopping Cart, By Application, 2019-2032 (US$ Mn))
9.4.6. Rest of Europe
9.4.6.1. Rest of Europe Smart Shopping Cart Market Estimates and Forecast, 2019-2032 (US$ Mn))
9.4.6.2. Rest of Europe Smart Shopping Cart, By Technology, 2019-2032 (US$ Mn))
9.4.6.3. Rest of Europe Smart Shopping Cart, By Mode of Sales, 2019-2032 (US$ Mn))
9.4.6.4. Rest of Europe Smart Shopping Cart, By Application, 2019-2032 (US$ Mn))

10. Asia Pacific Smart Shopping Cart Market Analysis
10.1. Asia Pacific Smart Shopping Cart Market, by Technology, 2019-2032(US$ Mn))
10.1.1. Overview
10.1.2. SRC Analysis
10.2. Asia Pacific Smart Shopping Cart Market, by Mode of Sales, 2019-2032(US$ Mn))
10.2.1. Overview
10.2.2. SRC Analysis
10.3. Asia Pacific Smart Shopping Cart Market, by Application, 2019-2032(US$ Mn))
10.3.1. Overview
10.3.2. SRC Analysis
10.4. Asia Pacific Smart Shopping Cart Market, by Country, 2019-2032 (US$ Mn))
10.4.1. China
10.4.1.1. China Smart Shopping Cart Market Estimates and Forecast, 2019-2032 (US$ Mn))
10.4.1.2. China Smart Shopping Cart, By Technology, 2019-2032 (US$ Mn))
10.4.1.3. China Smart Shopping Cart, By Mode of Sales, 2019-2032 (US$ Mn))
10.4.1.4. China Smart Shopping Cart, By Application, 2019-2032 (US$ Mn))
10.4.2. Japan
10.4.2.1. Japan Smart Shopping Cart Market Estimates and Forecast, 2019-2032 (US$ Mn))
10.4.2.2. Japan Smart Shopping Cart, By Technology, 2019-2032 (US$ Mn))
10.4.2.3. Japan Smart Shopping Cart, By Mode of Sales, 2019-2032 (US$ Mn))
10.4.2.4. Japan Smart Shopping Cart, By Application, 2019-2032 (US$ Mn))
10.4.3. India
10.4.3.1. India Smart Shopping Cart Market Estimates and Forecast, 2019-2032 (US$ Mn))
10.4.3.2. India Smart Shopping Cart, By Technology, 2019-2032 (US$ Mn))
10.4.3.3. India Smart Shopping Cart, By Mode of Sales, 2019-2032 (US$ Mn))
10.4.3.4. India Smart Shopping Cart, By Application, 2019-2032 (US$ Mn))
10.4.4. South Korea
10.4.4.1. South Korea Smart Shopping Cart Market Estimates and Forecast, 2019-2032 (US$ Mn))
10.4.4.2. South Korea Smart Shopping Cart, By Technology, 2019-2032 (US$ Mn))
10.4.4.3. South Korea Smart Shopping Cart, By Mode of Sales, 2019-2032 (US$ Mn))
10.4.4.4. South Korea Smart Shopping Cart, By Application, 2019-2032 (US$ Mn))
10.4.5. South-East Asia
10.4.5.1. South-East Asia Smart Shopping Cart Market Estimates and Forecast, 2019-2032 (US$ Mn))
10.4.5.2. South-East Asia Smart Shopping Cart, By Technology, 2019-2032 (US$ Mn))
10.4.5.3. South-East Asia Smart Shopping Cart, By Mode of Sales, 2019-2032 (US$ Mn))
10.4.5.4. South-East Asia Smart Shopping Cart, By Application, 2019-2032 (US$ Mn))
10.4.6. Rest of Asia Pacific
10.4.6.1. Rest of Asia Pacific Smart Shopping Cart Market Estimates and Forecast, 2019-2032 (US$ Mn))
10.4.6.2. Rest of Asia Pacific Smart Shopping Cart, By Technology, 2019-2032 (US$ Mn))
10.4.6.3. Rest of Asia Pacific Smart Shopping Cart, By Mode of Sales, 2019-2032 (US$ Mn))
10.4.6.4. Rest of Asia Pacific Smart Shopping Cart, By Application, 2019-2032 (US$ Mn))

11. Latin America Smart Shopping Cart Market Analysis
11.1. Latin America Smart Shopping Cart Market, by Technology, 2019-2032(US$ Mn))
11.1.1. Overview
11.1.2. SRC Analysis
11.2. Latin America Smart Shopping Cart Market, by Mode of Sales, 2019-2032(US$ Mn))
11.2.1. Overview
11.2.2. SRC Analysis
11.3. Latin America Smart Shopping Cart Market, by Application, 2019-2032(US$ Mn))
11.3.1. Overview
11.3.2. SRC Analysis
11.4. Latin America Smart Shopping Cart Market, by Country, 2019-2032 (US$ Mn))
11.4.1. Brazil
11.4.1.1. Brazil Smart Shopping Cart Market Estimates and Forecast, 2019-2032 (US$ Mn))
11.4.1.2. Brazil Smart Shopping Cart, By Technology, 2019-2032 (US$ Mn))
11.4.1.3. Brazil Smart Shopping Cart, By Mode of Sales, 2019-2032 (US$ Mn))
11.4.1.4. Brazil Smart Shopping Cart, By Application, 2019-2032 (US$ Mn))
11.4.2. Mexico
11.4.2.1. Mexico Smart Shopping Cart Market Estimates and Forecast, 2019-2032 (US$ Mn))
11.4.2.2. Mexico Smart Shopping Cart, By Technology, 2019-2032 (US$ Mn))
11.4.2.3. Mexico Smart Shopping Cart, By Mode of Sales, 2019-2032 (US$ Mn))
11.4.2.4. Mexico Smart Shopping Cart, By Application, 2019-2032 (US$ Mn))
11.4.3. Rest of Latin America
11.4.3.1. Rest of Latin America Smart Shopping Cart Market Estimates and Forecast, 2019-2032 (US$ Mn))
11.4.3.2. Rest of Latin America Smart Shopping Cart, By Technology, 2019-2032 (US$ Mn))
11.4.3.3. Rest of Latin America Smart Shopping Cart, By Mode of Sales, 2019-2032 (US$ Mn))
11.4.3.4. Rest of Latin America Smart Shopping Cart, By Application, 2019-2032 (US$ Mn))

12. Middle East and Africa Smart Shopping Cart Market Analysis
12.1. Middle East and Africa Smart Shopping Cart Market, by Technology, 2019-2032(US$ Mn))
12.1.1. Overview
12.1.2. SRC Analysis
12.2. Middle East and Africa Smart Shopping Cart Market, by Mode of Sales, 2019-2032(US$ Mn))
12.2.1. Overview
12.2.2. SRC Analysis
12.3. Middle East and Africa Smart Shopping Cart Market, by Application, 2019-2032(US$ Mn))
12.3.1. Overview
12.3.2. SRC Analysis
12.4. Middle East and Africa Smart Shopping Cart Market, by Country, 2019-2032 (US$ Mn))
12.4.1. GCC Countries
12.4.1.1. GCC Countries Smart Shopping Cart Market Estimates and Forecast, 2019-2032 (US$ Mn))
12.4.1.2. GCC Countries Smart Shopping Cart, By Technology, 2019-2032 (US$ Mn))
12.4.1.3. GCC Countries Smart Shopping Cart, By Mode of Sales, 2019-2032 (US$ Mn))
12.4.1.4. GCC Countries Smart Shopping Cart, By Application, 2019-2032 (US$ Mn))
12.4.2. South Africa
12.4.2.1. South Africa Smart Shopping Cart Market Estimates and Forecast, 2019-2032 (US$ Mn))
12.4.2.2. South Africa Smart Shopping Cart, By Technology, 2019-2032 (US$ Mn))
12.4.2.3. South Africa Smart Shopping Cart, By Mode of Sales, 2019-2032 (US$ Mn))
12.4.2.4. South Africa Smart Shopping Cart, By Application, 2019-2032 (US$ Mn))
12.4.3. Rest of Middle East and Africa
12.4.3.1. Rest of Middle East and Africa Smart Shopping Cart Market Estimates and Forecast, 2019-2032 (US$ Mn))
12.4.3.2. Rest of Middle East and Africa Smart Shopping Cart, By Technology, 2019-2032 (US$ Mn))
12.4.3.3. Rest of Middle East and Africa Smart Shopping Cart, By Mode of Sales, 2019-2032 (US$ Mn))
12.4.3.4. Rest of Middle East and Africa Smart Shopping Cart, By Application, 2019-2032 (US$ Mn))

13. Company Profiles
13.1. AiFi Inc.
13.1.1. Company Overview
13.1.2. Products/Services Portfolio
13.1.3. Geographical Presence
13.1.4. Financial Summary
13.1.4.1. Market Revenue and Net Profit (2019-2024)
13.1.4.2. Business Segment Revenue Analysis
13.1.4.3. Geographical Revenue Analysis
13.2. Caper Inc.
13.3. Cart Technologies, LLC
13.4. Cust2mate Ltd.
13.5. Focal Systems Inc.
13.6. Fujitsu Limited
13.7. Grabango Co.
13.8. IMAGR Limited
13.9. International Business Machines Corporation
13.10. Microsoft Corporation
13.11. Retail AI, Inc.
13.12. SAP SE
13.13. SK Telecom Co., Ltd.
13.14. Standard Cognition, Corp.
13.15. Tracxpoint, Inc.
13.16. V-Mark Enterprise Limited
13.17. Veeve Inc.
13.18. Walmart Inc.
13.19. Wanzl India Pvt Ltd.
13.20. ZooZ by PayU Company


List of Figures
FIG. 1 Global Smart Shopping Cart Market: Research Methodology
FIG. 2 Market Size Estimation – Top Down & Bottom up Approach
FIG. 3 Global Smart Shopping Cart Market Segmentation
FIG. 4 Global Smart Shopping Cart Market, by Technology, 2024 (US$ Mn))
FIG. 5 Global Smart Shopping Cart Market, by Mode of Sales, 2024 (US$ Mn))
FIG. 6 Global Smart Shopping Cart Market, by Application, 2024 (US$ Mn))
FIG. 7 Global Smart Shopping Cart Market, by Geography, 2024 (US$ Mn))
FIG. 8 Attractive Investment Proposition, by Technology, 2024
FIG. 9 Attractive Investment Proposition, by Mode of Sales, 2024
FIG. 10 Attractive Investment Proposition, by Application, 2024
FIG. 11 Attractive Investment Proposition, by Geography, 2024
FIG. 12 Global Market Share Analysis of Key Smart Shopping Cart Market Manufacturers, 2024
FIG. 13 Global Market Positioning of Key Smart Shopping Cart Market Manufacturers, 2024
FIG. 14 Global Smart Shopping Cart Market Value Contribution, By Technology, 2024 & 2032 (Value %)
FIG. 15 Global Smart Shopping Cart Market, by Bar Codes, Value, 2019-2032 (US$ Mn))
FIG. 16 Global Smart Shopping Cart Market, by RFIDs, Value, 2019-2032 (US$ Mn))
FIG. 17 Global Smart Shopping Cart Market, by ZigBee, Value, 2019-2032 (US$ Mn))
FIG. 18 Global Smart Shopping Cart Market Value Contribution, By Mode of Sales, 2024 & 2032 (Value %)
FIG. 19 Global Smart Shopping Cart Market, by Direct, Value, 2019-2032 (US$ Mn))
FIG. 20 Global Smart Shopping Cart Market, by Distributor, 2019-2032 (US$ Mn))
FIG. 21 Global Smart Shopping Cart Market Value Contribution, By Application, 2024 & 2032 (Value %)
FIG. 22 Global Smart Shopping Cart Market, by Shopping Malls, Value, 2019-2032 (US$ Mn))
FIG. 23 Global Smart Shopping Cart Market, by Supermarket, 2019-2032 (US$ Mn))
FIG. 24 North America Smart Shopping Cart Market, 2019-2032 (US$ Mn))
FIG. 25 U.S. Smart Shopping Cart Market, 2019-2032 (US$ Mn))
FIG. 26 Canada Smart Shopping Cart Market, 2019-2032 (US$ Mn))
FIG. 27 Europe Smart Shopping Cart Market, 2019-2032 (US$ Mn))
FIG. 28 Germany Smart Shopping Cart Market, 2019-2032 (US$ Mn))
FIG. 29 France Smart Shopping Cart Market, 2019-2032 (US$ Mn))
FIG. 30 U.K. Smart Shopping Cart Market, 2019-2032 (US$ Mn))
FIG. 31 Italy Smart Shopping Cart Market, 2019-2032 (US$ Mn))
FIG. 32 Spain Smart Shopping Cart Market, 2019-2032 (US$ Mn))
FIG. 33 Rest of Europe Smart Shopping Cart Market, 2019-2032 (US$ Mn))
FIG. 34 Asia Pacific Smart Shopping Cart Market, 2019-2032 (US$ Mn))
FIG. 35 China Smart Shopping Cart Market, 2019-2032 (US$ Mn))
FIG. 36 Japan Smart Shopping Cart Market, 2019-2032 (US$ Mn))
FIG. 37 India Smart Shopping Cart Market, 2019-2032 (US$ Mn))
FIG. 38 South Korea Smart Shopping Cart Market, 2019-2032 (US$ Mn))
FIG. 39 South-East Asia Smart Shopping Cart Market, 2019-2032 (US$ Mn))
FIG. 40 Rest of Asia Pacific Smart Shopping Cart Market, 2019-2032 (US$ Mn))
FIG. 41 Latin America Smart Shopping Cart Market, 2019-2032 (US$ Mn))
FIG. 42 Brazil Smart Shopping Cart Market, 2019-2032 (US$ Mn))
FIG. 43 Mexico Smart Shopping Cart Market, 2019-2032 (US$ Mn))
FIG. 44 Rest of Latin America Smart Shopping Cart Market, 2019-2032 (US$ Mn))
FIG. 45 Middle East & Africa Smart Shopping Cart Market, 2019-2032 (US$ Mn))
FIG. 46 GCC Countries Smart Shopping Cart Market, 2019-2032 (US$ Mn))
FIG. 47 South Africa Smart Shopping Cart Market, 2019-2032 (US$ Mn))
FIG. 48 Rest of Middle East and Africa Smart Shopping Cart Market, 2019-2032 (US$ Mn))

List of Tables
TABLE 1 Market Snapshot: Global Smart Shopping Cart Market
TABLE 2 Global Smart Shopping Cart Market, by Competitive Benchmarking, 2024
TABLE 3 Global Smart Shopping Cart Market, by Geographical Presence Analysis, 2024
TABLE 4 Global Smart Shopping Cart Market, by Key Strategies Analysis, 2024
TABLE 5 Global Smart Shopping Cart Market, by Technology, 2019-2032 (US$ Mn))
TABLE 6 Global Smart Shopping Cart Market, by Mode of Sales, 2019-2032 (US$ Mn))
TABLE 7 Global Smart Shopping Cart Market, by Application, 2019-2032 (US$ Mn))
TABLE 8 Global Smart Shopping Cart Market, by Geography, 2019-2032 (US$ Mn))
TABLE 9 North America Smart Shopping Cart Market, by Technology, 2019-2032 (US$ Mn))
TABLE 10 North America Smart Shopping Cart Market, by Mode of Sales, 2019-2032 (US$ Mn))
TABLE 11 North America Smart Shopping Cart Market, by Application, 2019-2032 (US$ Mn))
TABLE 12 North America Smart Shopping Cart Market, by Country, 2019-2032 (US$ Mn))
TABLE 13 US Smart Shopping Cart Market, by Technology, 2019-2032 (US$ Mn))
TABLE 14 US Smart Shopping Cart Market, by Mode of Sales, 2019-2032 (US$ Mn))
TABLE 15 US Smart Shopping Cart Market, by Application, 2019-2032 (US$ Mn))
TABLE 16 Canada Smart Shopping Cart Market, by Technology, 2019-2032 (US$ Mn))
TABLE 17 Canada Smart Shopping Cart Market, by Mode of Sales, 2019-2032 (US$ Mn))
TABLE 18 Canada Smart Shopping Cart Market, by Application, 2019-2032 (US$ Mn))
TABLE 19 Europe Smart Shopping Cart Market, by Technology, 2019-2032 (US$ Mn))
TABLE 20 Europe Smart Shopping Cart Market, by Mode of Sales, 2019-2032 (US$ Mn))
TABLE 21 Europe Smart Shopping Cart Market, by Application, 2019-2032 (US$ Mn))
TABLE 22 Europe Smart Shopping Cart Market, by Country, 2019-2032 (US$ Mn))
TABLE 23 Germany Smart Shopping Cart Market, by Technology, 2019-2032 (US$ Mn))
TABLE 24 Germany Smart Shopping Cart Market, by Mode of Sales, 2019-2032 (US$ Mn))
TABLE 25 Germany Smart Shopping Cart Market, by Application, 2019-2032 (US$ Mn))
TABLE 26 France Smart Shopping Cart Market, by Technology, 2019-2032 (US$ Mn))
TABLE 27 France Smart Shopping Cart Market, by Mode of Sales, 2019-2032 (US$ Mn))
TABLE 28 France Smart Shopping Cart Market, by Application, 2019-2032 (US$ Mn))
TABLE 29 UK Smart Shopping Cart Market, by Technology, 2019-2032 (US$ Mn))
TABLE 30 UK Smart Shopping Cart Market, by Mode of Sales, 2019-2032 (US$ Mn))
TABLE 31 UK Smart Shopping Cart Market, by Application, 2019-2032 (US$ Mn))
TABLE 32 Italy Smart Shopping Cart Market, by Technology, 2019-2032 (US$ Mn))
TABLE 33 Italy Smart Shopping Cart Market, by Mode of Sales, 2019-2032 (US$ Mn))
TABLE 34 Italy Smart Shopping Cart Market, by Application, 2019-2032 (US$ Mn))
TABLE 35 Spain Smart Shopping Cart Market, by Technology, 2019-2032 (US$ Mn))
TABLE 36 Spain Smart Shopping Cart Market, by Mode of Sales, 2019-2032 (US$ Mn))
TABLE 37 Spain Smart Shopping Cart Market, by Application, 2019-2032 (US$ Mn))
TABLE 38 Rest of Europe Smart Shopping Cart Market, by Technology, 2019-2032 (US$ Mn))
TABLE 39 Rest of Europe Smart Shopping Cart Market, by Mode of Sales, 2019-2032 (US$ Mn))
TABLE 40 Rest of Europe Smart Shopping Cart Market, by Application, 2019-2032 (US$ Mn))
TABLE 41 Asia Pacific Smart Shopping Cart Market, by Technology, 2019-2032 (US$ Mn))
TABLE 42 Asia Pacific Smart Shopping Cart Market, by Mode of Sales, 2019-2032 (US$ Mn))
TABLE 43 Asia Pacific Smart Shopping Cart Market, by Application, 2019-2032 (US$ Mn))
TABLE 44 Asia Pacific Smart Shopping Cart Market, by Country, 2019-2032 (US$ Mn))
TABLE 45 China Smart Shopping Cart Market, by Technology, 2019-2032 (US$ Mn))
TABLE 46 China Smart Shopping Cart Market, by Mode of Sales, 2019-2032 (US$ Mn))
TABLE 47 China Smart Shopping Cart Market, by Application, 2019-2032 (US$ Mn))
TABLE 48 Japan Smart Shopping Cart Market, by Technology, 2019-2032 (US$ Mn))
TABLE 49 Japan Smart Shopping Cart Market, by Mode of Sales, 2019-2032 (US$ Mn))
TABLE 50 Japan Smart Shopping Cart Market, by Application, 2019-2032 (US$ Mn))
TABLE 51 India Smart Shopping Cart Market, by Technology, 2019-2032 (US$ Mn))
TABLE 52 India Smart Shopping Cart Market, by Mode of Sales, 2019-2032 (US$ Mn))
TABLE 53 India Smart Shopping Cart Market, by Application, 2019-2032 (US$ Mn))
TABLE 54 South Korea Smart Shopping Cart Market, by Technology, 2019-2032 (US$ Mn))
TABLE 55 South Korea Smart Shopping Cart Market, by Mode of Sales, 2019-2032 (US$ Mn))
TABLE 56 South Korea Smart Shopping Cart Market, by Application, 2019-2032 (US$ Mn))
TABLE 57 South-East Asia Smart Shopping Cart Market, by Technology, 2019-2032 (US$ Mn))
TABLE 58 South-East Asia Smart Shopping Cart Market, by Mode of Sales, 2019-2032 (US$ Mn))
TABLE 59 South-East Asia Smart Shopping Cart Market, by Application, 2019-2032 (US$ Mn))
TABLE 60 Rest of Asia Pacific Smart Shopping Cart Market, by Technology, 2019-2032 (US$ Mn))
TABLE 61 Rest of Asia Pacific Smart Shopping Cart Market, by Mode of Sales, 2019-2032 (US$ Mn))
TABLE 62 Rest of Asia Pacific Smart Shopping Cart Market, by Application, 2019-2032 (US$ Mn))
TABLE 63 Latin America Smart Shopping Cart Market, by Technology, 2019-2032 (US$ Mn))
TABLE 64 Latin America Smart Shopping Cart Market, by Mode of Sales, 2019-2032 (US$ Mn))
TABLE 65 Latin America Smart Shopping Cart Market, by Application, 2019-2032 (US$ Mn))
TABLE 66 Latin America Smart Shopping Cart Market, by Country, 2019-2032 (US$ Mn))
TABLE 67 Brazil Smart Shopping Cart Market, by Technology, 2019-2032 (US$ Mn))
TABLE 68 Brazil Smart Shopping Cart Market, by Mode of Sales, 2019-2032 (US$ Mn))
TABLE 69 Brazil Smart Shopping Cart Market, by Application, 2019-2032 (US$ Mn))
TABLE 70 Mexico Smart Shopping Cart Market, by Technology, 2019-2032 (US$ Mn))
TABLE 71 Mexico Smart Shopping Cart Market, by Mode of Sales, 2019-2032 (US$ Mn))
TABLE 72 Mexico Smart Shopping Cart Market, by Application, 2019-2032 (US$ Mn))
TABLE 73 Rest of Latin America Smart Shopping Cart Market, by Technology, 2019-2032 (US$ Mn))
TABLE 74 Rest of Latin America Smart Shopping Cart Market, by Mode of Sales, 2019-2032 (US$ Mn))
TABLE 75 Rest of Latin America Smart Shopping Cart Market, by Application, 2019-2032 (US$ Mn))
TABLE 76 Middle East and Africa Smart Shopping Cart Market, by Technology, 2019-2032 (US$ Mn))
TABLE 77 Middle East and Africa Smart Shopping Cart Market, by Mode of Sales, 2019-2032 (US$ Mn))
TABLE 78 Middle East and Africa Smart Shopping Cart Market, by Application, 2019-2032 (US$ Mn))
TABLE 79 Middle East and Africa Smart Shopping Cart Market, by Country, 2019-2032 (US$ Mn))
TABLE 80 GCC Countries Smart Shopping Cart Market, by Technology, 2019-2032 (US$ Mn))
TABLE 81 GCC Countries Smart Shopping Cart Market, by Mode of Sales, 2019-2032 (US$ Mn))
TABLE 82 GCC Countries Smart Shopping Cart Market, by Application, 2019-2032 (US$ Mn))
TABLE 83 South Africa Smart Shopping Cart Market, by Technology, 2019-2032 (US$ Mn))
TABLE 84 South Africa Smart Shopping Cart Market, by Mode of Sales, 2019-2032 (US$ Mn))
TABLE 85 South Africa Smart Shopping Cart Market, by Application, 2019-2032 (US$ Mn))
TABLE 86 Rest of Middle East and Africa Smart Shopping Cart Market, by Technology, 2019-2032 (US$ Mn))
TABLE 87 Rest of Middle East and Africa Smart Shopping Cart Market, by Mode of Sales, 2019-2032 (US$ Mn))
TABLE 88 Rest of Middle East and Africa Smart Shopping Cart Market, by Application, 2019-2032 (US$ Mn))

Request Free Sample

We prioritize the confidentiality and security of your data. Our promise: your information remains private.

Ready to Transform Data into Decisions?

Request Your Sample Report and Start Your Journey of Informed Choices


Providing the strategic compass for industry titans.

cr-clients-logos

Frequently Asked Questions:

What is the current market size for the Smart Shopping Cart market, and what is its projected size in 2032?

The Smart Shopping Cart market was valued at USD 2,338.7 million in 2024 and is projected to reach USD 16,952.2 million by 2032.

At what Compound Annual Growth Rate is the Smart Shopping Cart market projected to grow between 2025 and 2032?

The market is expected to grow at a CAGR of 28.10% during the forecast period.

Which is the leading region of the market for a smart shopping cart?

North America accounted for the most heightened global smart shopping cart market share.

What are the key drivers for the growth of the smart shopping cart market?

The market for smart shopping carts is fueled by several factors, such as the growing demand for individualized shopping experiences and the increased use of contactless technologies

Which is the major segment in the smart shopping cart market by technology?

The RIFDs segment had a major share in the global market in 2022.

Which is the major segment in the smart shopping cart market by application?

The supermarket segment had a major share in the global market.

About Author

Sushant Phapale

Sushant Phapale

ICT & Automation Expert

Sushant is an expert in ICT, automation, and electronics with a passion for innovation and market trends.

View Profile

Related Reports

Consumer NAS Market

Consumer NAS Market was valued USD 1.79 billion in 2024 and is anticipated to reach USD 3.81 billion by 2032, at a CAGR of 9.9% during the forecast period.

Data Center Rack Server Market

The Data Center Rack Server Market size was valued at USD 94.64 billion in 2024 and is anticipated to reach USD 243.17 billion by 2032, at a CAGR of 12.52% during the forecast period.

Data Center Equipment Market

The Data Center Equipment Market size was valued at USD 285.6 billion in 2024 and is anticipated to reach USD 569.08 billion by 2032, at a CAGR of 9% during the forecast period.

Customer Information System (CIS) Market

The Customer Information System (CIS) Market size was valued at USD 123.5 billion in 2024 and is anticipated to reach USD 266.66 billion by 2032, at a CAGR of 10.1% during the forecast period.

Construction Risk Assessment Software Market

The Construction Risk Assessment Software market was valued at USD 2.29 billion in 2024 and is projected to reach USD 4.49 billion by 2032, growing at a CAGR of 8.8% during the forecast period.

Construction Punch List Software Market

The Construction Punch List Software market was valued at USD 2.26 billion in 2024 and is projected to reach USD 4.48 billion by 2032, growing at a CAGR of 8.93% during the forecast period.

Compound Camphor Ointment Market

The Compound Camphor Ointment market size was valued at USD 980.5 million in 2024 and is projected to reach USD 1,571.04 million by 2032, growing at a CAGR of 6.07% during the forecast period.

Digital Evidence Management Market

The global digital evidence management market was valued at USD 2.09 billion in 2024 and is projected to reach USD 5.96 billion by 2032, growing at a CAGR of 14% during the forecast period.

Digital Shipyard Market

The Digital Shipyard Market size was valued at USD 790.5 million in 2024 and is anticipated to reach USD 1,902.02 million by 2032, at a CAGR of 11.6% during the forecast period.

Restaurant Reservations Software Market

Global Restaurant Reservations Software Market size was valued at USD 3,341.61 million in 2018, grew to USD 6,597.72 million in 2024, and is anticipated to reach USD 16,413.09 million by 2032, expanding at a CAGR of 11.24% during the forecast period.

Digital Security Control Market

Digital Security Control market size was valued at USD 3.29 billion in 2024 and is anticipated to reach USD 8.32 billion by 2032, at a CAGR of 12.3% during the forecast period.

Digital Lending Platforms Market

Digital Lending Platform Market size was valued USD 6.09 billion in 2024 and is anticipated to reach USD 17.74 billion by 2032, at a CAGR of 14.3% during the forecast period.

Licence Option

The report comes as a view-only PDF document, optimized for individual clients. This version is recommended for personal digital use and does not allow printing. Use restricted to one purchaser only.
$4999

To meet the needs of modern corporate teams, our report comes in two formats: a printable PDF and a data-rich Excel sheet. This package is optimized for internal analysis. Unlimited users allowed within one corporate location (e.g., regional office).
$6999

The report will be delivered in printable PDF format along with the report’s data Excel sheet. This license offers 100 Free Analyst hours where the client can utilize Credence Research Inc. research team. Permitted for unlimited global use by all users within the purchasing corporation, such as all employees of a single company.
$12999

Report delivery within 24 to 48 hours

Credence Staff 3

WILLIAM, North America

Support Staff at Credence Research

KEITH PHILLIPS, Europe

Lee - CR Sales Staff

LEE VALLANCE, Asia Pacific

Kieran Jameson

KIERAN JAMESON, Australia

Smallform of Sample request
User Review

Thank you for the data! The numbers are exactly what we asked for and what we need to build our business case.

Materials Scientist
(privacy requested)

User Review

The report was an excellent overview of the Industrial Burners market. This report does a great job of breaking everything down into manageable chunks.

Imre Hof
Management Assistant, Bekaert

cr-clients-logos

Request Sample