
| REPORT ATTRIBUTE | DETAILS |
|---|---|
| Historical Period | 2019-2022 |
| Base Year | 2023 |
| Forecast Period | 2024-2032 |
| Sodium Reduction Ingredient market Size 2024 | USD 5562 million |
| Sodium Reduction Ingredient market, CAGR | 6.1% |
| Sodium Reduction Ingredient market Size 2032 | USD 8932.1 million |
Market Overview:
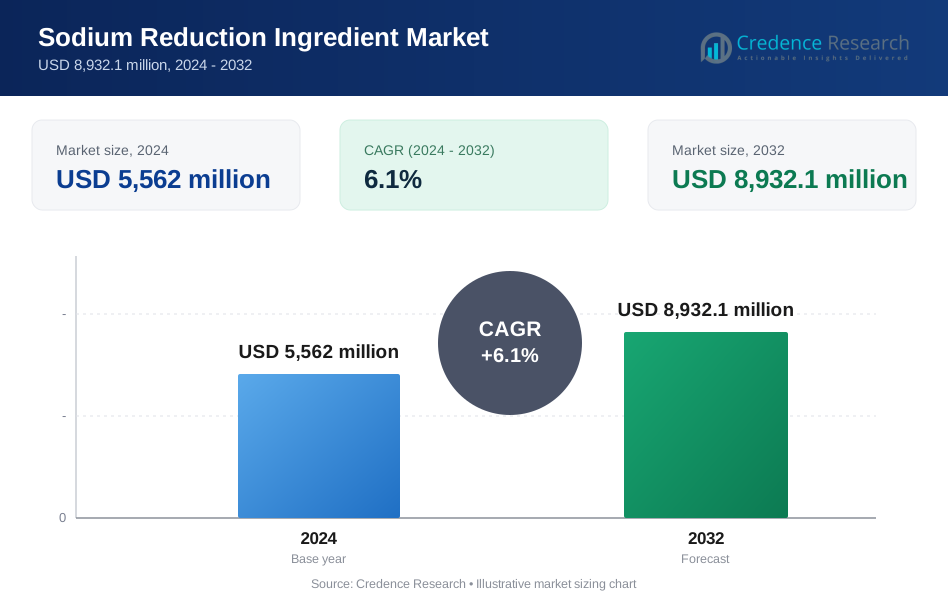
The Sodium Reduction Ingredient market is projected to grow from USD 5562 million in 2024 to an estimated USD 8932.1 million by 2032, with a compound annual growth rate (CAGR) of 6.1% from 2024 to 2032.
Key drivers of the sodium reduction ingredient market include rising public health concerns about sodium consumption and its link to various health issues. Governments and health organizations worldwide are advocating for lower sodium intake, which is leading to stricter regulations and guidelines for food products. Consequently, food manufacturers are actively incorporating sodium reduction ingredients to comply with these regulations and cater to the growing consumer demand for healthier food options. Advances in technology and innovations in sodium reduction solutions, such as potassium-based substitutes and enzyme-based technologies, are also enhancing the market's growth. Additionally, the trend towards clean label products and natural ingredients is further propelling the demand for effective sodium reduction solutions.
Regionally, North America and Europe are leading the sodium reduction ingredient market, driven by stringent regulatory frameworks and high consumer awareness regarding health and nutrition. In North America, the United States and Canada are prominent markets due to their proactive approach to public health and substantial investments in health-oriented food product development. Europe follows closely, with significant growth fueled by similar health-focused initiatives and consumer preferences for healthier food options. The Asia-Pacific region is witnessing rapid expansion as well, driven by increasing urbanization, rising disposable incomes, and growing awareness about health and nutrition. Emerging markets in Latin America and the Middle East are also showing potential as they adopt healthier eating habits and regulatory measures align with global health trends.
Market Drivers:
Growing Health Consciousness:
One of the primary drivers of the sodium reduction ingredient market is the increasing health consciousness among consumers. With rising awareness of the adverse health effects of excessive sodium intake, including hypertension, cardiovascular diseases, and stroke, there is a significant shift towards healthier dietary choices. Health organizations and government bodies are actively promoting reduced sodium consumption, leading consumers to seek out products that align with these health recommendations. For example, PepsiCo has reduced the sodium content in its Walkers Crisps by 25% and in Walkers Sensations by around 45%, reflecting the company's commitment to healthier product offerings. This growing awareness is pushing food manufacturers to reformulate their products with sodium reduction ingredients to meet consumer demands for healthier options and to avoid health-related marketing restrictions. Kraft Heinz has also responded to this trend by reformulating its popular products, such as its ketchup, to contain less sodium, which has been well received by health-conscious consumers. In 2023, the company reported a significant increase in the sales of its reduced-sodium products, indicating a positive consumer response to these healthier alternatives. The trend is not just limited to snacks; it extends to various food categories. For instance, the bakery segment is increasingly incorporating sodium reduction ingredients, with companies like General Mills actively reformulating their baked goods to lower sodium levels while maintaining flavor. This shift is supported by consumer demand for clean-label products, as many are now prioritizing transparency in ingredient sourcing and formulation. As health consciousness continues to rise, food manufacturers are not only reformulating existing products but also innovating new ones that cater to this demand.
Stringent Regulatory Guidelines:
Regulatory pressures are a significant factor driving the sodium reduction ingredient market. Governments and health authorities worldwide are implementing stricter regulations and guidelines to limit sodium content in food products. For example, various countries have set maximum allowable sodium levels for different food categories and are promoting initiatives to reduce sodium consumption across populations. Compliance with these regulations requires food manufacturers to incorporate sodium reduction ingredients into their products. As a result, the regulatory landscape is creating a strong demand for innovative sodium reduction solutions that can help manufacturers meet these stringent standards while maintaining product taste and quality. Additionally, failure to comply with these regulations can result in penalties, product recalls, and loss of consumer trust, further incentivizing companies to prioritize sodium reduction in their formulations. The ongoing global push for healthier diets continues to reinforce the importance of sodium reduction in food production, ensuring sustained market growth.
Technological Advancements:
Technological advancements in sodium reduction solutions are also fueling market growth. Innovations in ingredient technology, such as potassium-based salt substitutes, salt replacers, and enzyme-based technologies, are making it easier for manufacturers to reduce sodium levels without compromising flavor. For instance, Cargill has developed a potassium chloride-based salt substitute that effectively mimics the taste of traditional salt, allowing food manufacturers to lower sodium content while maintaining flavor integrity. This product has gained traction in various applications, from processed foods to snacks, as consumers increasingly seek healthier options. These advancements are expanding the range of options available for sodium reduction and improving the effectiveness of these ingredients in various food applications. Kerry Group, a global leader in taste and nutrition, has reported a significant increase in the adoption of its sodium reduction solutions, with a 30% rise in sales of its clean-label sodium reduction ingredients in 2023. This reflects a growing consumer preference for products that are not only lower in sodium but also align with clean-label trends. The development of new technologies and formulations continues to enhance the market by providing more efficient and cost-effective solutions for sodium reduction, thereby encouraging broader adoption across different food segments. For example, DSM has introduced enzyme-based solutions that enhance the flavor profile of low-sodium products, allowing manufacturers to create appealing formulations without the high sodium levels typically required for flavor enhancement. This innovation has been particularly beneficial in the meat and dairy sectors, where flavor retention is crucial.
Rising Demand for Clean Label Products:
The growing demand for clean label products is another driving force behind the sodium reduction ingredient market. Consumers are increasingly looking for food products that feature natural, transparent ingredient lists without artificial additives or excessive sodium. This trend towards clean labels reflects a broader shift in consumer preferences towards products perceived as healthier and more natural. Manufacturers are responding by reformulating their products to reduce sodium content and meet the clean label criteria. As the clean label movement gains momentum, the demand for sodium reduction ingredients is expected to rise, as they play a crucial role in achieving the desired product transparency and health benefits. Additionally, companies that successfully adapt to this trend can enhance their brand image and appeal to a growing segment of health-conscious consumers. This alignment with consumer values not only drives sales but also fosters long-term brand loyalty in a competitive market
Market Trends:
Innovation in Sodium Reduction Technologies:
Technological innovation is another key trend shaping the sodium reduction ingredient market. Advances in formulation technology are enabling the development of more effective and versatile sodium reduction solutions. Innovations such as enzyme-based technologies and novel potassium-based salt substitutes are providing new ways to reduce sodium content without compromising taste or functionality. These technologies are not only improving the efficacy of sodium reduction ingredients but also expanding their application across a wider range of food products. As research and development in this area continue to progress, the market is likely to see the introduction of even more advanced solutions, further driving growth and adoption.
Increased Focus on Health and Wellness:
The emphasis on health and wellness is increasingly influencing the sodium reduction ingredient market. As consumers become more aware of the health risks associated with high sodium intake, there is a growing demand for products that support better dietary habits. For instance, a survey conducted by the American Heart Association revealed that nearly 70% of consumers are actively trying to reduce their sodium intake, prompting food manufacturers to respond to this demand. This trend is leading to greater adoption of sodium reduction ingredients in a variety of food and beverage products, including processed foods, snacks, and beverages. For example, Kraft Heinz has reformulated its popular condiments to include lower sodium options, resulting in a 15% increase in sales for these products in 2023. Similarly, Campbell Soup Company has introduced several low-sodium varieties of its soups, which have been well-received, contributing to a 10% growth in their health-focused product line. Manufacturers are capitalizing on this trend by reformulating their products to lower sodium content and appeal to health-conscious consumers. Nestlé has reported a commitment to reducing sodium levels across its product range, achieving a reduction of up to 20% in certain processed foods. This initiative aligns with consumer preferences for healthier options and reflects a broader industry shift towards transparency and health-oriented reformulations. The increased focus on health and wellness is also driving the growth of functional foods and beverages that offer additional health benefits beyond sodium reduction.
Expansion in Emerging Markets:
The sodium reduction ingredient market is experiencing notable growth in emerging markets, where rising disposable incomes and increasing awareness of health issues are driving demand. In regions such as Asia-Pacific, Latin America, and the Middle East, there is a growing recognition of the health risks associated with high sodium intake, leading to increased adoption of sodium reduction ingredients. For example, in India, the demand for low-sodium products has surged, with companies like Nestlé reporting a 15% increase in sales of their reduced-sodium offerings in 2023. This reflects a significant shift in consumer preferences towards healthier dietary choices. As these markets continue to develop and urbanize, the demand for healthier food options, including those with reduced sodium content, is expected to rise. A study by the World Health Organization indicated that over 70% of consumers in urban areas of Brazil are actively seeking to reduce their sodium intake, prompting food manufacturers to reformulate their products. Unilever, for instance, has introduced a range of sauces and soups with reduced sodium levels in response to this growing consumer demand, achieving a 20% increase in sales for these products in 2023. Manufacturers are expanding their presence in these regions to capitalize on the emerging opportunities and cater to the evolving consumer preferences for healthier and more balanced diets. Cargill has invested in local production facilities in Southeast Asia to provide sodium reduction solutions tailored to regional tastes and dietary needs. This strategy has allowed them to increase their market share in the sodium reduction segment by 18% in the past year.
Rise of Natural and Organic Ingredients:
A significant trend in the sodium reduction ingredient market is the growing preference for natural and organic alternatives. Consumers are increasingly seeking products that align with their health-conscious lifestyles, leading to a surge in demand for sodium reduction ingredients derived from natural sources. Ingredients such as potassium salts and seaweed extracts are gaining popularity due to their natural origins and perceived health benefits. This shift towards natural ingredients is driven by a broader clean label movement, where consumers demand transparency and naturalness in their food products. As manufacturers respond to these consumer preferences, the market for natural sodium reduction solutions is expanding, reflecting a growing trend towards healthier and more sustainable food options.
Market Restraints and Challenges:
High Cost of Sodium Reduction Ingredients:
One of the key restraints in the sodium reduction ingredient market is the high cost associated with these ingredients. Advanced sodium reduction technologies, such as potassium-based salts and enzyme-based solutions, often come with a higher price tag compared to traditional sodium sources. This cost can be a significant barrier for manufacturers, particularly those operating in price-sensitive markets or dealing with tight profit margins. The high cost of these ingredients may limit their adoption and integration into mainstream food products, potentially hindering market growth and innovation.
Taste and Sensory Challenges:
Another major challenge is maintaining the taste and sensory qualities of food products when reducing sodium content. Sodium plays a critical role in flavor enhancement, and its reduction can lead to changes in taste, texture, and overall sensory experience. Consumers are sensitive to these changes, and any alteration in flavor can impact product acceptance. Manufacturers must invest in research and development to create effective sodium reduction solutions that do not compromise the sensory attributes of their products. Balancing sodium reduction with taste preservation remains a complex challenge, influencing how quickly new ingredients can be adopted.
Regulatory and Labeling Constraints:
Regulatory and labeling constraints also pose challenges to the sodium reduction ingredient market. Different countries have varying regulations regarding the permissible levels of sodium in food products, which can complicate compliance for global manufacturers. Additionally, the regulatory landscape for novel ingredients and claims related to sodium reduction can be stringent and complex. Navigating these regulations requires significant resources and expertise, which can be particularly challenging for smaller companies or new entrants in the market.
Limited Consumer Awareness:
Limited consumer awareness about the benefits and availability of sodium reduction ingredients can also impede market growth. While health consciousness is rising, not all consumers are fully informed about the impact of sodium on health or the existence of effective reduction solutions. This lack of awareness can slow the adoption of sodium reduction ingredients and affect their market penetration. Increasing consumer education and awareness is crucial to driving demand and overcoming this challenge, requiring coordinated efforts from manufacturers, health organizations, and regulators.
Market Segmentation Analysis:
By Ingredients:
The market is categorized into mineral salts, amino acids, yeast extracts, and others. Mineral salts, particularly potassium chloride, dominate this segment due to their effectiveness as sodium substitutes in food products without compromising taste. Yeast extracts and amino acids are also gaining traction as they offer the added benefit of flavor enhancement while reducing sodium content. The diversity of available ingredients allows manufacturers to choose the most suitable option depending on the product type and desired flavor profile.
By Application:
The market is divided into bakery and confectionery, dairy and frozen foods, sauces and dressings, snacks, and others. The bakery and confectionery segment leads the market, driven by the high demand for sodium-reduced bread, cakes, and biscuits. Snacks and processed foods are also significant contributors to the market, reflecting the growing consumer preference for healthier alternatives. The sauces and dressings segment is expanding as manufacturers increasingly reformulate products to meet regulatory requirements and consumer demand for lower sodium content. The wide range of applications for sodium reduction ingredients is propelling market growth across multiple food categories.
Segmentation:
By Ingredients:
- Mineral Salts,
- Amino Acids,
- Yeast Extracts,
By Application:
- Bakery
- Confectionery,
- Dairy and Frozen Foods,
- Sauces and Dressings,
- Snacks,
By Region
- North America
- The U.S.
- Canada
- Mexico
- Europe
- Germany
- France
- The U.K.
- Italy
- Spain
- Rest of Europe
- Asia Pacific
- China
- Japan
- India
- South Korea
- South-east Asia
- Rest of Asia Pacific
- Latin America
- Brazil
- Argentina
- Rest of Latin America
- Middle East & Africa
- GCC Countries
- South Africa
- Rest of Middle East and Africa
Regional Analysis:
North America
North America holds a significant share of the global sodium reduction ingredient market, driven by heightened health awareness and stringent regulatory measures. The United States, in particular, leads the market due to its proactive approach towards reducing sodium intake and addressing related health issues such as hypertension and cardiovascular diseases. Regulatory bodies such as the FDA have set guidelines that encourage the reduction of sodium in processed foods, prompting manufacturers to adopt sodium reduction technologies. The U.S. market benefits from advanced R&D capabilities and a strong presence of key industry players, contributing to its leading position. The market in Canada follows closely, supported by similar health trends and regulatory frameworks. Collectively, North America is estimated to hold approximately 40% of the global market share.
Europe
Europe is another major region in the sodium reduction ingredient market, characterized by stringent regulations and a strong consumer focus on health and wellness. The European Union has implemented comprehensive food regulations that encourage lower sodium content in food products, influencing manufacturers to adopt sodium reduction technologies. Countries such as Germany, the United Kingdom, and France are at the forefront of this trend, driven by a high level of consumer awareness and government initiatives aimed at reducing sodium consumption. The European market also benefits from a well-established infrastructure for research and development, as well as a growing preference for healthier food options. Europe is estimated to hold around 30% of the global market share.
Asia-Pacific
The Asia-Pacific region is experiencing rapid growth in the sodium reduction ingredient market, driven by increasing urbanization, rising disposable incomes, and a growing awareness of health issues. Countries like China and India are emerging as significant contributors to market growth due to their large populations and evolving dietary habits. As consumers in these countries become more health-conscious, there is a rising demand for products with reduced sodium content. Additionally, governments are beginning to implement policies to address public health concerns related to sodium intake. The Asia-Pacific region is expected to capture approximately 20% of the global market share, reflecting its expanding consumer base and growing health awareness.
Latin America and Middle East & Africa
The sodium reduction ingredient market in Latin America and the Middle East & Africa is in the early stages of growth but shows promising potential. In Latin America, increasing urbanization and improving economic conditions are driving the demand for healthier food options. Similarly, the Middle East & Africa is witnessing gradual adoption of sodium reduction ingredients as consumer preferences shift towards healthier dietary choices. However, these regions currently hold a smaller market share, estimated at around 10% combined, as they continue to develop infrastructure and awareness related to sodium reduction technologies. As these markets mature, their share in the global sodium reduction ingredient market is expected to grow.
Key Player Analysis:
- Angel Yeast Co. Ltd
- Cargill Incorporated
- E.I. du Pont de Nemours & Co.
- Innophos Holdings Incorporated
- Kerry Group Plc
- Royal DSM N.V.
Competitive Analysis:
The sodium reduction ingredient market is characterized by a competitive landscape featuring several key players and ongoing innovation. Major companies such as Cargill dominate the market, leveraging their extensive expertise in food technology and ingredient formulation to develop effective sodium reduction solutions. These industry leaders focus on advancing technologies, including potassium-based salt substitutes, enzyme-based solutions, and natural flavor enhancers, to meet the growing consumer demand for healthier food options. The market also sees involvement from niche players specializing in novel ingredient technologies and functional ingredients. Competitive strategies include strategic partnerships, mergers and acquisitions, and investment in research and development to enhance product offerings and expand market reach. Additionally, companies are increasingly emphasizing sustainability and clean label products to align with evolving consumer preferences and regulatory requirements.
Recent Developments:
- In April 2024, Kerry Group launched Tastesense Salt, a sodium reduction solution designed for savory snacks. This product aligns with WHO guidelines for lower sodium intake, achieving reductions of over 60% while maintaining full flavor.
- In November 2023, PepsiCo revealed its commitment to lowering sodium levels in Lay's Classic Potato Chips to 140mg per serving by 2030. The company also pledged to diversify ingredients, aiming to deliver 145 billion portions annually by 2030, each contributing 10% of the recommended daily intake.
Market Concentration & Characteristics:
The sodium reduction ingredient market exhibits moderate concentration, with a few major players holding significant market share alongside a number of specialized firms. Leading companies, such as Cargill, dominate due to their advanced research capabilities, extensive distribution networks, and broad product portfolios. These key players focus on innovative solutions like potassium-based salts and enzyme technologies to address the increasing demand for reduced sodium content in food products. The market also includes smaller, specialized firms that offer niche products and cutting-edge technologies, contributing to a diverse competitive environment. Characteristics of the market include a strong emphasis on R&D to improve ingredient efficacy and sensory appeal, and a growing trend towards clean label and natural ingredients. Overall, while dominated by a few large players, the market remains dynamic with ongoing innovation and specialization.
Report Coverage:
The research report offers an in-depth analysis based on By Ingredients and By Application. It details leading market players, providing an overview of their business, product offerings, investments, revenue streams, and key applications. Additionally, the report includes insights into the competitive environment, SWOT analysis, current market trends, as well as the primary drivers and constraints. Furthermore, it discusses various factors that have driven market expansion in recent years. The report also explores market dynamics, regulatory scenarios, and technological advancements that are shaping the industry. It assesses the impact of external factors and global economic changes on market growth. Lastly, it provides strategic recommendations for new entrants and established companies to navigate the complexities of the market.
Future Outlook:
- The sodium reduction ingredient market is expected to see robust growth due to increasing health awareness and demand for lower sodium products.
- Technological advancements will drive innovation, introducing more effective and versatile sodium reduction solutions.
- Regulatory pressures globally will intensify, prompting manufacturers to adopt sodium reduction technologies to comply with stricter standards.
- Rising consumer preference for natural and clean label products will boost the demand for sodium reduction ingredients derived from natural sources.
- The market will benefit from greater adoption in emerging regions, where growing urbanization and health awareness are driving demand.
- Increased research and development efforts will lead to the discovery of new, cost-effective sodium reduction ingredients.
- Collaboration between ingredient suppliers and food manufacturers will enhance product formulations and market reach.
- Rising trends in personalized nutrition and functional foods will increase the integration of sodium reduction ingredients in diverse product categories.
- Government initiatives promoting public health and reducing sodium intake will further support market growth.
- Enhanced consumer education about the benefits of sodium reduction will drive broader acceptance and usage of these ingredients.
Request a Free Sample
Fill in your details and we'll send you a free sample report.
- Sample data tables & charts
- Research methodology
Need a Custom Version of This Report?
Tailor the scope, geography, or segments to your exact requirements.
- Custom geography or segment scope
- Direct access to our analyst team
Frequently Asked Questions
What is the projected growth of the Sodium Reduction Ingredient market?
What are the key drivers of the Sodium Reduction Ingredient market?
Which regions are leading the Sodium Reduction Ingredient market?
Are there any challenges in the Sodium Reduction Ingredient market?
Table of Content
Chapter 1. Report Introduction
- 1.1 Report Description & Purpose
- 1.1.1 Report Title & Market Definition
- 1.1.2 Unique Selling Propositions (USP) & Key Differentiators
- 1.1.3 Value Proposition for Stakeholders
- 1.2 Research Objectives
- 1.2.1 Market Sizing Objectives (Volume & Revenue)
- 1.2.2 Segmentation Objectives
- 1.2.3 Competitive Intelligence Objectives
- 1.2.4 Forecast & Scenario Objectives
- 1.3 Report Scope
- 1.3.1 Sodium Reduction Ingredient Scope – Types & Subtypes Covered
- 1.3.2 Geographic Scope – Regions & Countries Covered
- 1.3.3 Historical Period, Base Year & Forecast Period (2024; forecast to 2032)
- 1.3.4 Inclusions & Exclusions
- 1.4 HS Code & Classification Framework
- 1.5 Currency, Units & Pricing Basis
- 1.6 Target Stakeholders
- 1.7 Limitations & Assumptions
Chapter 2. Executive Summary
- 2.1 Global Sodium Reduction Ingredient Market Snapshot
- 2.1.1 Market Size – Historical (2024) & Forecast (2024-2032) (2024: USD 5,562 million → 2032: USD 8,932.1 million)
- 2.1.2 Volume & Revenue – Global Totals
- 2.1.3 Key Market Highlights – Top Five Facts
- 2.2 Sodium Reduction Ingredient Market Segmentation Snapshot
- 2.2.1 Market Split by Region – 2024 vs. 2032
- 2.3 Competitive Snapshot
- 2.3.1 Top 10 Players by Revenue Share – 2024
- 2.3.2 Top 10 Players by Volume Share – 2024
- 2.3.3 Recent Strategic Developments (18-Month Summary)
- 2.4 Key Investment Highlights & Strategic Conclusions
Chapter 3. Sodium Reduction Ingredient Market Dynamics & Industry Analysis
- 3.1 Market Overview & Context
- 3.1.1 Sodium Reduction Ingredient Market Position in the Broader Automotive Value Chain
- 3.1.2 OEM vs. Replacement Market Dynamics
- 3.1.3 Market Maturity & Development Stage by Region
- 3.2 Sodium Reduction Ingredient Market Drivers
- 3.3 Sodium Reduction Ingredient Market Restraints & Challenges
- 3.4 Sodium Reduction Ingredient Market Opportunities
- 3.5 Porter's Five Forces Analysis
- 3.5.1 Threat of New Entrants
- 3.5.2 Bargaining Power of Suppliers
- 3.5.3 Bargaining Power of Buyers
- 3.5.4 Threat of Substitutes
- 3.5.5 Competitive Rivalry – Intensity Assessment
- 3.6 Sodium Reduction Ingredient Value Chain Analysis
- 3.6.1 Upstream – Raw Material/Input Suppliers
- 3.6.1.1 Raw Material/Input 1
- 3.6.1.2 Raw Material/Input 2
- 3.6.1.3 Raw Material/Input 3
- 3.6.2 Midstream – Production/Manufacturing/Service Delivery
- 3.6.2.1 Production/Process Overview
- 3.6.2.2 Key Facility Locations & Capacity by Manufacturer
- 3.6.3 Downstream – Distribution & End Consumer
- 3.6.3.1 Primary Channel – B2B/OEM
- 3.6.3.2 Secondary Channels – Dealer, Retail, Online, Direct
- 3.6.4 Value Chain Profitability Analysis
- 3.6.1 Upstream – Raw Material/Input Suppliers
- 3.7 PESTEL Analysis
- 3.7.1 Political Factors
- 3.7.2 Economic Factors
- 3.7.3 Social Factors
- 3.7.4 Technological Factors
- 3.7.5 Environmental Factors
- 3.7.6 Legal Factors
- 3.8 Sodium Reduction Ingredient Supply Chain Analysis
- 3.8.1 Raw Material/Input Supply Risk Assessment
- 3.8.2 Manufacturing Concentration Risk (Geographic Exposure)
- 3.8.3 Trade Disruption Impact Analysis
- 3.9 Regulatory & Policy Landscape
Note: The regulatory and policy landscape section covers regulations based on their applicability to the market, Sodium Reduction Ingredient category, geography, and scope of the study. Only regulatory frameworks with a material impact on operations, compliance, trade, sustainability, or market access are analyzed in detail.
Chapter 4. Key Investment Pockets & Opportunity Analysis
- 4.1 Sodium Reduction Ingredient Market Attractiveness Analysis
- 4.1.1 By Region – Investment Attractiveness Matrix (Volume × CAGR)
- 4.2 Absolute Revenue Growth Opportunity
- 4.2.1 By Region – Absolute USD Growth Through 2032
- 4.3 Incremental Volume Opportunity
- 4.3.1 By Region – Incremental Volume Through 2032
- 4.3.2 Segment – Incremental Volume
- 4.4 Emerging Submarket Opportunity Deep Dive (Subject to Applicability)
- 4.5 Emerging Market Opportunity Scorecards
- 4.5.1 United States
- 4.5.2 Europe
- 4.5.3 Asia
- 4.5.4 Middle East & Africa
Note: Emerging Market Opportunity Scorecards will be included based on relevance and strategic importance. Regions listed are indicative and may vary depending on data availability and market dynamics.
Chapter 5. Sodium Reduction Ingredient Import-Export Analysis & Trade Flows
- 5.1 Global Trade Overview
- 5.1.1 Global Export Value by Country (2024)
- 5.1.2 Global Export Volume by Country (2024)
- 5.1.3 Global Import Value by Country (2024)
- 5.1.4 Global Import Volume by Country (2024)
- 5.1.5 Net Trade Balance by Country (2024)
- 5.2 Export Analysis – Segment
- 5.2.1 Type 1 (HS Code)
- 5.2.2 Type 2 (HS Code)
- 5.2.3 Type 3 (HS Code)
- 5.2.4 Type 4 (HS Code)
- 5.2.5 Type 5 (HS Code)
- 5.3 Import Analysis – Segment
- 5.3.1 Type 1 (HS Code)
- 5.3.2 Type 2 (HS Code)
- 5.3.3 Type 3 (HS Code)
- 5.3.4 Type 4 (HS Code)
- 5.3.5 Type 5 (HS Code)
- 5.4 Average Unit Trade Prices
- 5.4.1 Average Export Price – Segment & Country
- 5.4.2 Average Import Price – Segment & Source Country
- 5.4.3 Price Trends (2024)
- 5.5 Key Trade Route Analysis
- 5.5.1 Trade Route 1
- 5.5.2 Trade Route 2
- 5.5.3 Trade Route 3
- 5.5.4 Trade Route 4
- 5.5.5 Trade Route 5
- 5.6 Trade Policy Impact Assessment
- 5.6.1 US Anti-Dumping & Section 301 Tariffs
- 5.6.2 EU Customs Union Impact
- 5.6.3 Major Free Trade Agreements
- 5.6.4 USMCA Rules of Origin
Note: Trade policy analysis will be included only where relevant to the Sodium Reduction Ingredient market.
Chapter 6. Competitive Landscape & Company Benchmarking
- 6.1 Sodium Reduction Ingredient Market Concentration & Structure
- 6.1.1 Herfindahl-Hirschman Index (HHI) – vs. 2024
- 6.1.2 Tier 1, Tier 2 & Tier 3 Market Structure
- 6.1.3 Global, Regional & Local Player Dynamics
- 6.2 Sodium Reduction Ingredient Market Share Analysis – 2024
- 6.2.1 Global Revenue Share by Company
- 6.2.2 Global Volume Share by Company
- 6.2.3 Regional Revenue Share
- 6.2.4 Market Share Evolution ( vs. 2024)
- 6.2.5 OEM Segment Share by Company
- 6.2.6 Replacement Segment Share by Company
- 6.3 Production/Delivery Capacity & Facility Analysis
- 6.3.1 Global Installed Capacity
- 6.3.2 Capacity Utilization Rates
- 6.3.3 Production/Output Volume
- 6.3.4 Facility Locations & Capacity Map
- 6.3.5 Planned Capacity Additions
- 6.4 Sodium Reduction Ingredient Competitive Benchmarking Matrix
- 6.4.1 Revenue, Volume, CAGR & Profitability Comparison
- 6.4.2 Channel Revenue Mix
- 6.4.3 Geographic Revenue Exposure
- 6.4.4 R&D Intensity
- 6.4.5 Sustainability Maturity
- 6.5 Strategic Developments in Sodium Reduction Ingredient (Last 24 Months)
- 6.5.1 Mergers, Acquisitions & Divestments
- 6.5.2 New Sodium Reduction Ingredient Launches
- 6.5.3 Facility Expansions
- 6.5.4 Strategic Alliances, Joint Ventures & Partnerships
- 6.5.5 Distribution Expansion & Market Entry
- 6.5.6 Sustainability & ESG Initiatives
- 6.6 Competitive Strategy Mapping
- 6.6.1 Leader, Challenger, Follower & Niche Classification
- 6.6.2 Pricing Strategy Comparison
- 6.6.3 Channel Strategy Matrix
Note: Strategic developments are included based on their materiality and the availability of reliable information.
Chapter 7. Global Sodium Reduction Ingredient Market – By Distribution Channel
- 7.1 Segment Overview
- 7.1.1 Volume & Revenue Split by Channel (2024 & 2032)
- 7.1.2 Channel Mix Evolution (2024-2032)
Chapter 8. Regional Market Analysis – Global Overview
- 8.1 Global Regional Overview
- 8.1.1 Regional Volume Share
- 8.1.2 Regional Revenue Share
- 8.1.3 Regional Volume by Region
- 8.1.4 Regional Revenue by Region
- 8.1.5 Regional Forecast Through 2032
- 8.2 Cross-Regional Segment Analysis
- 8.2.1 By Distribution Channel
- 8.2.2 By Brand/Price Tier
Chapter 9. North America Sodium Reduction Ingredient Market
- 9.1 United States
- 9.2 Canada
- 9.3 Mexico
Chapter 10. Europe Sodium Reduction Ingredient Market
- 10.1 Germany
- 10.2 France
- 10.3 Italy
- 10.4 United Kingdom
- 10.5 Spain
- 10.6 Poland
- 10.7 Russia
- 10.8 Netherlands
- 10.9 Belgium
- 10.10 Sweden
- 10.11 Denmark
- 10.12 Norway
- 10.13 Rest of Europe
Chapter 11. Asia Pacific Sodium Reduction Ingredient Market
- 11.1 China
- 11.2 India
- 11.3 Japan
- 11.4 South Korea
- 11.5 Thailand
- 11.6 Indonesia
- 11.7 Vietnam
- 11.8 Malaysia
- 11.9 Australia
- 11.10 Rest of Asia Pacific
Chapter 12. Latin America Sodium Reduction Ingredient Market
- 12.1 Brazil
- 12.2 Argentina
- 12.3 Colombia
- 12.4 Chile
- 12.5 Rest of Latin America
Chapter 13. Middle East Sodium Reduction Ingredient Market
- 13.1 Saudi Arabia
- 13.2 United Arab Emirates
- 13.3 Turkey
- 13.4 Israel
- 13.5 Iran
- 13.6 Rest of the Middle East
Chapter 14. Africa Sodium Reduction Ingredient Market
- 14.1 South Africa
- 14.2 Egypt
- 14.3 Nigeria
- 14.4 Morocco
- 14.5 Rest of Africa
Chapter 15. Sodium Reduction Ingredient Company Profiles
- 15.1 [Company 01]
- 15.1.1 Company Overview
- 15.1.2 Key Management Personnel
- 15.1.3 Products & Services Portfolio
- 15.1.4 Financial Performance
- 15.1.5 Key Market Focus & Geographic Presence
- 15.1.6 Recent Developments & Strategic Initiatives
Note: The company profile list is preliminary and may change based on research findings, market developments, data availability, and client requirements.
Chapter 16. Appendices
- Appendix A – List of Abbreviations & Acronyms
- Appendix B – Industry Classification Code Reference – Full Series
- Appendix C – Production & Capacity Data Tables
- Appendix D – End-Use & Demand Base Tables
- Appendix E – Consumption & Replacement Rate Assumptions
- Appendix F – ASP Reference Tables
- Appendix G – Manufacturing & Facility Database
- Appendix H – Import-Export Data Tables
- Appendix I – Regulatory Summary Tables
- Appendix J – Primary Research Participant List (Anonymized)
- Appendix K – Primary Research Questionnaire Framework
- Appendix L – Data Sources & Bibliography
- Appendix M – Market Size Divergence & Source Comparison
Chapter 17. Research Methodology
- 17.1 Research Framework & Philosophy
- 17.2 Secondary Research – Sources, Hierarchy & Data Extraction
- 17.3 Data Modeling – Bottom-Up & Top-Down Market Sizing
- 17.4 Primary Research – Stakeholder Framework, LOI & Sample Sizes
- 17.5 Forecast Methodology – Regression, Scenario & Sensitivity Analysis
- 17.6 Quality Control – Four-Layer Validation Framework
- 17.7 Limitations & Standard Assumptions
- 17.8 Disclaimer
