Market Overview
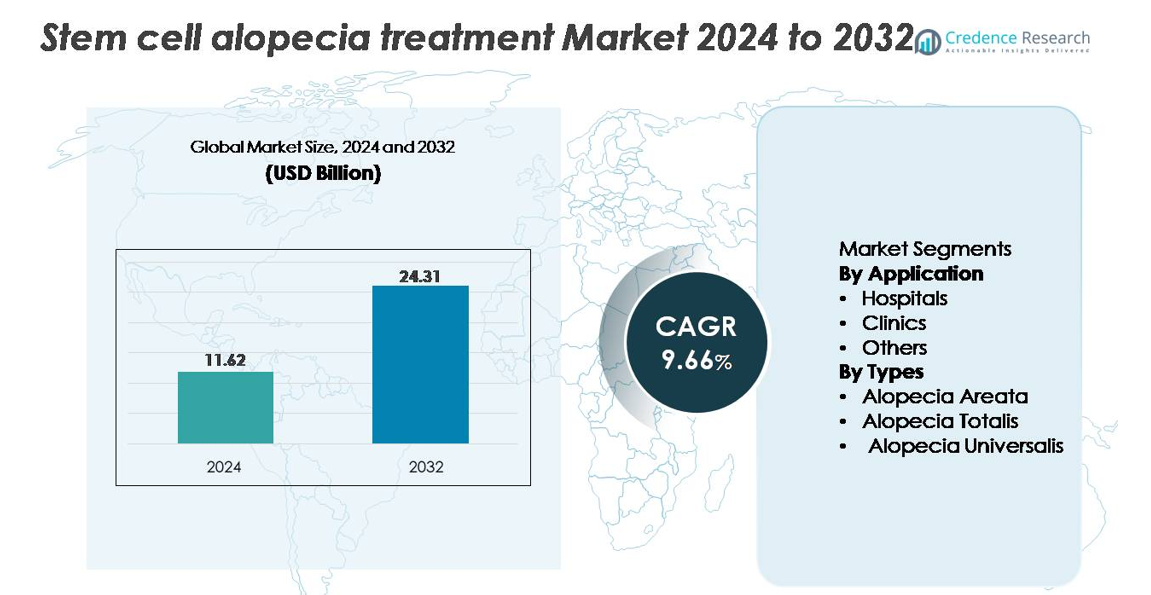
The global stem cell alopecia treatment market was valued at USD 11.62 billion in 2024 and is projected to reach USD 24.31 billion by 2032, expanding at a CAGR of 9.66% over the forecast period.
| REPORT ATTRIBUTE |
DETAILS |
| Historical Period |
2020-2023 |
| Base Year |
2024 |
| Forecast Period |
2025-2032 |
Stem Cell Alopecia Treatment Market Size 2024
|
USD 11.62 billion |
| Stem Cell Alopecia Treatment Market, CAGR |
9.6% |
| Stem Cell Alopecia Treatment Market Size 2032 |
USD 24.31 billion |
The stem cell alopecia treatment market is shaped by a mix of biotechnology innovators and advanced research institutes, with key contributors including Kerastem, RepliCel, APEX Biologix, Sanford Burnham Prebys Medical Discovery Institute, Belgravia Centre, and the Riken Research Institute. These organizations drive progress through clinical trials, exosome based platforms, adipose derived stem cell therapies, and follicular regeneration research. North America leads the global market with approximately 39–40% share, supported by strong R&D activity, high adoption of regenerative dermatology, and a dense concentration of clinical centers. Europe and Asia Pacific follow as major growth hubs, supported by expanding clinical infrastructure and rising demand for minimally invasive hair restoration solutions.
Market Insights:
- The global stem cell alopecia treatment market was valued at USD 11.62 billion in 2024 and is projected to reach USD 24.31 billion by 2032, expanding at a CAGR of 9.66%.
- Market growth is driven by increasing adoption of autologous and allogeneic stem cell therapies, rising awareness of minimally invasive hair regeneration solutions, and expanding clinical validation for mesenchymal stem cell and exosome based interventions.
- Key trends include rapid integration of cell free regenerative therapies, advancements in dermal papilla cell engineering, and strategic collaborations among biotech firms to accelerate commercialization.
- Competitive activity intensifies as players like Kerastem, RepliCel, APEX Biologix, and leading research institutes invest in clinical trials, scalable processing technologies, and off the shelf regenerative platforms, though high treatment costs and regulatory complexity continue to restrain broader adoption.
- Regionally, North America leads with 40% share, followed by Europe at 28% and Asia Pacific at 24%, while hospitals dominate the application segment due to advanced infrastructure and higher procedure volumes.
Access crucial information at unmatched prices!
Request your sample report today & start making informed decisions powered by Credence Research Inc.!
Download Sample
Market Segmentation Analysis:
By Application:
Hospitals dominate the stem cell alopecia treatment market due to their superior infrastructure, access to accredited regenerative medicine specialists, and wider adoption of advanced autologous and allogeneic stem cell procedures. Their leadership is reinforced by higher patient inflow for complex therapies such as dermal papilla cell implantation and stem cell–derived exosome infusions, which require controlled environments and advanced imaging support. Clinics continue to grow as minimally invasive outpatient procedures become more accessible, while the “Others” segment comprising medical spas and specialized hair restoration centers benefits from increasing demand for cosmetic stem cell–based hair regrowth solutions.
- For instance, Sanford Burnham Prebys Medical Discovery Institute demonstrated the hospital based capability for complex regenerative procedures when its research team successfully generated fully functional human dermal papilla–like cells from induced pluripotent stem cells and achieved the formation of new hair follicles in mouse models using transplanted cell clusters containing approximately 10,000 specialized cells per graft.
By Types:
Alopecia Areata holds the largest market share and remains the dominant treatment type, supported by its higher global prevalence and strong clinical success of mesenchymal stem cell therapies in modulating autoimmune responses and regenerating follicular stem cell activity. Alopecia Totalis shows rising adoption as targeted regenerative approaches, including dermal sheath cup cell activation, demonstrate improved outcomes for extensive scalp involvement. Alopecia Universalis, though less common, is gaining attention as next generation allogeneic stem cell platforms and exosome based therapies advance in clinical development, offering broader restoration potential for severe hair loss patterns.
- For instance, RepliCel Life Sciences reported that its RCH 01 autologous hair follicle–derived cell product demonstrated sustained follicular density improvement in a Phase 1 trial, in which subjects received intradermal injections containing 10 million dermal sheath cup cells per treatment site, establishing one of the earliest quantified dosing benchmarks in cell based alopecia therapy.
Key Growth Drivers:
Advancements in Stem Cell Based Follicular Regeneration Technologies
Innovations in stem cell science particularly mesenchymal stem cells (MSC), adipose derived stem cells (ADSC), and dermal papilla cell engineering serve as a primary growth catalyst for the stem cell alopecia treatment market. Advanced protocols that enable targeted follicular microenvironment repair, immune modulation, and enhanced angiogenesis are significantly improving clinical outcomes. Laboratories are adopting optimized cell culture techniques, exosome enrichment, and 3D follicle organoid platforms that accelerate follicle neogenesis and enhance hair density improvements. These advancements reduce procedural variability, boost treatment durability, and expand applicability across alopecia areata, androgenetic alopecia, and advanced autoimmune variants. As clinical evidence strengthens and regulatory approvals evolve, the integration of precision stem cell therapies into dermatology and regenerative medicine practices accelerates market adoption and reinforces technological competitiveness.
- For instance, RIKEN’s 2022 breakthrough demonstrated the first fully cycling human hair follicle organoids generated in vitro, producing hair shafts measuring approximately 3 millimeters in length within a 23 day culture period and completing up to three full growth cycles under controlled morphogen induction systems.
Expansion of Clinical Trials and Regulatory Advancements in Regenerative Medicine
A fast growing pipeline of clinical trials focused on autologous and allogeneic stem cell interventions is creating a supportive regulatory and scientific framework for market growth. Governments and regulatory bodies are increasingly permitting accelerated pathways for regenerative therapies, including conditional approvals and fast track designations for cell based treatments targeting alopecia. This shift reduces commercialization barriers and encourages biotechnology firms to invest in advanced follicular restoration technologies. Ongoing Phase I–III studies evaluating MSC derived exosomes, dermal sheath cup cells, and induced pluripotent stem cell (iPSC) therapies continue to demonstrate improved safety, efficacy, and long term regrowth potential. As clinical protocols become standardized and long term follow up data validates therapeutic durability, the global adoption of stem cell alopecia therapies is expected to expand significantly.
- For instance, RepliCel Life Sciences completed its RCH 01 Phase I trial using dermal sheath cup cells, in which 10 million autologous cells were injected per treatment site across a cohort with follow up spanning 5 years, generating one of the longest duration safety datasets in cell based alopecia research.
Rising Patient Demand for Minimally Invasive and Regenerative Hair Restoration Solutions
Increasing consumer preference for natural, minimally invasive hair regrowth therapies is driving strong demand for stem cell–based alopecia treatments. Compared with surgical hair transplantation, stem cell interventions offer reduced downtime, fewer risks, and more biologically integrated regrowth mechanisms, making them appealing to a broad patient demographic. The growing prevalence of alopecia areata and stress related hair loss further fuels adoption, especially among younger consumers seeking early intervention regenerative solutions. Dermatology clinics and hair restoration centers are rapidly integrating stem cell and exosome therapies into their service portfolios, supported by higher patient willingness to pay for premium, science backed treatment options. The shift toward personalized regenerative aesthetics combined with rising public awareness through digital health platforms continues to strengthen market momentum.
Key Trends & Opportunities:
Integration of Exosome Based Therapies and Cell Free Regenerative Platforms
A major trend shaping the market is the rapid transition toward cell free regenerative therapies, particularly exosome based treatments derived from MSCs and dermal papilla cells. Exosomes provide a powerful alternative to full stem cell transplantation by delivering concentrated growth factors, mRNA, microRNA, and signaling proteins that stimulate follicular regeneration without the complexities of cell handling. This shift opens significant commercial opportunities as exosomes enable easier storage, standardized dosing, and reduced regulatory burden compared to autologous cell therapies. Companies are increasingly developing high purity exosome formulations for scalp microinjection and topical delivery, expanding accessibility across hospitals, clinics, and premium aesthetic centers. As research advances, combination protocols integrating exosomes with microneedling, PRP, or low level laser therapy are creating new value propositions for providers and accelerating treatment uptake.
- For instance, A clinical grade exosome preparation can contain an average of 15 billion extracellular vesicles per milliliter, typically produced using a closed ultrafiltration–chromatography workflow that ensures consistent vesicle size distribution, often within the 30–150 nanometer therapeutic range, a size appropriate for potential cellular signaling applications in regenerative medicine research.
Growing Commercial Investments and Strategic Collaborations in Regenerative Dermatology
The stem cell alopecia treatment market is experiencing strong investment activity, with biotechnology firms, dermatology research institutes, and regenerative medicine companies forming strategic partnerships to accelerate product development. Collaborations focused on stem cell banking, follicular cell line engineering, and iPSC derived follicle organoids are expanding technological capabilities and strengthening commercialization pipelines. Venture capital interest in non-surgical hair restoration technologies is also rising, enabling companies to scale manufacturing, enhance clinical trial execution, and enter new geographic markets. This trend opens substantial opportunities for innovation in off the shelf allogeneic products, cryopreserved cell formulations, and biologically active topical agents. As partnerships expand global distribution networks, providers gain access to more advanced and consistent treatment solutions, supporting widespread adoption.
- For instance, in a major regenerative dermatology collaboration, RIKEN and Organ Technologies jointly advanced their follicular regeneration platform by establishing a manufacturing partnership capable of producing approximately 8,000 autologous follicular units per batch through their cultured dermal papilla cell expansion system one of the largest documented batch scale outputs in follicle bioengineering.
Key Challenges:
High Treatment Costs and Limited Reimbursement Coverage
Despite strong clinical promise, the high cost of stem cell alopecia treatments remains a major barrier to mainstream adoption. Autologous stem cell isolation, processing, and administration require specialized equipment, regulated laboratory environments, and trained personnel, contributing to premium pricing. Additionally, most regenerative hair loss procedures remain categorized as cosmetic, resulting in limited reimbursement from insurance providers. This financial burden restricts access for price sensitive patients and slows adoption across emerging markets. Clinics and hospitals face challenges in justifying technology investments without steady patient volume. Until costs decline through scalable manufacturing, streamlined protocols, and broader payer support, affordability will remain a critical constraint limiting market penetration.
Regulatory Uncertainty and Variability Across Global Markets
Stem cell therapies operate within highly complex and evolving regulatory frameworks, creating compliance challenges for companies and medical providers. Requirements for stem cell manipulation, clinical evidence, and product classification vary widely across regions, complicating product approvals and cross border commercialization. Unstandardized quality control practices, ethical considerations regarding cell sourcing, and strict oversight of cell processing facilities further add to operational hurdles. These factors often extend development timelines, increase costs, and delay market entry for innovative products. Until greater regulatory harmonization and clarity emerge particularly regarding exosome based and minimally manipulated stem cell therapies companies must navigate significant uncertainty that affects strategic planning and global expansion.
Regional Analysis
North America
North America leads the global stem cell alopecia treatment market with approximately 40% share, driven by advanced regenerative medicine infrastructure, high adoption of autologous and exosome based therapies, and strong consumer demand for minimally invasive hair restoration. The U.S. dominates regional uptake due to its robust network of dermatology clinics, active clinical trial pipelines, and strong presence of biotechnology firms investing in follicular stem cell R&D. Favorable regulatory pathways for investigational regenerative therapies and rising prevalence of alopecia areata further reinforce market strength, positioning North America as the most technologically progressive and commercially mature region.
Europe
Europe accounts for roughly 28% of the market, supported by strong clinical research capacity, established dermatology care systems, and rising acceptance of cell based hair regeneration therapies. Germany, France, the U.K., and Italy remain key contributors, benefiting from structured regulatory oversight for stem cell treatments and increasing demand for non-surgical alopecia interventions. The region’s expanding clinical trial activity, particularly in MSC derived and dermal papilla–focused therapies, enhances therapeutic credibility and accelerates commercialization. Growing patient preference for regenerative procedures and collaborations between research institutes and biotech developers continue to elevate Europe’s position as a major market.
Asia Pacific
Asia Pacific holds an estimated 24% share and emerges as the fastest growing region due to rising disposable incomes, strong medical tourism, and rapid expansion of aesthetic and regenerative medicine clinics. Japan, South Korea, China, and India lead adoption as they invest heavily in stem cell research platforms and advanced dermatological technologies. Competitive treatment pricing and high procedure volumes strengthen the region’s commercial appeal. Increasing prevalence of stress induced hair loss among younger populations, combined with early uptake of exosome therapies and follicular regeneration protocols, positions Asia Pacific as a high potential growth hub for the forecast period.
Latin America
Latin America maintains a 7% market share, driven by growing patient interest in premium hair restoration treatments and rising integration of stem cell–based scalp therapies across dermatology clinics. Brazil and Mexico dominate regional demand due to their well-established aesthetic medicine sectors and increasing partnerships with international regenerative medicine companies. Competitive treatment pricing and expanding availability of minimally invasive options support gradual adoption. While regulatory variations and economic constraints moderate growth, strengthening healthcare infrastructure and growing awareness of biologically driven alopecia treatment solutions continue to enhance regional market opportunities.
Middle East & Africa
The Middle East & Africa region captures approximately 5% share, with growth concentrated in the UAE, Saudi Arabia, and Qatar, where high medical tourism and strong investments in premium aesthetic clinics drive adoption of stem cell and exosome based alopecia therapies. Patients increasingly prefer advanced regenerative procedures, supported by rising disposable incomes and expanding access to specialized dermatology centers. However, adoption remains uneven across Africa due to cost barriers and limited clinical infrastructure. Ongoing healthcare modernization and growing interest in non-surgical hair restoration contribute to a steady, albeit gradual, expansion of the regional market.
Market Segmentations:
By Application
By Types
- Alopecia Areata
- Alopecia Totalis
- Alopecia Universalis
By Geography
- North America
- Europe
- Germany
- France
- U.K.
- Italy
- Spain
- Rest of Europe
- Asia Pacific
- China
- Japan
- India
- South Korea
- South-east Asia
- Rest of Asia Pacific
- Latin America
- Brazil
- Argentina
- Rest of Latin America
- Middle East & Africa
- GCC Countries
- South Africa
- Rest of the Middle East and Africa
Competitive Landscape
The competitive landscape of the stem cell alopecia treatment market is shaped by a mix of biotechnology companies, regenerative medicine developers, dermatology clinics, and research focused startups advancing follicular restoration technologies. Leading players prioritize innovations in mesenchymal stem cell (MSC) therapy, adipose derived stem cell platforms, and exosome based regenerative solutions to strengthen clinical outcomes and differentiate their offerings. Companies increasingly invest in clinical trials, scalable manufacturing, and GMP compliant cell processing technologies to meet rising demand for minimally invasive, durable hair regrowth treatments. Strategic collaborations between biotech firms, dermatology institutes, and aesthetic clinics accelerate product validation and global expansion. A notable competitive trend involves the development of allogeneic, off the shelf regenerative formulations aimed at reducing procedure complexity and improving treatment accessibility. As regulatory pathways evolve and clinical evidence broadens, competition intensifies around safety, consistency, and long term efficacy, driving continuous innovation across the global market.
Shape Your Report to Specific Countries or Regions & Enjoy 30% Off!
Key Player Analysis
- Kerastem
- RepliCel
- APEX Biologix
- Sanford Burnham Prebys Medical Discovery Institute
- Belgravia Centre
- Riken Research Institute
Recent Developments:
- In July 2024, Sun Pharmaceutical Industries Limited announced that the U.S. Food and Drug Administration (FDA) approved their LEQSELVI (deuruxolitinib) 8 mg tablets for the treatment of adults with severe alopecia. This approval increased the company’s reputation in the market, along with revenue and expansion of their product portfolio.
- In June 2023, Pfizer Inc. announced that the U.S. Food and Drug Administration (FDA) approved their LITFULO (ritlecitinib), a once daily oral treatment, for individuals 12 years of age and older with severe alopecia areata. This approval enhanced Pfizer’s competitiveness in the alopecia treatment market, particularly as it provided a novel option for a demographic that previously had limited treatment choices.
- In 2023, RepliCel Life Sciences The company’s autologous follicular cell therapy has been under development for years. reviews of the broader field mention RepliCel among active players developing hair restoration stem cell therapies, though no public announcement specified a new clinical trial start or result that year.
Report Coverage:
The research report offers an in depth analysis based on Application, Types and Geography. It details leading market players, providing an overview of their business, product offerings, investments, revenue streams, and key applications. Additionally, the report includes insights into the competitive environment, SWOT analysis, current market trends, as well as the primary drivers and constraints. Furthermore, it discusses various factors that have driven market expansion in recent years. The report also explores market dynamics, regulatory scenarios, and technological advancements that are shaping the industry. It assesses the impact of external factors and global economic changes on market growth. Lastly, it provides strategic recommendations for new entrants and established companies to navigate the complexities of the market.
Future Outlook:
- Stem cell alopecia treatments will gain wider clinical acceptance as long term safety and efficacy data continue to strengthen.
- Exosome based and other cell free regenerative platforms will expand rapidly due to easier regulation, standardized dosing, and broader clinical usability.
- Autologous stem cell procedures will evolve into faster, more efficient protocols with improved follicular regeneration outcomes.
- Allogeneic, off the shelf stem cell solutions will emerge as scalable options, reducing treatment time and increasing accessibility.
- Integration of AI driven diagnostic tools will enhance treatment personalization and patient selection accuracy.
- Dermatology clinics will increasingly adopt regenerative hair restoration as a core service offering.
- Global collaborations between biotech firms and research institutes will accelerate product development and commercialization.
- Costs are expected to decline gradually as manufacturing efficiency and technology standardization improve.
- Regulatory frameworks will mature, offering clearer pathways for approval and clinical deployment.
- Market expansion will intensify in Asia Pacific due to rising medical tourism and strong investment in regenerative medicine.


