
Market Overview
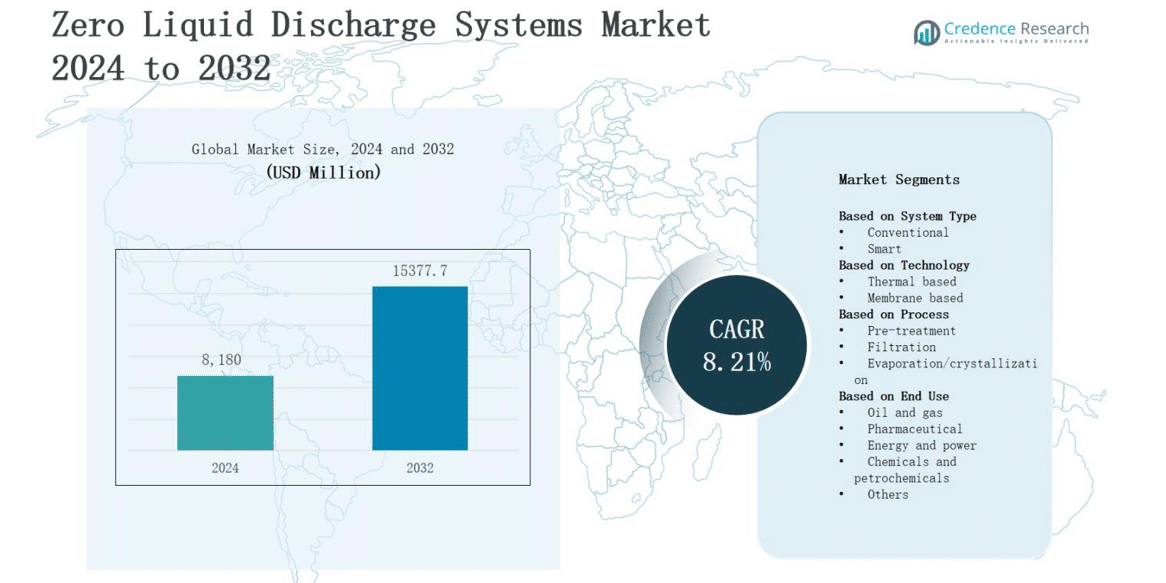
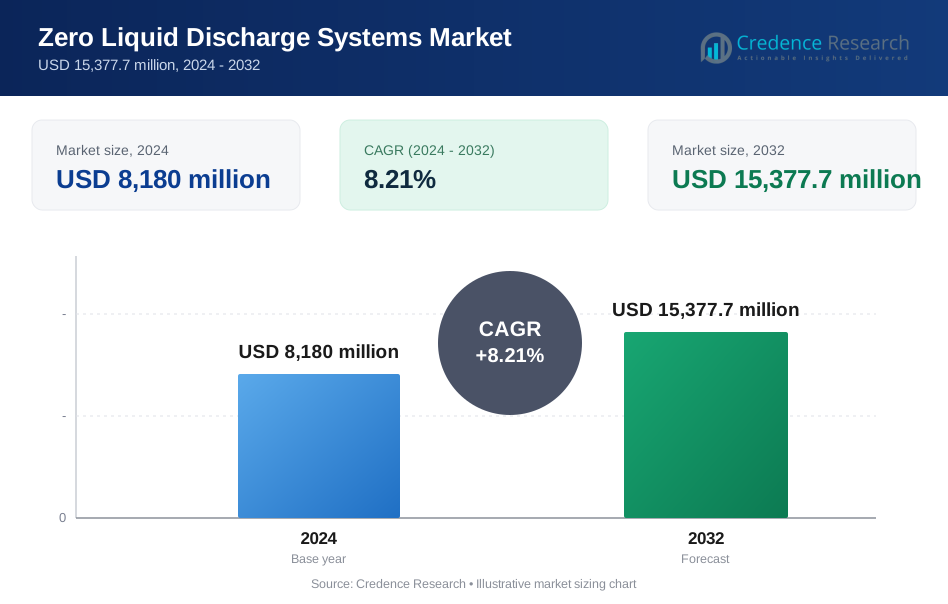
The zero liquid discharge systems market is projected to grow from USD 8,180 million in 2024 to USD 15,377.7 million by 2032, registering a CAGR of 8.21% during the forecast period.| REPORT ATTRIBUTE | DETAILS |
|---|---|
| Historical Period | 2020-2023 |
| Base Year | 2024 |
| Forecast Period | 2025-2032 |
| Zero Liquid Discharge Systems Market Size 2024 | USD 8,180 million |
| Zero Liquid Discharge Systems Market, CAGR | 8.21% |
| Zero Liquid Discharge Systems Market Size 2032 | USD 15,377.7 million |
Market Insights
- The zero liquid discharge systems market is projected to grow from USD 8,180 million in 2024 to USD 15,377.7 million by 2032, at a CAGR of 8.21%.
- Stringent environmental regulations and penalties drive industries to adopt advanced systems ensuring complete elimination of liquid waste streams.
- Rising water scarcity and conservation initiatives encourage industries to recycle and reuse wastewater, reducing dependence on limited freshwater sources.
- Industrial growth in power, chemicals, pharmaceuticals, and textiles fuels demand for efficient wastewater management and resource recovery solutions.
- Technological advancements in membranes, thermal systems, and modular designs enhance efficiency, reduce costs, and enable flexible adoption.
- High capital investment, energy consumption, and complex system integration remain major challenges for small and medium enterprises.
- Geographically, North America holds 34% share, Europe 28%, Asia Pacific 25%, Latin America 7%, and the Middle East & Africa 6%, led by industry expansion and water security goals.
Market Drivers
Stringent Environmental Regulations and Compliance Requirements
The zero liquid discharge systems market expands with governments enforcing strict wastewater discharge regulations to protect water bodies and ecosystems. Industries face mounting pressure to comply with environmental laws that restrict effluent disposal, making adoption of advanced treatment systems essential. It addresses regulatory compliance by ensuring complete elimination of liquid waste streams. Growing penalties for non-compliance and strong monitoring frameworks push industries to invest in zero liquid discharge solutions, strengthening long-term adoption.- For instance, The R.D. Nixon Power Plant in Colorado has used a ZLD system since 1980 to treat all wastewater, ensuring regulatory compliance and cost reduction.
Rising Water Scarcity and Conservation Initiatives
The zero liquid discharge systems market benefits from global concerns over water scarcity and resource depletion. Rapid industrialization and urbanization intensify freshwater demand, creating pressure on limited resources. It enables industries to recycle and reuse wastewater, reducing dependence on freshwater sources. Governments and organizations promote conservation policies that emphasize sustainable practices. Growing awareness of responsible water usage and climate change impacts further drive adoption of zero liquid discharge technologies across high water-consuming industries.- For instance, the National Thermal Power Corporation (NTPC) plant in Tamil Nadu adopted a ZLD system that recycles 100% of its wastewater, saving millions of liters of freshwater annually. This has greatly lowered its environmental impact in a water-scarce region.
Industrial Growth and Wastewater Management Needs
The zero liquid discharge systems market gains traction with increasing industrial output across power generation, pharmaceuticals, chemicals, and textiles. High volumes of wastewater generated by these industries demand efficient treatment and recycling solutions. It supports operational efficiency by reducing wastewater disposal costs and recovering valuable byproducts such as salts and chemicals. Rising industrial expansions in emerging economies amplify the requirement for advanced wastewater solutions, reinforcing demand for sustainable discharge systems globally.Technological Advancements and Cost Optimization
The zero liquid discharge systems market benefits from technological innovation that improves efficiency and reduces costs. Integration of advanced membranes, thermal systems, and real-time monitoring enhances performance and reliability. It enables energy savings while ensuring higher recovery rates of reusable water. Modular system designs make adoption more flexible and cost-effective for varied industries. Continuous R&D investments and collaboration between technology providers and end users accelerate innovation, driving greater adoption of zero liquid discharge systems.Market Trends
Adoption of Digital Monitoring and Smart Control Systems
The zero liquid discharge systems market witnesses strong adoption of digital technologies that enhance process visibility and performance efficiency. Industries implement IoT-enabled sensors, AI-driven analytics, and cloud-based platforms to track water quality, recovery rates, and energy usage in real time. It helps operators predict maintenance requirements and minimize downtime. Digital integration ensures compliance reporting accuracy and supports optimization of system performance. Growing reliance on smart water management accelerates the digitalization trend across industries.- For instance, cloud-based platforms like Veolia’s Hubgrade™ enable real-time remote monitoring and predictive maintenance to minimize downtime at power plants using ZLD systems, boosting operational uptime by 15-20% through expert oversight and digital alerts.
Shift Toward Modular and Scalable System Designs
The zero liquid discharge systems market evolves with rising demand for modular and scalable systems suitable for diverse industrial applications. Industries seek flexible designs that allow phased expansion and reduced upfront capital investments. It enables organizations to adapt to changing regulatory norms and capacity requirements while controlling costs. Prefabricated modular solutions reduce installation time and complexity, making adoption feasible for mid-sized industries. This shift toward modularity strengthens operational adaptability and broadens adoption across multiple sectors.- For instance, containerized ZLD plants combine vacuum evaporators and membrane filtration in compact, modular containers that enable rapid installation and easy transportation, making them ideal for factories with limited space.
Focus on Energy-Efficient and Sustainable Technologies
The zero liquid discharge systems market trends emphasize energy-efficient operations that lower lifecycle costs and reduce environmental impact. Advances in membrane filtration, hybrid evaporation-crystallization, and low-energy thermal systems drive sustainability in wastewater management. It allows industries to optimize resource recovery while meeting carbon reduction targets. Sustainable system designs integrate renewable energy use and environmentally friendly materials. The trend reflects increasing alignment with global decarbonization initiatives, encouraging industries to embrace green water treatment technologies for competitive advantage.Integration of Circular Economy and Resource Recovery Practices
The zero liquid discharge systems market aligns closely with circular economy initiatives that focus on resource recovery and waste minimization. Companies adopt systems that reclaim valuable byproducts such as salts, minerals, and reusable water streams. It reduces raw material dependency and strengthens profitability through byproduct utilization. Circular economy integration enhances corporate sustainability credentials and drives compliance with global ESG goals. Growing emphasis on resource efficiency positions zero liquid discharge systems as key enablers of long-term sustainability.Market Challenges Analysis
High Capital Investment and Operational Costs
The zero liquid discharge systems market faces challenges due to the significant upfront capital expenditure required for installation and operation. Advanced components such as evaporators, crystallizers, and membrane systems increase system costs, making adoption difficult for small and medium enterprises. It also requires substantial energy input, which raises ongoing operational expenses and impacts profitability. High maintenance demands and technical expertise further add to the overall burden. These cost-related barriers restrict widespread adoption despite strong regulatory and environmental drivers.Complex System Integration and Technical Limitations
The zero liquid discharge systems market encounters obstacles linked to the complexity of integrating advanced technologies into existing industrial frameworks. It requires careful alignment with plant infrastructure, which often increases implementation time and project risk. Operational challenges include scaling, fouling of membranes, and high energy consumption in thermal processes. Lack of skilled personnel to manage sophisticated systems amplifies inefficiencies. These technical and integration hurdles create reluctance among industries, limiting accelerated adoption across diverse sectors.Market Opportunities
Growing Demand in Emerging Economies and Industrial Expansion
The zero liquid discharge systems market presents significant opportunities in emerging economies where rapid industrialization drives higher wastewater generation. Expanding sectors such as power, textiles, pharmaceuticals, and chemicals create strong demand for advanced treatment solutions. It enables industries to address both regulatory compliance and resource conservation goals. Government initiatives promoting sustainable water management strengthen adoption potential. Rising foreign investments and infrastructure development projects further expand market opportunities across Asia Pacific, Latin America, and the Middle East.Innovation in Energy-Efficient and Hybrid Technologies
The zero liquid discharge systems market benefits from opportunities created by continuous innovation in energy-efficient and hybrid treatment technologies. It integrates advanced membranes, crystallizers, and low-energy thermal systems to reduce operating costs and improve performance. Hybrid models that combine multiple treatment methods enhance scalability and reliability across industries. Strong R&D investments from technology providers accelerate system advancements. Growing emphasis on circular economy and resource recovery expands market prospects, positioning zero liquid discharge systems as strategic solutions for sustainability.Market Segmentation Analysis:
By System Type The zero liquid discharge systems market is segmented into conventional and smart systems. Conventional systems dominate adoption in industries with established wastewater treatment frameworks, offering proven reliability. It remains cost-intensive but ensures compliance with stringent environmental norms. Smart systems gain traction with digital integration, real-time monitoring, and predictive maintenance capabilities. Their ability to enhance efficiency and reduce downtime positions them as the preferred choice for industries seeking sustainable and cost-optimized operations.- For instance, companies like SUEZ and Schneider Electric have partnered to implement IoT-enabled digital solutions that enhance water cycle management, improving system efficiency and reducing downtime
- For instance, Memsift Innovations offers membrane distillation-based ZLD solutions using highly hydrophobic hollow fiber membranes that achieve up to 100% water recovery with about 50% energy savings compared to conventional thermal systems.
Segments:
Based on System Type- Conventional
- Smart
- Thermal based
- Membrane based
- Pre-treatment
- Filtration
- Evaporation/crystallization
- Oil and gas
- Pharmaceutical
- Energy and power
- Chemicals and petrochemicals
- Others
- North America
- U.S.
- Canada
- Mexico
- Europe
- Germany
- France
- U.K.
- Italy
- Spain
- Rest of Europe
- Asia Pacific
- China
- Japan
- India
- South Korea
- South-east Asia
- Rest of Asia Pacific
- Latin America
- Brazil
- Argentina
- Rest of Latin America
- Middle East & Africa
- GCC Countries
- South Africa
- Rest of the Middle East and Africa
Regional Analysis
North America The Zero liquid discharge systems market in North America holds 34% share, driven by strict environmental regulations and high industrial water consumption. Power generation, chemical, and pharmaceutical industries lead adoption to comply with stringent discharge norms. It benefits from strong technological infrastructure and high R&D investments, enabling integration of smart and energy-efficient solutions. The U.S. dominates regional demand, supported by government policies promoting sustainable water practices. Growth is reinforced by increasing focus on circular economy and resource recovery initiatives. Europe Europe accounts for 28% share of the Zero liquid discharge systems market, supported by sustainability-driven regulations and industry-wide adoption of advanced wastewater solutions. Countries such as Germany, France, and the UK prioritize green technologies, driving demand for energy-efficient and low-emission systems. It gains momentum from EU policies targeting water conservation and carbon footprint reduction. Growing adoption in the textile, food processing, and specialty chemicals sectors enhances market presence. Technological partnerships and innovation-driven initiatives sustain growth across the region. Asia Pacific The Zero liquid discharge systems market in Asia Pacific captures 25% share, fueled by rapid industrialization and rising water scarcity challenges. China and India lead demand, driven by expanding power, textile, and pharmaceutical sectors. It receives strong government support through stricter wastewater management laws and conservation programs. Adoption rises with foreign investments in manufacturing and infrastructure projects. Increasing awareness of sustainable water practices and advancements in hybrid ZLD technologies accelerate regional market growth. Latin America Latin America represents 7% share of the Zero liquid discharge systems market, with demand rising from mining, oil and gas, and power generation sectors. Brazil and Mexico dominate regional adoption with large-scale industrial activities requiring advanced wastewater management. It faces challenges from limited capital investment but benefits from increasing government emphasis on environmental protection. Rising industrial expansions and modernization projects create opportunities for adoption. Growing alignment with global sustainability standards strengthens long-term market potential. Middle East & Africa The Zero liquid discharge systems market in the Middle East & Africa holds 6% share, largely driven by acute water scarcity and reliance on desalination. GCC nations lead demand with significant investments in wastewater recycling for industrial applications. It supports regional water security goals and aligns with government-led sustainability frameworks. Mining and energy industries adopt systems to comply with regulations and reduce freshwater dependency. Increasing infrastructure projects and resource conservation initiatives stimulate further market expansion.Key Player Analysis
- Saltworks Technologies
- Petro Sep Corporation
- Aquarion
- Praj Industries
- Alfa Laval
- GEA Group
- Aquatech International
- IDE Water Technologies
- H2O
- SafBon Water Technology
- Evoqua Water Technologies
- Mitsubishi Power
Competitive Analysis
The Zero liquid discharge systems market is highly competitive with global and regional players focusing on technological innovation, sustainability, and cost efficiency to strengthen their positions. Companies such as Alfa Laval, Aquarion, Aquatech International, Evoqua Water Technologies, GEA Group, H2O, IDE Water Technologies, Mitsubishi Power, Petro Sep Corporation, Praj Industries, SafBon Water Technology, and Saltworks Technologies lead the industry with diversified portfolios and strong project execution capabilities. It emphasizes energy-efficient designs, modular solutions, and integration of digital monitoring to address rising demand across power, chemicals, pharmaceuticals, and textile industries. Strategic alliances, R&D investments, and geographic expansion remain key approaches to capture emerging opportunities and maintain competitive advantage.Recent Developments
- In March 2025, Archroma partnered with Gradiant to implement an advanced ZLD solution at its Mahachai plant in Thailand, enabling 90–95% wastewater recovery and mineral extraction.
- In July 2024, UCC Environmental and Vacom Systems entered a strategic teaming agreement to deliver advanced ZLD solutions for coal-fired power plants across North America, aligning with new EPA effluent standards.
- In 2023, Evoqua Water Technologies was acquired by Xylem Inc., expanding ZLD offerings and strengthening its global water treatment capabilities with advanced high-brine evaporator technologies.
- In July 2023, SUEZ formed a partnership with Schneider Electric to integrate its digital AQUAADVANCED solution into Schneider’s EcoStruxure water advisor platform, enhancing carbon impact, resource conservation, and energy-efficiency in water cycle management.
Market Concentration & Characteristics
The Zero liquid discharge systems market demonstrates moderate to high concentration, shaped by the presence of established global players alongside emerging regional companies. It is characterized by strong entry barriers due to high capital requirements, advanced technological expertise, and compliance-driven demand. Leading companies focus on energy-efficient designs, modular systems, and hybrid technologies to address diverse industrial applications. Competitive intensity remains strong, with firms investing in R&D, strategic collaborations, and digital integration to enhance operational efficiency and cost-effectiveness. The market reflects a balance between large multinational corporations with global reach and specialized providers targeting niche industries, ensuring innovation and adaptability. Regulatory enforcement, rising water scarcity, and sustainability mandates reinforce long-term stability and sustained demand. The industry shows consistent consolidation trends, with players seeking mergers, acquisitions, and strategic alliances to expand geographical presence and strengthen competitive positioning in a growing and compliance-driven environment.Report Coverage
The research report offers an in-depth analysis based on System Type, Technology, Process, End-User and Geography. It details leading market players, providing an overview of their business, product offerings, investments, revenue streams, and key applications. Additionally, the report includes insights into the competitive environment, SWOT analysis, current market trends, as well as the primary drivers and constraints. Furthermore, it discusses various factors that have driven market expansion in recent years. The report also explores market dynamics, regulatory scenarios, and technological advancements that are shaping the industry. It assesses the impact of external factors and global economic changes on market growth. Lastly, it provides strategic recommendations for new entrants and established companies to navigate the complexities of the market.Future Outlook
- Stricter global environmental regulations will accelerate widespread adoption of zero liquid discharge systems worldwide.
- Industries will prioritize hybrid and energy-efficient treatment technologies to optimize wastewater recovery and cost efficiency.
- Digital monitoring, automation, and predictive analytics will significantly improve operational reliability and system efficiency.
- Rapid industrialization and infrastructure growth in emerging economies will drive large-scale adoption of systems.
- Rising water scarcity will push industries to recycle wastewater and reduce dependence on freshwater.
- Modular and scalable designs will dominate demand by offering flexibility, lower costs, and adaptability.
- Recovery of salts, minerals, and reusable water will generate additional revenue streams for industries.
- Strategic collaborations, mergers, and acquisitions will enhance market penetration and strengthen global competitiveness.
- Government initiatives promoting sustainability and circular economy practices will increase deployment across industrial sectors.
- Ongoing R&D investments will advance innovative technologies and enhance cost-effectiveness of zero liquid discharge systems.
Request a Free Sample
Fill in your details and we'll send you a free sample report.
- Sample data tables & charts
- Research methodology
Need a Custom Version of This Report?
Tailor the scope, geography, or segments to your exact requirements.
- Custom geography or segment scope
- Direct access to our analyst team
Frequently Asked Questions
What is the current market size for the Zero liquid discharge systems market, and what is its projected market size by the end of 2032?
At what Compound Annual Growth Rate is the Zero liquid discharge systems market projected to expand during the forecast period of 2025 to 2032?
What are the primary drivers fueling growth of the Zero liquid discharge systems market across multiple industries worldwide during the coming forecast period?
Who are the globally recognized leading companies operating within the Zero liquid discharge systems market with strong technological capabilities and wide industry presence?
Table of Content
Chapter 1. Report Introduction
- 1.1 Report Description & Purpose
- 1.1.1 Report Title & Market Definition
- 1.1.2 Unique Selling Propositions (USP) & Key Differentiators
- 1.1.3 Value Proposition for Stakeholders
- 1.2 Research Objectives
- 1.2.1 Market Sizing Objectives (Volume & Revenue)
- 1.2.2 Segmentation Objectives
- 1.2.3 Competitive Intelligence Objectives
- 1.2.4 Forecast & Scenario Objectives
- 1.3 Report Scope
- 1.3.1 Zero Liquid Discharge Systems Scope – Types & Subtypes Covered
- 1.3.2 Geographic Scope – Regions & Countries Covered
- 1.3.3 Historical Period, Base Year & Forecast Period (2024; forecast to 2032)
- 1.3.4 Inclusions & Exclusions
- 1.4 HS Code & Classification Framework
- 1.5 Currency, Units & Pricing Basis
- 1.6 Target Stakeholders
- 1.7 Limitations & Assumptions
Chapter 2. Executive Summary
- 2.1 Global Zero Liquid Discharge Systems Market Snapshot
- 2.1.1 Market Size – Historical (2024) & Forecast (2024-2032) (2024: USD 8,180 million → 2032: USD 15,377.7 million)
- 2.1.2 Volume & Revenue – Global Totals
- 2.1.3 Key Market Highlights – Top Five Facts
- 2.2 Zero Liquid Discharge Systems Market Segmentation Snapshot
- 2.2.1 Market Split by Region – 2024 vs. 2032
- 2.3 Competitive Snapshot
- 2.3.1 Top 10 Players by Revenue Share – 2024
- 2.3.2 Top 10 Players by Volume Share – 2024
- 2.3.3 Recent Strategic Developments (18-Month Summary)
- 2.4 Key Investment Highlights & Strategic Conclusions
Chapter 3. Zero Liquid Discharge Systems Market Dynamics & Industry Analysis
- 3.1 Market Overview & Context
- 3.1.1 Zero Liquid Discharge Systems Market Position in the Broader Automotive Value Chain
- 3.1.2 OEM vs. Replacement Market Dynamics
- 3.1.3 Market Maturity & Development Stage by Region
- 3.2 Zero Liquid Discharge Systems Market Drivers
- 3.3 Zero Liquid Discharge Systems Market Restraints & Challenges
- 3.4 Zero Liquid Discharge Systems Market Opportunities
- 3.5 Porter's Five Forces Analysis
- 3.5.1 Threat of New Entrants
- 3.5.2 Bargaining Power of Suppliers
- 3.5.3 Bargaining Power of Buyers
- 3.5.4 Threat of Substitutes
- 3.5.5 Competitive Rivalry – Intensity Assessment
- 3.6 Zero Liquid Discharge Systems Value Chain Analysis
- 3.6.1 Upstream – Raw Material/Input Suppliers
- 3.6.1.1 Raw Material/Input 1
- 3.6.1.2 Raw Material/Input 2
- 3.6.1.3 Raw Material/Input 3
- 3.6.2 Midstream – Production/Manufacturing/Service Delivery
- 3.6.2.1 Production/Process Overview
- 3.6.2.2 Key Facility Locations & Capacity by Manufacturer
- 3.6.3 Downstream – Distribution & End Consumer
- 3.6.3.1 Primary Channel – B2B/OEM
- 3.6.3.2 Secondary Channels – Dealer, Retail, Online, Direct
- 3.6.4 Value Chain Profitability Analysis
- 3.6.1 Upstream – Raw Material/Input Suppliers
- 3.7 PESTEL Analysis
- 3.7.1 Political Factors
- 3.7.2 Economic Factors
- 3.7.3 Social Factors
- 3.7.4 Technological Factors
- 3.7.5 Environmental Factors
- 3.7.6 Legal Factors
- 3.8 Zero Liquid Discharge Systems Supply Chain Analysis
- 3.8.1 Raw Material/Input Supply Risk Assessment
- 3.8.2 Manufacturing Concentration Risk (Geographic Exposure)
- 3.8.3 Trade Disruption Impact Analysis
- 3.9 Regulatory & Policy Landscape
Note: The regulatory and policy landscape section covers regulations based on their applicability to the market, Zero Liquid Discharge Systems category, geography, and scope of the study. Only regulatory frameworks with a material impact on operations, compliance, trade, sustainability, or market access are analyzed in detail.
Chapter 4. Key Investment Pockets & Opportunity Analysis
- 4.1 Zero Liquid Discharge Systems Market Attractiveness Analysis
- 4.1.1 By Region – Investment Attractiveness Matrix (Volume × CAGR)
- 4.2 Absolute Revenue Growth Opportunity
- 4.2.1 By Region – Absolute USD Growth Through 2032
- 4.3 Incremental Volume Opportunity
- 4.3.1 By Region – Incremental Volume Through 2032
- 4.3.2 Segment – Incremental Volume
- 4.4 Emerging Submarket Opportunity Deep Dive (Subject to Applicability)
- 4.5 Emerging Market Opportunity Scorecards
- 4.5.1 United States
- 4.5.2 Europe
- 4.5.3 Asia
- 4.5.4 Middle East & Africa
Note: Emerging Market Opportunity Scorecards will be included based on relevance and strategic importance. Regions listed are indicative and may vary depending on data availability and market dynamics.
Chapter 5. Zero Liquid Discharge Systems Import-Export Analysis & Trade Flows
- 5.1 Global Trade Overview
- 5.1.1 Global Export Value by Country (2024)
- 5.1.2 Global Export Volume by Country (2024)
- 5.1.3 Global Import Value by Country (2024)
- 5.1.4 Global Import Volume by Country (2024)
- 5.1.5 Net Trade Balance by Country (2024)
- 5.2 Export Analysis – Segment
- 5.2.1 Type 1 (HS Code)
- 5.2.2 Type 2 (HS Code)
- 5.2.3 Type 3 (HS Code)
- 5.2.4 Type 4 (HS Code)
- 5.2.5 Type 5 (HS Code)
- 5.3 Import Analysis – Segment
- 5.3.1 Type 1 (HS Code)
- 5.3.2 Type 2 (HS Code)
- 5.3.3 Type 3 (HS Code)
- 5.3.4 Type 4 (HS Code)
- 5.3.5 Type 5 (HS Code)
- 5.4 Average Unit Trade Prices
- 5.4.1 Average Export Price – Segment & Country
- 5.4.2 Average Import Price – Segment & Source Country
- 5.4.3 Price Trends (2024)
- 5.5 Key Trade Route Analysis
- 5.5.1 Trade Route 1
- 5.5.2 Trade Route 2
- 5.5.3 Trade Route 3
- 5.5.4 Trade Route 4
- 5.5.5 Trade Route 5
- 5.6 Trade Policy Impact Assessment
- 5.6.1 US Anti-Dumping & Section 301 Tariffs
- 5.6.2 EU Customs Union Impact
- 5.6.3 Major Free Trade Agreements
- 5.6.4 USMCA Rules of Origin
Note: Trade policy analysis will be included only where relevant to the Zero Liquid Discharge Systems market.
Chapter 6. Competitive Landscape & Company Benchmarking
- 6.1 Zero Liquid Discharge Systems Market Concentration & Structure
- 6.1.1 Herfindahl-Hirschman Index (HHI) – vs. 2024
- 6.1.2 Tier 1, Tier 2 & Tier 3 Market Structure
- 6.1.3 Global, Regional & Local Player Dynamics
- 6.2 Zero Liquid Discharge Systems Market Share Analysis – 2024
- 6.2.1 Global Revenue Share by Company
- 6.2.2 Global Volume Share by Company
- 6.2.3 Regional Revenue Share
- 6.2.4 Market Share Evolution ( vs. 2024)
- 6.2.5 OEM Segment Share by Company
- 6.2.6 Replacement Segment Share by Company
- 6.3 Production/Delivery Capacity & Facility Analysis
- 6.3.1 Global Installed Capacity
- 6.3.2 Capacity Utilization Rates
- 6.3.3 Production/Output Volume
- 6.3.4 Facility Locations & Capacity Map
- 6.3.5 Planned Capacity Additions
- 6.4 Zero Liquid Discharge Systems Competitive Benchmarking Matrix
- 6.4.1 Revenue, Volume, CAGR & Profitability Comparison
- 6.4.2 Channel Revenue Mix
- 6.4.3 Geographic Revenue Exposure
- 6.4.4 R&D Intensity
- 6.4.5 Sustainability Maturity
- 6.5 Strategic Developments in Zero Liquid Discharge Systems (Last 24 Months)
- 6.5.1 Mergers, Acquisitions & Divestments
- 6.5.2 New Zero Liquid Discharge Systems Launches
- 6.5.3 Facility Expansions
- 6.5.4 Strategic Alliances, Joint Ventures & Partnerships
- 6.5.5 Distribution Expansion & Market Entry
- 6.5.6 Sustainability & ESG Initiatives
- 6.6 Competitive Strategy Mapping
- 6.6.1 Leader, Challenger, Follower & Niche Classification
- 6.6.2 Pricing Strategy Comparison
- 6.6.3 Channel Strategy Matrix
Note: Strategic developments are included based on their materiality and the availability of reliable information.
Chapter 7. Global Zero Liquid Discharge Systems Market – By Distribution Channel
- 7.1 Segment Overview
- 7.1.1 Volume & Revenue Split by Channel (2024 & 2032)
- 7.1.2 Channel Mix Evolution (2024-2032)
Chapter 8. Regional Market Analysis – Global Overview
- 8.1 Global Regional Overview
- 8.1.1 Regional Volume Share
- 8.1.2 Regional Revenue Share
- 8.1.3 Regional Volume by Region
- 8.1.4 Regional Revenue by Region
- 8.1.5 Regional Forecast Through 2032
- 8.2 Cross-Regional Segment Analysis
- 8.2.1 By Distribution Channel
- 8.2.2 By Brand/Price Tier
Chapter 9. North America Zero Liquid Discharge Systems Market
- 9.1 United States
- 9.2 Canada
- 9.3 Mexico
Chapter 10. Europe Zero Liquid Discharge Systems Market
- 10.1 Germany
- 10.2 France
- 10.3 Italy
- 10.4 United Kingdom
- 10.5 Spain
- 10.6 Poland
- 10.7 Russia
- 10.8 Netherlands
- 10.9 Belgium
- 10.10 Sweden
- 10.11 Denmark
- 10.12 Norway
- 10.13 Rest of Europe
Chapter 11. Asia Pacific Zero Liquid Discharge Systems Market
- 11.1 China
- 11.2 India
- 11.3 Japan
- 11.4 South Korea
- 11.5 Thailand
- 11.6 Indonesia
- 11.7 Vietnam
- 11.8 Malaysia
- 11.9 Australia
- 11.10 Rest of Asia Pacific
Chapter 12. Latin America Zero Liquid Discharge Systems Market
- 12.1 Brazil
- 12.2 Argentina
- 12.3 Colombia
- 12.4 Chile
- 12.5 Rest of Latin America
Chapter 13. Middle East Zero Liquid Discharge Systems Market
- 13.1 Saudi Arabia
- 13.2 United Arab Emirates
- 13.3 Turkey
- 13.4 Israel
- 13.5 Iran
- 13.6 Rest of the Middle East
Chapter 14. Africa Zero Liquid Discharge Systems Market
- 14.1 South Africa
- 14.2 Egypt
- 14.3 Nigeria
- 14.4 Morocco
- 14.5 Rest of Africa
Chapter 15. Zero Liquid Discharge Systems Company Profiles
- 15.1 [Company 01]
- 15.1.1 Company Overview
- 15.1.2 Key Management Personnel
- 15.1.3 Products & Services Portfolio
- 15.1.4 Financial Performance
- 15.1.5 Key Market Focus & Geographic Presence
- 15.1.6 Recent Developments & Strategic Initiatives
Note: The company profile list is preliminary and may change based on research findings, market developments, data availability, and client requirements.
Chapter 16. Appendices
- Appendix A – List of Abbreviations & Acronyms
- Appendix B – Industry Classification Code Reference – Full Series
- Appendix C – Production & Capacity Data Tables
- Appendix D – End-Use & Demand Base Tables
- Appendix E – Consumption & Replacement Rate Assumptions
- Appendix F – ASP Reference Tables
- Appendix G – Manufacturing & Facility Database
- Appendix H – Import-Export Data Tables
- Appendix I – Regulatory Summary Tables
- Appendix J – Primary Research Participant List (Anonymized)
- Appendix K – Primary Research Questionnaire Framework
- Appendix L – Data Sources & Bibliography
- Appendix M – Market Size Divergence & Source Comparison
Chapter 17. Research Methodology
- 17.1 Research Framework & Philosophy
- 17.2 Secondary Research – Sources, Hierarchy & Data Extraction
- 17.3 Data Modeling – Bottom-Up & Top-Down Market Sizing
- 17.4 Primary Research – Stakeholder Framework, LOI & Sample Sizes
- 17.5 Forecast Methodology – Regression, Scenario & Sensitivity Analysis
- 17.6 Quality Control – Four-Layer Validation Framework
- 17.7 Limitations & Standard Assumptions
- 17.8 Disclaimer